ISSN Online: 1940-9907 ISSN Print: 1940-9893
Research on the Network Structure and
Evolution of Spatial Distribution of Universities’
Cross-Regional Technology Transfer
Yi Tang, Wei Song
The School of Public Affairs, University of Science and Technology of China, Hefei, China
Abstract
Universities are important components of national innovation systems. Their cross-regional technology transfer is of great importance for narrowing re-gional technology gaps and realizing collaborative innovation. Based on 2007- 2016 patent assignment data of Chinese university, this paper investigates the network structure and evolution law of spatial distribution of universities’ cross-regional technology transfer through the social network analysis and GIS spatial analysis. Results show that: (1) Areas with abundant education resources have advantages at technology export, while economically devel-oped areas have become the main target for technology import. In China, the development of technology export and import is generally imbalanced within a province; (2) In the evolution process of technology transfer struc-ture, the dyadic relationship usually turn from a “strong-weak” relationship to a “strong-strong” one, and there exists a positive correlation between the equalization level of the nodes in the structure and the transfer level of uni-versities’ technology; (3) The evolution of the spatial distribution of universi-ties’ technology transfer demonstrates a trend of diffusion from core areas lo-cated on the south-east coast to inland areas. Provinces in the core areas can significantly promote the technology transfer level of surrounding provinces, and an obvious geographic feature is shown in the universities’ technology transfer between different areas.
Keywords
University, Cross-Regional Technology Transfer, Network Structure, Spatial Distribution
1. Introduction
In the past, most of the universities in China focused on fundamental research How to cite this paper: Tang, Y. and Song,
W. (2017) Research on the Network Struc-ture and Evolution of Spatial Distribution of Universities’ Cross-Regional Technology Transfer. Journal of Service Science and Management, 10, 112-124.
https://doi.org/10.4236/jssm.2017.102010
Received: March 4, 2017 Accepted: April 10, 2017 Published: April 13, 2017
Copyright © 2017 by authors and Scientific Research Publishing Inc. This work is licensed under the Creative Commons Attribution International License (CC BY 4.0).
and education, technical achievements belong to national government. Few technologies were transferred to industries and achieved commercialization. However, with the development of the economic and the transformation of the economic growth mode, universities’ cross-regional technology transfer is re-garded as a useful way to narrow regional gap and assist in economic develop-ment. As an important source of technology innovation, universities are a vital part in the innovation system of countries and regions. Ministry of Education and Technology has indicated in the document of “Opinions on improving uni-versities’ technology outcome transformation” that technology transformation is a critical section of universities’ technological activities, and to promote it would considerably achieve innovation-driven development and improve universities’ ability of serving the society.
Since technology transformation involves knowledge flow, the process can not only achieve commercialization of universities’ technology but also positively in-fluence the local industries and economy. Besides, there exists a significant dif-ference in technological resources, innovation capability and economic devel-opment between different regions due to factors such as resource distribution and surrounding environment and technology transformation can effectively bridge this gap and realize mutual development. With the development of tech-nology transfer, the research on that area is becoming more and more impor-tant. Through status analysis, the current situation of technology transfer can be easily understood and based on this, the influence of technology transfer and the means to improve transfer efficiency can be easily to study in the future.
This report analyzed the technology transformation network and spatial dis-tribution of Chinese universities, summarized the features and evolution pat-terns of the transformation between various regions and combined research re-sults and the current situation in order to deduct the reasons behind the evolu-tion and provide suggesevolu-tions about how to promote cross region technology transformation to achieve collaborative innovation and economic development.
2. Literature Review
The lack of the empirical research limited scholars to explore further themes on that area.
In recent years, with the technology development and encouragement of na-tional policy, patent transfer and technical contract have become positive inte-raction modes between universities and industries, which lead to a rapid increase of patent and trade data and therefore bring attention to researches. During that period, most of the scholars used social network theory based on patent licens-ing data or technical trade amount to construct transfer network and study the pattern, evolution and other features of the network. Tao Lei et al adopted visua-lized social network analysis method which analyzed the evolution process of university-enterprise cooperative application network from 1985 to 2008 from three aspects including region, technology and universities [3]. Yanyan Ma et al analyzed the scale, density and centrality of patent application network by estab-lishing the Chinese university-enterprise cooperative patent application diagram
[4]. Liguo Luo et al reached the conclusion that there is a positive correlation between the amount of patent licensing and the extent of knowledge exchange by studying knowledge exchange pattern of 985 universities based on patent data
[5].
As the outcome of technology innovation, patent is crucial in realizing tech-nology transfer [6]. Compared to patent licensing, patent assignment is more capable of ensuring uniformity of the ownership and right to use of a patent. The amount and development rate of patent assignment in Chinese universities largely exceed that of patent licensing, which demonstrates that patent assign-ment is better accepted in relevant industries. Besides, the direction of patent as-signment can also illustrate the position of the main subject in technology trans-fer relations and networks more clearly than technical trade amount. To con-clude, it is more reasonable to adopt patent assignment as the index to measure the technology transfer situation. Recently, several scholars attempt to analyze the transfer pattern based on patent assignment. Chunbo Zhang et al chose “985 project” universities as research samples and based their study on these universi-ties’ independently authorized patent data in SIPO (State Intellectual Property Office). They established patent assignment route by investigating information of assigner and assignee. By analyzing the relations between the universities which apply for the patent, assigner and assignee, the patent technology transfer of these universities can be concluded into 6 modes including direct transfer of patents, asset management, unit of university, university-enterprise cooperation in R&D, local government-university cooperation in R&D, academic entrepre-neurship, patent-assertion entities [7]. Compared to the study on pattern and rough non-direction network, profounder research on technology transfer are benefit to illustrate lows and trends.
3. Data and Research Method
3.1. Data Source
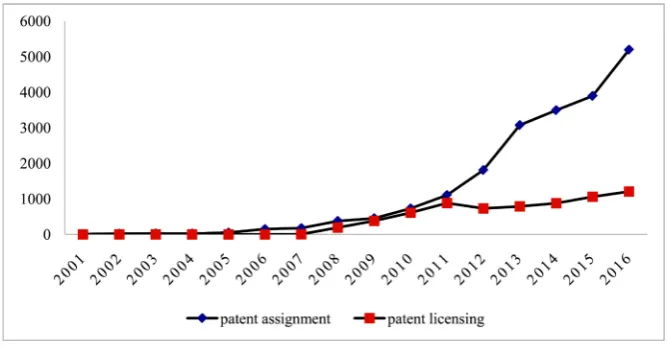
2001 to 2016 to analyses the university technology transfer situation across dif-ferent regions, and all the data came from the Incopat patent database. As one of the most authoritative patent database in China, Incopat patent database has been highly recognized by over 1000 institutional clients. The database collects more than 100 million pieces of patents and makes an integration of functions including analysis, monitoring and so on. Patent assignment includes the assign- ment of application right and the assignment of patent right. To reflect the real situation of universities’ technology transfer, this report only used the patent as-signment information of authorized patents before December 31, 2016 and the first applicant is university. According to the Figure 1 of patent assignment amount statistics, universities’ patent assignment increased gradually from 2005. And after a slow rise from 2005 to 2010, the growth rate experienced a signifi-cant increase after 2010, with the fastest growth rate appearing in 2013 and 2016. After pre-treatment and analysis of the data, this report chose the patent as-signment data of four representative years to study the evolution trend, which are 2007, 2010, 2013 and 2016.
3.2. Research Method
In this report, two methods are mainly adopted including social network analy-sis and GIS spatial method.
Social network analysis method was used to establish the patent assignment network among universities of 31 provinces (HongKong, Macao, Taiwan ex-cluded) across the whole country,in which the provinces are represented by the nodes. The ties between the nodes stand for patent assignments, and the direc-tions of the ties stand for the direcdirec-tions of transfer. Social network analysis is widely used to analyses the knowledge flow and technology transfer which use patent as the medium [8]. For example, Thompson studied knowledge export across regions by patent quotation network [9]. Shangqi Si studied the coopera-tion network of different cities from patent alliance and found out that the key of promoting the development of the alliance is to cultivate cities with a strong po-
[image:4.595.207.541.532.706.2]Source: data from incopat database.
tential to become medium [10]. Fengchao Liu et al used social network analysis method and adopted the concluded contract data of the underlying market to study the spatial distribution of cross region technology transfer network struc-ture [11].
(1) Point centrality. The centrality of a node is the index to measure its power in the whole network, and it includes both absolute and relative centrality. In a directed network, absolute centrality can be divided into in-degree centrality (which stands for the number of nodes that are linked into this node) and out-degree centrality (which means the number of relations delivered from this node); relative centrality can be used to compare the point centrality of differ-ent networks, and it can be calculated by dividing a point’s absolute cdiffer-entrality (which equals to the sum of in-degree and out-degree centrality) by the maxi-mum possible point degree of the network [12].
(2) Reciprocity of relationship. There are three modes existing in a directed network, respectively no relationship, one-way relationship and both-way rela-tionship. And in a both-way relationship, the two nodes are considered to have reciprocity. The proportion of reciprocity relationship in a network can reflect its stability, connectivity and equality between the nodes [13].
(3) Cliques of the network. Cliques are cohesive sub-groups founded on the reciprocity relationship, and they are maximal complete sub-graphs which at least contain three nodes. Any two nodes in a clique are directly related to each other, and no nodes which are related to all the nodes within the network can be found. In a directed network, cliques can only be analyzed when it is established among the nodes with reciprocity relationship. To better compare the network and spatial distribution, this report set 1 as the critical value to convert the mul-ti-value network into bi-value network in clique analysis, and symmetrized the matrix according to the reciprocity principle.
Then the technology transfer activeness of the 31 provinces was measured on the basis of clique analysis. The regions were divided into blocks according to their activeness and then GIS spatial analysis method was adopted to combine the attributes of the blocks and geographic space in order to further analyze the spatial distribution and evolution patterns of cross region technology transfer.
4. Empirical Analysis
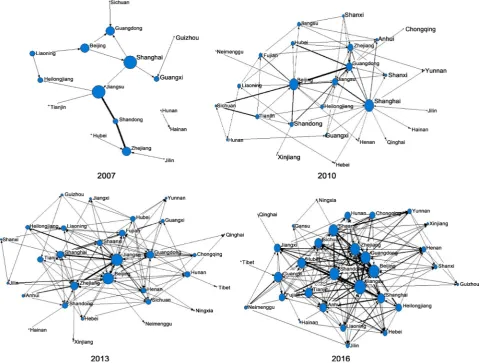
Source: own data base constructed from incopat data.
Figure 2. Universities’ technology transfer network, 2007-2016.
and Taiwan excluded)were involved in the cross-region technology transfer with a drastic growth of central nodes. The developing trend of the transfer network demonstrates that the technology transfer level of our country’s universities kept being improved and technology exchange between different regions became more and more frequent in the recent 10 years.
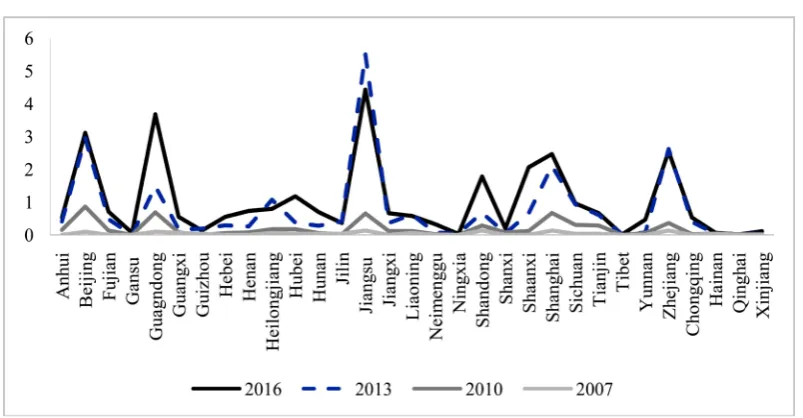
Source: own database constructed from incopat data.
Figure 3. Relatively point centrality of universities’ technology transfer network, 2007-2016.
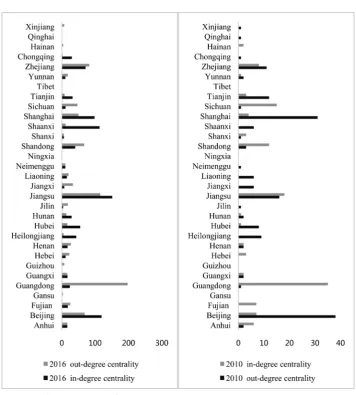
largest technology export sources. And in Fujian, Guangdong, Zhejiang and Shandong, the import of technology was significantly more frequent than export with Guangdong being the dominating transfer destination. When comparing the transfer data of 2010 and 2016 (Figure 4), it is shown that the technology transfer of Beijing, Shanghai and Guangzhou was still mainly one-way, although the difference between the amount of technology import and export was de-creased; while the import and export of Jiangsu and Zhejiang provinces were quite balanced.
Overall, the total amount of universities’ cross-region technology transfer keeps increasing, which indicates that universities lay emphasis on the ogy transfer and they play a more and more important role in regional technol-ogy development and innovation. Beijing and Shanghai, where many universities are located, are still mainly technology export sources, while the provinces on the eastern coast, where economy is highly developed, are mainly receivers for technology transfer. The density of universities in a region influences the devel-opment of its science and technology to a certain extent, and the economic de-velopment level reflects its capability to receive technology transfer. The differ-ence of transfer level between eastern and western area is still significant and the unbalance number between the technology import and export is still existing in many provinces.
Source: own database constructed from incopat data.
Figure 4. In-degree centrality and out-degree centrality of network in 2010 and 2016.
procity relationship in the transfer network of 2007, which means there was no bi-direction technology transfer between different provinces and the stability of the network was very weak. From 2007 to 2016, the connectivity of technology between different regions was largely improved and the proportion of reciproci-ty relationship rose to 36.26%, which also indicated that with the increase of the amount and efficiency of technology transfer, the gap of technology level be-tween provinces was narrowed and the relationship equality was developed as well. These improvements led to a virtuous circle which can effectively promote the technology exchange between different regions.
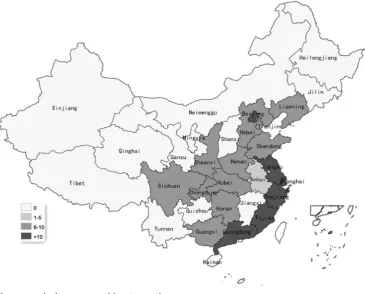
technology transfer of provinces around the country was not very active, and the reciprocity relationship was rare, which made it difficult to be analyzed. There-fore, the clique analysis of 2007 and 2010 were eliminated. The regions were di-vided into four categories by considering the number of cliques (N) involved from 2013 to 2016, respectively core region (N > 10), semi-core region (6 ≤ N ≤ 10), margin region (1 ≤ N ≤ 5), and blank region (N = 0) (Table 1). The spatial distribution diagram of universities’ cross-region technology transfer was drawn by GIS spatial distribution method (Figure 5 and Figure 6), and it showed that the transfer activeness kept decreasing when it came from southeast coast to northwest inland, with the core regions mainly locating in the southeast coast including Jiangsu, Zhejiang, Fujian, Guangzhou and also Beijing; the semi-core regions mainly located in the middle of the inland and around the Bohai Sea; the northwestern provinces were blank regions with very low transfer activeness. The overall transfer activeness in the spatial distribution map was significantly increased in 2016 compared with that of 2013. In term of spatial distribution, the distribution of core region was spreading from southeast coast are to inland, with Tianjin, Shandong, Anhui, Hubei, Shanxi, Sichuan and Guangxi becoming core regions as well. Most of these provinces are adjacent to original core re-gions, which indicate the positive impacts of core regions on the technology transfer level of provinces around. The provinces all have reciprocity relation-ship with at least 5 other provinces excluding Gansu, Guizhou, Ningxia, Xizang, Hainan and Qinghai.
5. Discussion
[image:9.595.208.540.522.722.2]This report studied features and evolution process of universities’ cross-region technology transfer from four aspects, including the overall network structure, the network nodes, the network relations and the spatial distribution of network blocks. Overall, the transfer level was largely increased from 2007 to 2016 with
Table 1. The number of cliques each province involved in 2013 and 2016.
Province Y2013 Y2016 Province Y2013 Y2016 Province Y2013 Y2016
Anhui 1 12 Hunan 4 4 Shanghai 8 14
Beijing 24 30 Jilin 0 1 Sichuan 4 14
Fujian 8 6 Jiangsu 20 31 Tianjin 5 11
Gansu 0 0 Jiangxi 0 6 Tibet 0 0
Guangdong 15 29 Liaoning 3 5 Yunnan 0 2
Guangxi 3 13 Neimenggu 0 1 Zhejiang 10 24
Guizhou 0 0 Ningxia 0 0 Chongqing 3 3
Hebei 1 3 Shandong 5 22 Hainan 0 0
Henan 5 3 Shanxi 0 2 Qinghai 0 0
Heilongjiang 0 8 Shaanxi 5 20 Xinjiang 0 1
Hubei 4 12
Source: own database constructed from incopat data.
Figure 5. The spatial distribution diagram of universities’ cross-region technology transfer, 2013.
Source: own database constructed from incopat data.
[image:10.595.110.489.416.709.2]the fastest growth rate taking place from 2013 to 2016.
In term of technology import and export relationship, regions with rich edu-cation resources often have advantages in technology export, while main desti-nations for technology import located in economic developed area. There exists a common unbalance between the technology export and import level of the same province. The richness of education resource in a region decides the amount of technology that can be transferred, therefore it is a crucial thrust for technology transfer. On the other hand, increased economic development level creates the demand for technology. Currently, the main receivers of universities’ technology transfer are enterprises, which are the main driving force of regional economic development, therefore economic development level is an important tension for technology transfer.
In the evolution of technology transfer network, the dyads of the transfer process generally turn from “strong-weak” into “strong-strong”, which increases the reciprocity level of the network. There exists a positive correlation between the connectivity of the network nodes and the transfer activeness of universities’ technology. As to the spatial distribution of the technology transfer, there is a trend that core regions spread from southeast coast to inland, and the provinces belonging to core regions have significant positive effects on the technology level of the provinces around. Besides, the improvement of technology transfer level of less developed inland provinces such as Qinghai, Xizang and Gansu is very slow. The cross-region technology transfer shows a typical geographic feature. On one hand, different geographic locations lead to the difference of the regions’ economic development level and resources, which further influences the transfer level of the region. On the other hand, the geographic distance between the two sides of the technology transfer can limit the transfer level, therefore the tech-nology exchange tends to take place between adjacent provinces.
6. Contribution and Study Implications
the impact of technology transfer to regional innovation capability could be eas-ily carried out.
7. Conclusions
After analyzing the evolution pattern of universities’ technology transfer net-work and its spatial distribution and considering the current situation in our country, it is recommended that:
1) In term of provinces, the main driving force of technology transfer is the universities’ technology innovation sources and the regional economic develop-ment level is the important pulling force. Therefore, to ensure the technology transfer can be further promoted, it is vital to improve innovation level of uni-versities and break the barrier between the uniuni-versities and the enterprises. And to develop characteristic industries of the regions and to improve regional economy combining the advantages of the region are basic approaches to attract technology import.
2) In term of the whole country, it is essential to eliminate the distance limita-tion of cross-region technology transfer and to solve the informalimita-tion dissymme-try in the transfer process to make sure the transfer can be successfully carried out. There are all kinds of barriers existing in the technology transfer between universities and industries, or between different regions, and other factors such as geographic distance further aggravate the information dissymmetry. There-fore, it is effective to improve the technology transfer efficiency by establishing platforms for cross-region technology transfer and interaction between universi-ties and enterprises, which can eliminate the barriers created due to geographic distance or policies.
Finally, the study also has some limitations. Except patent assignment, tech-nology transfer also including other methods like patent licensing, techtech-nology exchange and so on. Even the patent assignment is the main part of technology transfer in China now, research on other parts also need studied. Based on the evolution of transfer network and spatial distribution, this paper gives the possi-ble reasons which influence the cross-regional technology transfer and the sug-gestion on improving the transfer efficiency, however, we need do more correla-tion analysis to explore degree of influence in the future.
References
[1] Wu, Z.L. and Ding, X. (2005) The Study on Universities’ Technology Transfer Me-thods. Science and Technology Management Research, 25, 116-118.
[2] Chen, A., Patton, D. and Kenney, M. (2016) University Technology Transfer in China: A Literature Review and Taxonomy. The Journal of Technology Transfer, 41, 891-929. https://doi.org/10.1007/s10961-016-9487-2
[3] Lei, T. and Chen, X.D. (2011) Network Map Analysis of University-Firm’s Co-Ap- plication for Patents. Science Research Management, 32, 67-73.
[4] Luo, L.G., Yu, X. and Zhou, L.H. (2013) Knowledge Flow Capability of “985 Uni-versities” Based on Patent License Network. Chinese Journal of Management, 10, 458-462.
Cooperation Network of Patent Applications. Studies in Science of Science, 29, 390- 395.
[6] Meyer, M. (2002) Tracing Knowledge Flows in Innovation Systems. Scientometrics, 54, 193-212. https://doi.org/10.1023/A:1016057727209
[7] Zhang, C.B., Yang, Y., Ding, K. and Liu, Z.Y. (2016) Analysis and Prospect of Patent Technology Transferring Modes of Chinese Universities: Evidences from 985 Project Universities. Science and Technology Process and Policy, 33, 117-121. [8] Sternitzke, C., Bartkowski, A. and Schramm, R. (2008) Visualizing Patent Statistics
by Means of Social Network Analysis Tools. World Patent Information, 30, 115- 131.
[9] Thompson, P. and Fox-Kean, M. (2005) Patent Citations and the Geography of Knowledge Spillovers: A Reassessment. American Economic Review, 95, 450-460. https://doi.org/10.1257/0002828053828509
[10] Si, S.Q. and Feng, F. (2010) Research on Chinese Inter-Regional Technology Trans-fer Alliance-Based on Cooperative Network of 38 Cities. Studies in Science of Sci- ence, 28, 1165-1170.
[11] Liu, F.C. andMa, R.K. (2013) Study on the Network Structure and Spatial Distribu-tion of Inter-Regional Technology Transfer: Analysis Based on Inter-Provincial Technical Market Transaction of China in 2006-2010. Studies in Science of Science, No. 4, 529-536.
[12] Liu, J. (2009) Lectures on Whole Network Approach: A Practical Guide to. Gezhi Press, Shanghai.
[13] Hanneman, R.A. and Riddle, M. (2005) Introduction to Social Network Methods.
Submit or recommend next manuscript to SCIRP and we will provide best service for you:
Accepting pre-submission inquiries through Email, Facebook, LinkedIn, Twitter, etc. A wide selection of journals (inclusive of 9 subjects, more than 200 journals)
Providing 24-hour high-quality service User-friendly online submission system Fair and swift peer-review system
Efficient typesetting and proofreading procedure
Display of the result of downloads and visits, as well as the number of cited articles Maximum dissemination of your research work