Munich Personal RePEc Archive
Credit Unions, Consolidation and Small
Business Lending: Evidence from Canada
Morgan, Horatio M.
Ryerson University
18 October 2013
Online at
https://mpra.ub.uni-muenchen.de/50813/
Credit Unions, Consolidation and Small Business Lending: Evidence from Canada
Horatio M. Morgan, Ph.D.
Assistant Professor, Global Management Studies Department Ted Rogers School of Management
Ryerson University 350 Victoria Street Toronto, Ontario Canada, M5B 2K3
E-mail: horatio.morgan@ryerson.ca Telephone: +1(416) 979-5000 ext. 2526
Credit Unions, Consolidation and Small Business Lending: Evidence from Canada
Abstract
This study examines how consolidation activity in the credit union system may impact small business lending. Drawing on Canadian provincial-level data over the period 1992-2009, it provides systematic evidence which suggests that the size of credit unions has a statistically significant negative effect on the rate of new business formation. While the magnitude of this negative effect was found to be very small when the degree of competition was low, it grew as competition intensified in the credit union system. Meanwhile, the size of the federally chartered banking sector was found to have a statistically significant, but economically insignificant negative effect on the rate of new business formation. This result was not affected by consolidation activity in the credit union system. These findings suggest that it is the intensification of competition that most acutely undermines small business lending, and by extension, new business formation in a concentrated credit union system.
Key words: Competition, Consolidation, Credit unions, New business formation, Relationship lending, Small business lending
Credit Unions, Consolidation and Small Business Lending: Evidence from Canada 1. Introduction
The consolidation of the financial services industry in North America is an important
phenomenon that warrants careful attention (Berger, Demsetz and Strahan, 1999). One of the major
concerns that it raises is whether increasingly large financial intermediaries in concentrated credit
markets will systematically curtail small business lending. Concerns along this line are warranted
because such an outcome may undermine the ability of new and small firms to make significant
contributions toward innovation, job creation and regional development (Aghion, Blundell, Griffith,
Howitt and Prantl, 2009; Baumol, 1990; Fritsch and Mueller, 2004; Schumpeter, 1934). Since the
bulk of prior studies have primarily focused on the question of how mergers among banks impact
small business lending (Berger, Kashyap and Scalise, 1995; Berger, Saunders, Scalise and Udell,
1998; Berger and Udell, 1996; Craig and Hardee, 2007; Francis, Hasan and Wang, 2008; Keeton,
1996; Strahan and Weston, 1998), very little systematic evidence is available on the patterns and
implications of consolidation activity in the community banking segment; yet, structural changes in
this segment may significantly impact small business lending.
In this study, I not only systematically evaluate the major recent structural changes in the
Canadian credit union system, but also attempt to quantify the impact of consolidation activity on
small business lending. By way of preview, it will be shown that while larger credit unions may lack
the incentive to provide relationship loans to new and small firms, it is the intensification of
competition in an increasingly concentrated credit union system that may ultimately force them to
significantly curtail small business lending. It will also be shown that while an expansion in the
the magnitude of this negative impact is very small. Furthermore, this result does not change as
consolidation activity intensifies in the credit union system.
This study contributes to the existing literature primarily along two lines. First, it adds to the
dearth of research on the nature of consolidation activity in the community banking segment by
systematically analyzing and characterizing the ongoing episode in the Canadian context. Second, it
provides new evidence on the mediating effect of competition on the relationship between the size
of credit unions and small business lending. By focusing on the Canadian experience, this study
departs from prior studies that primarily focused on consolidation activity in the United States (US)
(Berger et al., 1995; Berger et al., 1998; Berger and Udell, 1996; Craig and Hardee, 2007; Francis et
al., 2008; Keeton, 1996; Strahan and Weston, 1998). Given the well-documented differences in the
financial histories of the US and Canada, this departure presents a new context in which to evaluate
the impact of consolidation activity on small business lending.
Until recently, for instance, the US essentially had a unit banking system that prohibited
inter-state branching (Bordo, 1995). In contrast, Canada has not only long had unlimited branching,
but its federally chartered banking sector also evolved into a highly concentrated market structure
long before consolidation activity intensified in the US. Furthermore, it is notable that the recent
trend in consolidation activity in the North American financial services industry may have more to
do with the credit union system in Canada relative to the broader banking sector in the US. For this
reason, Canadian credit unions cannot be expected to play a similar role in consolidation activity as
their US counterparts. Specifically, while the latter may bolster small business lending by serving
the small firms that are dropped by the surviving merged banks (Avery and Samolyk, 2004), this is
unlikely to materialize in the Canadian context because it is the credit unions that are primarily
these reasons, the focus on the Canadian credit union system expands the stock of evidence on the
relationship between consolidation activity and small business lending from country-case studies.
The remainder of this article proceeds as follows. In the next section, I evaluate the major
structural changes that are currently unfolding in the Canadian credit union system. I then develop a
theoretical framework and postulate how credit union structural variables may impact the rate of
new business formation. The latter serves as a proxy for small business lending. This is followed by
a description of the data, sample, measures and the statistical methods employed. The results are
then presented. The final section discusses the key findings and the major policy implications.
2. Structural Changes in the Canadian Credit Union System
In this section, I will evaluate the major structural changes that are unfolding in the Canadian
credit union system. Figure 1 shows the values of the assets (in millions of Canadian dollars) held
by Credit Union Central of Canada (CUCC)-affiliated credit unions in nine of the ten Canadian
provinces (excluding Québec) over the period 1992-2009. In absolute terms, it is evident that the
size of the credit union system, as measured by the value of total assets, has been growing over the
period of study.
[Insert Figure 1 about here]
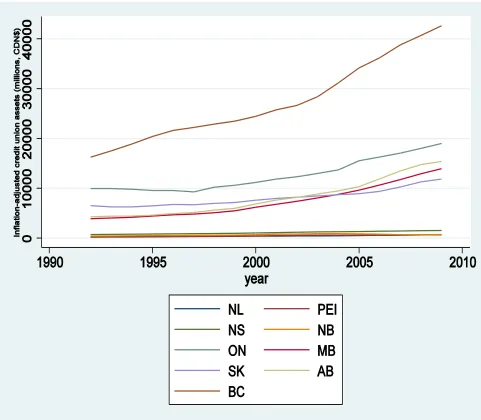
Using the core consumer price index (CPI), as defined by the Bank of Canada, and 2002 as
the base year, I computed the inflation-adjusted asset values of CUCC-affiliated credit unions. This
is shown in Figure 2. What is clear is that the nominal and inflation-adjusted asset values of
CUCC-affiliated credit unions have moved in tandem at least since 1992. This implies that the Canadian
credit union system has grown in both nominal and real terms.
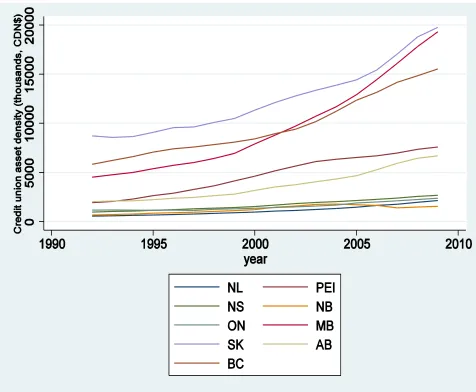
Interestingly, the Canadian credit union system has also been growing in relative terms.
Figure 3 shows credit union asset density, as defined by the value of CUCC-affiliated credit union
assets per 1,000 working-age (15-64) individuals, across provinces from 1992 to 2009. It is evident
that the credit union system has been growing faster than the working-age population in all
provinces, albeit at different rates. In general terms, the asset values of CUCC-affiliated credit
unions per 1,000 working-age individuals ranged from CDN$543,325 (Newfoundland and
Labrador) and $8.7 million (Saskatchewan) in 1992 compared to CDN$1.6 billion (New
Brunswick) and CDN$19.8 billion (Saskatchewan) in 2009.
[Insert Figure 3 about here]
Figure 4 shows a time plot of inflation-adjusted credit union asset density. It can be seen that this
real measure of the relative size of the credit union system conveys the same information as nominal
credit union asset density shown in Figure 4; thus, the relative size of the Canadian credit union
system has increased in both nominal and real terms between 1992 and 2009.
[Insert Figure 4 about here]
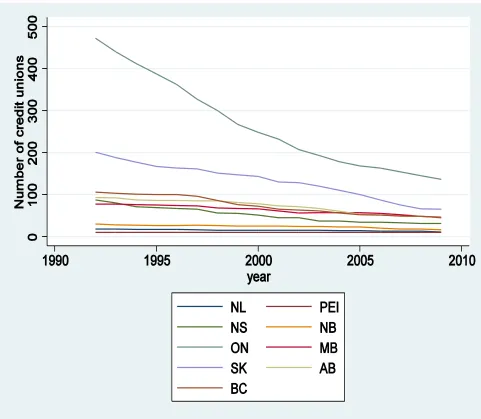
Figure 5 shows the number of CUCC-affiliated credit unions by province over the same
period. In absolute terms, there has been a relatively steady decline in the number of independently
operated credit unions across provinces.
[Insert Figure 5 about here]
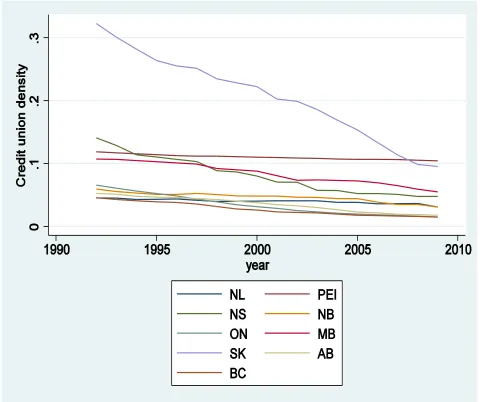
To evaluate the trend in the number of credit unions in relative terms, I considered credit
union density, as defined by the number of (CUCC-affiliated) credit unions per 1,000 working-age
(15-64) individuals. This information is conveyed in Figure 6. It is evident that there has been a
across provinces. In general terms, credit union density ranged from 0.05 (Newfoundland and
Labrador, Alberta and British Columbia) and 0.32 (Saskatchewan) in 1992 compared to 0.01
(British Columbia) and 0.10 (Prince Edward Island and British) in 2009.
[Insert Figure 6 about here]
Although the reported data excludes Desjardins-affiliated caisse populaires in Québec, and
non-CUCC affiliated credit unions/caisse populaires in general, the emerging story is that the
Canadian credit union system is becoming more concentrated. The salient developments in the
credit union system may be summarized by the following two empirical observations: (1) credit
union asset density has been increasing across provinces, and (2) credit union density has been
decreasing across provinces. Taken together, these facts suggest that a smaller number of larger
players may be dominating the Canadian credit union system.
A central question in this study is whether a more concentrated credit union system, as
implied by the two empirical observations above, will hurt small business lending. In the absence of
small-loan data, we may draw reliable inferences about the impact of consolidation activity on small
business lending by evaluating the impact of such activity on entrepreneurship. With an emphasis
on the organizing component of entrepreneurship, new business formation is an appropriate proxy
for entrepreneurship. If the consolidation of the credit union system fosters small business lending,
then one would expect its positive impact to be manifested in a higher rate of new business
formation. The reverse is expected if consolidation activity inhibits small business lending.
Figure 7 shows that the number of newly registered businesses was either relatively constant
or increasing between 1992 and 2009 in absolute terms.
However, a much different picture emerges when new business formation is expressed in
relative terms. Figure 8 shows entry density - as defined by the number of newly registered
‘employer’ businesses (that maintain a payroll for at least one listed employee who may be the
owner) per 1,000 working-age (15-64) individuals - by province over the period 1992-2009. It is
evident that there has generally been a decline in entry density across provinces over this period. For
instance, entry density ranged from 5.89 (Ontario) and 16.24 (Prince Edward Island) in 1992
compared to 5.81 (Nova Scotia) and 10.82 (Prince Edward Island) in 2009.
[Insert Figure 8 about here]
The finding of a downward trend in the rate of new business formation among working-age
individuals and an apparently upward trend in the concentration of the credit union system suggests
that concerns about the adverse impact of the latter on small business lending are not misplaced. At
the same time, this time series evidence is only suggestive. To accurately quantify the impact of
consolidation activity on small business lending, a more rigorous multivariate regression analysis is
required. A theoretical framework is developed to support such an analysis in the next section.
3. Theoretical Framework and Hypothesis Development
As credit unions become larger, they may lose their comparative advantage in small business
lending. This is primarily attributed to the tendency of large financial institutions to not only
centralize lending decisions, but also place greater emphasis on independently verifiable
information that new and small firms generally lack (Berger, Miller, Petersen, Rajan and Stein,
2005; Petersen and Rajan, 1994). Furthermore, relatively large credits that are finding it increasingly
costly to provide relationship-based loans may reduce the share of such loans in their portfolios if
extend credit to new and small firms on favorable terms if competition makes it easy for the latter to
break away from the relationships they have forged with credit unions (Petersen and Rajan, 1995).
Insofar as the growth in credit union asset density reflects the growth and increasing
dominance of above-average size credit unions, one would expect the following outcomes as
summarized in these two hypotheses:
Hypothesis 1a: The rate of new business formation is negatively related to credit union asset
density, all else equal; and
Hypothesis 1b: The magnitude of the anticipated negative relationship between the rate of
new business formation and the credit union asset density increases as competition increases,
all else equal.
Alternatively, when viewed in isolation, greater competition in the credit union system may
positively impact new business formation (Rogers, 2012). This leads to the following hypothesis:
Hypothesis 2a: The rate of new business formation is positively related to the degree of
competition in the credit union system, all else equal.
However, for the same arguments articulated above, hypothesis 2a may be extended in line with
hypothesis 1b as follows:
Hypothesis 2b: The magnitude of the anticipated positive relationship between the rate of
new business formation and the degree of competition in credit union system will decrease
as credit union asset density increases, all else equal.
To the extent that the federally chartered banking sector is highly concentrated, one can
lending for the same reason noted (Berger et al., 2005; Petersen and Rajan, 1994); that is, large
banks may allocate a share of their loan portfolio to small business loans because they lack a
comparative advantage in small business lending. This is applicable in the Canadian context when
few federally chartered banks - Royal Bank of Canada, Toronto-Dominion Bank, Bank of Nova
Scotia, Bank of Montreal, Canadian Imperial Bank of Commerce and the National Bank of Canada -
have long dominated the banking sector. When the credit union system becomes more concentrated
in this generally concentrated banking sector, the adverse effect of consolidation activity on small
business lending may be worse than they otherwise might have been. This leads to the following
final two hypotheses:
Hypothesis 3a: The rate of new business formation is negatively related to the relative size
of the federally chartered banking sector, all else equal.
Hypothesis 3b: The magnitude of the anticipated negative relationship between the rate of
new business formation and the relative size of the federally chartered banking sector will
increase as credit union asset density increases, all else equal.
4. Research Method
4.1.Data and Sample
To empirically evaluate the hypotheses developed in the previous section, this study draws
on provincial-level data on credit union structural variables from Credit Union Central of Canada. In
addition, it draws on provincial-level data on new business registrations from Statistics Canada’s
Longitudinal Employment Analysis Program (LEAP) file. A number of publicly available Statistics
Canada tables were also used a data source for this study. A balanced panel dataset was prepared on
the variables described below for nine of the ten Canadian provinces over the period 1992-2009.
Based on the descriptive statistics reported in Table 1 (i.e. column 2, mean), the average
province has a relatively high standard of living with a real per capita gross domestic product (GDP)
(in 2002 Canadian dollars) of CDN$33,246. In addition, it generates almost 10 newly registered
businesses per 1,000 working-age individuals each year. In the average province, 50 percent of the
population is just below 37 years old, and the male-female ratio is almost 1:1. In addition, the
average province receives approximately 9 percent of newly landed immigrants. At CDN$16,887 in
federally chartered inflation-adjusted bank loans and CDN$ 5,098 in inflation-adjusted
(CUCC-affiliated) credit union assets per 1,000 working-age individuals, the federally chartered banking
sector is significantly larger than the credit union system in the average province. There are
approximately 0.07 CUCC-affiliated credit unions for every 1,000 working-age individuals in the
average province.
[Insert Table 1 about here]
4.2.Measures
4.2.1. Dependent variable
The dependent variable in entry density. This variable was defined above as the number of
newly registered employer businesses per 1,000 working-age individuals. Entry density serves a
proxy for small business lending as discussed above. An increase (decrease) in entry density
implies an increase (decrease) in the supply of credit to new and small firms.
4.2.2. Credit union structural variables
Credit union asset density is used to capture both the relative size of the credit union system
and the growth and dominance of above-average size credit unions that are expanding much faster
competition in the credit union system. An increase (decrease) in credit union density is associated
with an increase (decrease) in the degree of competition in the credit union system, all else equal.
4.2.3. Control variables
To mitigate a variety of conflating influences on the relationship between the rate of new
business formation (entry density) and credit union structural variables (credit union asset density
and credit union density), a number of control variables are included in the multivariate regression
models described below. Specifically, I controlled for the following demographic characteristics of
the provinces in the sample: age, education level, gender and immigration.
To the extent that age is negatively correlated with risk-taking propensity, or positively
correlated with human capital (i.e. business experience or organizational skill), provinces with a
relatively high share of individuals who are above the median age may have a relatively low, or high
propensity for entrepreneurship, respectively, up to a certain age (Blanchflower, Oswald and
Stutzer, 2001; Lévesque and Minniti, 2006; Lévesque, Shepherd and Douglas, 2002; Madsen,
Neergaard and Ulhoi, 2003). Therefore, the use of provincial median age as a control variable is
justified. In addition, I controlled for cross-province differences and temporal changes in human
capital by using the share of the adult population (age, 25-44) with a Batchelor’s degree as a control
variable. This is appropriate based on studies that find a positive relationship between formal
education and entrepreneurship (Bates, 1990; Colombo and Grilli, 2005; Henley, 2005).
The share of the provincial population that is female is used to control for the influence of
gender on the relationship between the rate of new business formation and credit union structural
variables. This is justified because prior studies have found gender-based differences in the
propensity for entrepreneurship, startup capital, access to finance, among others (Birley, 1989,
Meanwhile, the share of newly landed immigrants is used to control for the conflating influence of
immigration on entrepreneurship. This is appropriate because some prior studies have found
relatively high rates of self-employment among immigrants (Borjas, 1986; Lofstrom, 2002), while
others have not found any systematic differences in the rates of self-employment between
immigrants and natives (Brock and Evans, 1986; Levie and Smallbone, 2007).
Bank loan density (i.e. federally chartered bank loans per 1,000 working-age individuals) is
used as a proxy for the relative size of the federally chartered banking sector. As a control variable,
it allows us to isolate the potentially negative impact that Canada’s concentrated, federally chartered
banking sector may have on the rate of new business formation through the credit-supply channel.
4.2.4. Statistical Methods
In Table 1, the dependent variable, credit union structural variables and the control variables
are generally described in terms of their mean values, standard deviations and pair-wise
correlations. The fixed-effects estimator is used to estimate the impact of credit union structural
variables on entry density. At this point, the use of the fixed-effects estimator is justified on the
grounds that it allows us to control for differences in the unobserved time-invariant characteristics
across provinces. However, the appropriateness of the fixed-effects estimator as opposed to the
random-effects estimator is formally justified later based on the Hausman test. For each province
indexed i, the linear panel regression model to be estimated is as follows:
According to hypotheses 1a, 1b, 2b, 3a and 3b, a negative relationship is expected between the
following pairs of variables: {entry density, credit union asset density}, {entry density, credit union
asset density*credit union density}, {entry density, credit union density*credit union asset density},
{entry density, bank loan density} and {entry density, bank loan density*credit union asset density},
respectively. Since hypotheses 1b and 2b are empirically equivalent, hypotheses 1a, 1b/2b, 3a and
3b correspond to , , and . These hypotheses imply that and are all
statistically significant. Meanwhile, hypothesis 2a suggests that entry density and credit union
density are positively related; thus, and statistically significant. The vector of controls
constitutes the provincial demographic and economic variables discussed above as well as province
fixed effects and time fixed effects. The latter are used to control for macroeconomic shocks.
A number of steps were taken to address the potential violation of the standard assumptions
that underpin the classical linear regression model. For instance, the correlation matrix in Table 1
suggests that we ought to be concerned about the issue of multicollinearity. To improve the
precision with which coefficient estimates were generated for the credit union structural variables,
several regression models were estimated. Starting with a baseline regression model, credit union
structural variables were added in turn until the model specified in equation 1 was attained.
Another concern is heteroskedasiticity. Specifically, heteroskedastic errors may engender
estimates of the standard errors that are either systematically under- or over-stated. To mitigate the
bias associated with unadjusted standard errors, robust standard errors were computed for all
coefficient estimates in the specified fixed-effects models. Finally, since all variables are measured
contemporaneously, concerns about biases in the coefficient estimates due to endogeneity or reverse
lagged one period, and the following linear panel regression model was estimated using the same
approach described above:
(2)
Importantly, equation 2 makes it possible to draw stronger inferences about the direct of causality
between entry density and credit union structural variables than equation 1; alternatively, it is now
possible to move beyond a mere statement about the extent to which these variables are correlated.
That is, one may infer whether the direction of causality runs from credit union structural variables
to entry density, or the other way around. Still, it is appropriate to interpret the results with caution
as credit union structural variables and entry density may be related over longer lagged periods than
suggested in equation 2.
5. Results
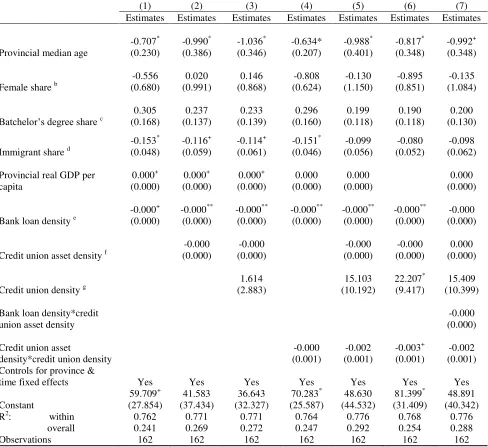
The fixed-effects coefficient estimates for equation 1 are reported in Table 2. Among the
control variables, a systematic negative relationship seems to exist between entry density and the
provincial median age variable. The coefficient estimate ranges from -0.634 to -1.036 and are
significant at either the 5 or 10 percent level of significance. Neither immigrant share nor female
share seems to systematically impact entry density. This also applies to provincial real GDP per
capita.
According to hypotheses 1a, 1b/2b, 3a and 3b, the estimates of and ,
coefficients were found to be negative as predicted, only the estimate of was found to be
significant in both statistical and economic terms in model 6. Specifically, the estimated value is
-0.003, which is significant at the 10 percent level of significance. Meanwhile, hypothesis 2a implies
that the estimates of should be positive and statistically significant. While all the reported
estimates in Table 2 have the predicted sign, only the estimate of 22.207 from model 6 was found to
be statistically significant at the 5 percent level of significance.
Although these results seem to strongly support hypotheses 1b/2b and 2a, and are generally
consistent with hypotheses 1a, 3a and 3b, they warrant further examination. The fixed-effects
models that generate these results can explain between 76.2 and 77.6 percent of the within variation
in entry density, and between 24.1 and 29.2 percent of the overall variation in entry density.
However, the fixed-effects estimator may suffer from an endogeneity bias. In addition, since the
strongest support for the hypotheses come from model 6, it remains to be shown why it may be
more suitable than the other estimated models. These two issues are addressed in the next section.
[Insert Table 2 about here]
5.1. Additional Robust Checks
To address the issue of endogeneity, credit union structural variables were lagged one period
and the panel regression model was re-estimated in accordance with equation 2. The fixed-effects
estimates are reported in Table 3. Among the control variables, the estimates of the marginal effects
of provincial median age and Batchelor’s degree share on entry density are uniformly negative and
positive, respectively. The estimates for provincial median age range from -0.580 to -1.201, and are
significant at either the 1 or 5 percent level of significance; while the estimates for Batchelor’s
However, no consistent statistically significant marginal effects were found for female share,
immigrant share and provincial real GDP per capita.
As previously stated, the estimates of and are expected to be negative and
statistically significant according to hypotheses 1a, 1b/2b, 3a and 3b, respectively; while the
estimates of are expected to be positive and statistically significant according to hypothesis 2a.
All the estimated coefficients had the predicted signs. However, only the estimated coefficients for
and were found to be statistically and economically significant among the more completely
specified fixed-effects models. Table 3 shows that the statistically significant estimates of are
28.093 in model 6 and 26.243 in model 7. Meanwhile, a single statistically significant estimate of
-0.004 in model 6 is reported for . Given the importance of these results for the empirical
validation of hypotheses 1a and 1b/2b, a closer look at models 6 and 7 is warranted.
The Hausman test provides the strongest support for the use of the fixed-effects estimator
over the random-effects estimator in models 6 and 7 relative to the other model specifications.
Specifically, the chi-squared distributed Hausman test statistic was 41.06 and 145 for models 6 and
7, respectively. A p-value of 0.000 was found in both cases. Meanwhile, model 6 can explain 77.8
and 15.0 percent of the within variation and overall variation, respectively, in entry density; while
model 7 can explain 78.6 and 15.8 percent of the within variation and overall variation, respectively,
in entry density. The next competing model in terms of explanatory power is model 5, which can
explain 78.4 and 21.2 percent of the within variation and overall variation, respectively, in entry
density. However, taking into account the apparent impact of multicollinearity on the precision with
which the coefficients were estimated, model 6 appears to yield the most reliable estimates.
While the inclusion of provincial real GDP per capita does not seem to provide independent
regressors introduces bias. This is evident from models 5, 6 and 7. In particular, the inclusion of
provincial real GDP per capita in models 5 and 7 seems to contribute to the underestimation of the
marginal effect of credit union density on entry density. Therefore, by dropping provincial real GDP
per capita in model 6, the fixed-effects estimator yields less biased estimates; hence, it is deemed to
be the most reliable model specification. In the next section, I interpret the results that follow from
model 6 and its policy implications.
[Insert Table 3 about here]
6. Discussion and Conclusion
This study has addressed the question of whether the expanding and increasingly
concentrated credit union system in Canada can be expected to foster small business lending, as
captured by the rate of new business formation. It contributes to the existing literature on the
relationship between the financial market structure and small business lending by not only
confirming some of the findings in prior studies, but especially in terms of the new systematic
evidence that it provides on the relationships between the rate of new business formation and credit
union structural variables.
Consistent with prior studies that point to a potentially negative correlation between age and
risk-taking propensity (Blanchflower et al., 2001), a robust negative relationship was found between
age and the rate of new business formation among working-age individuals. On the contrary, a
robust positive relationship was found between the attainment of formal education at the university
level and the rate of new business formation. This is consistent with prior studies that emphasize the
importance of formal education for entrepreneurship (Bates, 1990; Colombo and Grilli, 2005;
Meanwhile, the data suggests that the average Canadian credit union is becoming larger.
There are two key findings which shed light on the implications of this phenomenon for small
business lending. The first key finding is that an increase in the size of credit unions, as captured by
expansion of the credit union system in relative terms, seems to have a negative effect on the rate of
new business formation. Although the negative effect was found to be negligible in magnitude, it
suggests that the emergence of larger merged credit unions has the potential to inhibit small
business lending. This is consistent with the view that large and potentially remote financial
intermediaries may lack a comparative advantage in small business lending.
The second related finding is that the negative impact of an increase in the size of credit
unions on the rate of new business formation will increase as competition intensifies. Interestingly,
competition seems to considerably increase the magnitude of the otherwise very small negative
effect that credit union size may have on small business lending. Alternatively, when competition is
viewed in isolation, the finding that competition has a positive marginal impact on the rate of new
business formation suggests that it yields market conditions that apparently help new and small
firms to gain better access to credit. However, the evidence suggests that the marginal benefits of
competition will decline as the size of credit unions increase in a more concentrated system.
Altogether, these findings suggest that large credit unions that are already finding it unprofitable to
provide relationship-based loans may ultimately discontinue relationship lending if competition
makes it too difficult to retain members.
6.1. Policy Implications
Behind the major findings in this study are underlying challenges that offer new directions
for future research on community banking and small business lending. On the one hand, the ongoing
that are losing market share to larger financial intermediaries. On the other hand, the larger credit
unions that emerge from these M&As may no longer find it profitable to engage in relationship
lending in general, and particularly as competition intensifies. This suggests that public policies that
attempt to either preserve the credit union system, or foster greater competition in the banking sector
may have unintended consequences for small business lending. The following two practical
examples illustrate this.
First, while the relaxation of restrictions on cross-province M&As may enable credit unions
to considerably improve their risk-bearing capacity; they may lose their comparative advantage in
relationship lending if they become too large and/or begin to operate at a greater distance from the
local communities that they have historically served. Finally, the ongoing discourse on the need to
create a level playing field for federally chartered banks and credit unions is partly informed by
standard competition-efficiency arguments. The elimination of the exclusive tax benefits that credit
unions have traditionally enjoyed is one way to create such a level playing field. However, as the
evidence in this study suggests, the competition that this may fuel in a concentrated credit union
system may actually hurt small business lending. Considering the unintended consequences of
regulatory or legislative changes along these lines, more research is needed to inform the
formulation of public policies that will directly impact the credit union system.
Acknowledgements
I would like to thank Sandra Brizland of Credit Union Central of Canada for providing the
data on the credit union system; and John Baldwin, Danny Leung and Anne-Marie Rollin of the
Economic Analysis Division of Statistics Canada for the different roles they played in making the
new employer data from the LEAP file available for this research project. I would also like to thank
References
Aghion, P., Blundell, R., Griffith, R., Howitt, P., Prantl, S., 2009. The effects of entry on incumbent innovation and productivity. Review of Economics and Statistics 91(1), 20-32.
Avery, R.B., Samolyk, K.A., 2004. Bank Consolidation and Small Business Lending: The Role of Community Banks. Journal of Financial Services 25(2/3), 291-325.
Bates, T., 1990. Entrepreneur human capital inputs and small business longevity. Review of Economics and Statistics 72(4), 551-559.
Baumol, W.J., 1990. Entrepreneurship: Productive, Unproductive and Destructive. Journal of Political Economy 98, 893–921.
Berger, A.N., Demsetz, R.S., Strahan, P.E., 1999. The consolidation of the financial services industry: Causes, consequences, and implications for the future. Journal of Banking & Finance 23, 153-194.
Berger, A., Kashyap, A., Scalise, J., 1995. The transformation of the U.S. banking industry: what a long, strange trip it’s been. Brookings Papers on Economic Activity 2, 55-218.
Berger, A.N., Miller, N.A., Petersen, M.A., Rajan, R.G., Stein, J.C., 2005. Does function follow organizational form? Evidence from the lending practices of large and small banks. Journal of Finance 76(2), 237-269.
Berger, A.N., Saunders, A., Scalise, J.M., Udell, G.F., 1998. The effects of bank mergers and acquisitions on small business lending. Journal of Financial Economics 50, 187-229.
Birley, S., 1989. Female entrepreneurs: are they really different? Journal of Small Business Management 27, 32-37.
Birley, S., 2006. Women entrepreneurs: a research overview. In: Casson, M., Yeung, B., Basu, A., Wadeson, N. (Eds), The Oxford Handbook of Entrepreneurship, Oxford University Press, Oxford, pp. 611-628.
Blanchflower, D.G., Oswald, A., Stutzer, A., 2001. Latent Entrepreneurship across Nations. European Economic Review 45, 680-691.
Blanchard, L., Zhao, B., Yinger, J., 2008. Do lenders discriminate against minority and women entrepreneurs? Journal of Urban Economics 63, 467-497.
Bordo, M., 1995. Regulation and Bank Stability: Canada and the United States, 1870-1980. World Bank Policy Research Working Paper 1532. World Bank, Washington, DC.
Borjas, G.J., 1986. The self-employment experience of immigrants. Journal of Human Resources 21, 485-506.
Brock, W.A., Evans, D.S., 1986. The Economics of Small Businesses: Their Role and Regulation in the US Economy. Holmes and Meier, New York.
Brush, C.G., 1992. Research on women business owners: pasttrends, a new perspective and future directions. Entrepreneurship Theory and Practice 4, 5-30.
Colombo, M., Grilli, L., 2005. Founders’ human capital and the growth of new technology-based firms: A competence-based view. Research Policy 34(6), 795-816.
Francis, B., Hasan, I., Wang, H., 2008. Bank consolidation and new business formation. Journal of Banking & Finance 32(8), 1598-1612.
Fritsch, M., Mueller, P., 2004. Effects of New Business Formation on Regional Development over Time. Regional Studies 38(8), 961-975.
Henley, A., 2005. Job creation by the self-employed: The roles of entrepreneurial and financial capital. Small Business Economics 25(2), 175-196.
Keeton, W., 1996. Do bank mergers reduce lending to businesses and farmers? New evidence from Tenth District States. Federal Reserve Bank of Kansas City Economic Review, 81 (3), 63-75.
Kim, G.O., 2006. Do equally owned small businesses have equal access to credit? Small Business Economics 27, 369-386.
Lee, M.A., Rendall, M.S., 2001. Self-employment disadvantage in the working lives of blacks and females. Population Research and Policy Review 20, 291-320.
Lévesque, M., Minniti, M., 2006. The effect of aging on entrepreneurial behaviour. Journal of Business Venturing 17, 189-210.
Lévesque, M., Shepherd, D.A.,Douglas, E.J., 2002. Employment or self-employment: a dynamic utility-maximizing model. Journal of Business Venturing 17, 189-210.
Levie, J., Smallbone, D., 2007. Immigration, ethnicity and entrepreneurial behaviour. In: Minniti, (Ed), Entrepreneurship: The Engine of Growth, Volume 1, Praeger, Westport CT, pp. 157-180.
Loftstrom, M., 2002. Labour market assimilation and the self-employment decision of immigrant entrepreneurs. Journal of Population Economics 15, 83-114.
Madsen, H., Neergaard, H., Ulhoi, J.P., 2003. Knowledge-intensive entrepreneurship and human capital. Journal of Small Business and Enterprise Development 10(4), 426-434.
Petersen, M. A., Rajan, R.G., 1994. The Benefits of Lending Relationships: Evidence from Small Business Data. Journal of Finance 49(1), 3-37.
Petersen, M. A., Rajan, R. G. 1995. The effect of credit market competition on lending relationships. Quarterly Journal of Economics 110, 407–443.
Rogers, T.M., 2012. Bank Market Structure and Entrepreneurship. Small Business Economics, 39, 909-920.
Schumpeter, J.A., 1934. The Theory of Economic Development. Harvard University Press, Cambridge.
Table 1. Means, standard deviations and correlations, 1992-2009.
Mean SD 1. 2. 3. 4. 5. 6.
1. Entry density a 9.639 2.787 -
2. Provincial median age 36.793 2.681 -0.352*** -
3. Female share b 49.774 0. 545 -0.108 0.662*** - 4. Batchelor’s degree
share c 13.768 3.145 -0.449*** 0.529*** 0.011 -
5. Immigrant share d 9.308 16.476 -0.410*** -0.053 0.026 0.455*** -
6. Bank loan density e 16,887 6,975 -0.149+ -0.228** -0.195* 0.360*** 0.772*** -
7. Provincial real GDP
per capita 33,246 11,790 -0.206** 0.374*** -0.282*** 0.728*** 0.183* 0.191*
8. Credit union asset
density f 5,088 4,487 -0.051 0.073 -0.283*** 0.234** -0.147+ -0.211**
9. Credit union density g 0.074 0.060 0.201* -0.282*** -0.078 -0.422*** -0.346*** -0.436*** 7. 8. 9. 7. Provincial real GDP
per capita -
8. Credit union asset
density f 0.273*** -
9. Credit union density g -0.321*** 0.393*** -
+
p<.10; *p<.05; **p<.01; ***p< .001; number of province-year observations, n = 162.
a
number of newly registered employer businesses per 1,000 working-age (15-64) individuals in a given province.
b
percentage of provincial population that is female.
c
percentage of the provincial population (age, 25 to 44) with a Batchelor’s degree.
dprovince’s share in total
newly landed immigrants.
e
federally chartered inflation-adjusted bank loans per 1,000 working-age (15-64) individuals.
f
inflation-adjusted credit union assets (thousands, CDN$) per 1,000 working-age (15-64) individuals.
g
Table 2. Effects of credit union asset density and credit union density on entry density, 1992-2009.
This table reports the fixed-effects estimates of the impact of the marginal and joint effects of credit union asset density on entry density a. Starting with a baseline regression model that includes a standard set of control variables, credit union structural variables are subsequently added to yield more completely specified regression models. All variables are contemporaneously measured. Robust standard errors for the estimated coefficients are reported in parentheses.
(1) (2) (3) (4) (5) (6) (7)
Estimates Estimates Estimates Estimates Estimates Estimates Estimates
Provincial median age
-0.707* (0.230) -0.990* (0.386) -1.036* (0.346) -0.634* (0.207) -0.988* (0.401) -0.817* (0.348) -0.992+ (0.348)
Female share b
-0.556 (0.680) 0.020 (0.991) 0.146 (0.868) -0.808 (0.624) -0.130 (1.150) -0.895 (0.851) -0.135 (1.084)
Batchelor’s degree share c
0.305 (0.168) 0.237 (0.137) 0.233 (0.139) 0.296 (0.160) 0.199 (0.118) 0.190 (0.118) 0.200 (0.130)
Immigrant share d
-0.153* (0.048) -0.116+ (0.059) -0.114+ (0.061) -0.151* (0.046) -0.099 (0.056) -0.080 (0.052) -0.098 (0.062)
Provincial real GDP per capita 0.000+ (0.000) 0.000+ (0.000) 0.000+ (0.000) 0.000 (0.000) 0.000 (0.000) 0.000 (0.000)
Bank loan density e
-0.000+ (0.000) -0.000** (0.000) -0.000** (0.000) -0.000** (0.000) -0.000** (0.000) -0.000** (0.000) -0.000 (0.000)
Credit union asset density f
-0.000 (0.000) -0.000 (0.000) -0.000 (0.000) -0.000 (0.000) 0.000 (0.000)
Credit union density g
1.614 (2.883) 15.103 (10.192) 22.207* (9.417) 15.409 (10.399)
Bank loan density*credit union asset density
-0.000 (0.000)
Credit union asset
density*credit union density
-0.000 (0.001) -0.002 (0.001) -0.003+ (0.001) -0.002 (0.001) Controls for province &
time fixed effects Yes Yes Yes Yes Yes Yes Yes
Constant 59.709+ (27.854) 41.583 (37.434) 36.643 (32.327) 70.283* (25.587) 48.630 (44.532) 81.399* (31.409) 48.891 (40.342)
R2: within 0.762 0.771 0.771 0.764 0.776 0.768 0.776
overall 0.241 0.269 0.272 0.247 0.292 0.254 0.288
Observations 162 162 162 162 162 162 162
+p<.10
; *p<.05; **p<.01; ***p< .001. a
number of newly registered employer businesses per 1,000 working-age (15-64) individuals in a given province.
b
percentage of provincial population that is female.
cpercentage of the provincial population (age, 25 to 44) with a Batchelor’s degree.
dprovince’s share in total newly landed immigrants.
e
federally chartered inflation-adjusted bank loans per 1,000 working-age (15-64) individuals. f
inflation-adjusted credit union assets (thousands, CDN$) per 1,000 working-age (15-64) individuals. g
Table 3. Effects of credit union asset density and credit union density on entry density, 1992-2009.
This table reports the fixed-effects estimates of the impact of the marginal and joint effects of credit union asset density and credit union density on entry density a. Starting with a baseline regression model that includes a standard set of control variables, credit union structural variables are subsequently added to yield more completely specified regression models. Credit union asset density and credit union density are lagged one period relative to the contemporaneously measured dependent and the control variables. Robust standard errors for the estimated coefficients are reported in parentheses.
(1) (2) (3) (4) (5) (6) (7)
Estimates Estimates Estimates Estimates Estimates Estimates Estimates
Provincial median age
-0.740* (0.219) -1.142* (0.424) -1.201** (0.356) -0.580** (0.171) -1.129* (0.405) -0.995* (0.378) -1.164* (0.478)
Female share b
-0.290 (0.624) 0.524 (0.997) 0.690 (0.788) -0.840 (0.473) -0.319 (1.049) -0.272 (0.826) -0.282 (1.035)
Batchelor’s degree share c 0.346
+ (0.180) 0.260+ (0.129) 0.257+ (0.130) 0.331+ (0.163) 0.220+ (0.083) 0.217+ (0.104) 0.233+ (0.114)
Immigrant share d
-0.091+ (0.048) -0.106 (0.058) -0.086 (0.048) -0.144 (0.042) -0.061 (0.041) -0.044 (0.041) -0.054 (0.049)
Provincial real GDP per capita 0.000+ (0.000) 0.000+ (0.000) 0.000* (0.000) 0.000 (0.000) 0.000 (0.000) 0.000 (0.000)
Bank loan density e -0.000*
(0.000) -0.000+ (0.000) -0.000* (0.000) -0.000* (0.000) -0.000+ (0.000) -0.000* (0.000) -0.000 (0.000)
Credit union asset density f
-0.000 (0.000) -0.000 (0.000) -0.000 (0.000) -0.000 (0.000) -0.000 (0.000)
Credit union density g
1.862 (3.418) 22.316 (12.247) 28.093* (11.582) 26.243+ (13.239)
Bank loan density*credit union asset density
-0.000 (0.000)
Credit union asset
density*credit union density
-0.001 (0.001) -0.003 (0.002) -0.004+ (0.002) -0.003 (0.002) Controls for province &
time fixed effects Yes Yes Yes Yes Yes Yes Yes
Constant 46.838 (25.453) 21.559 (36.468) 15.123 (28.273) 69.777** (19.215) 30.725 (39.324) 55.976+ (29.101) 32.824 (37.785)
R2: within 0.755 0.772 0.772 0.761 0.784 0.778 0.786
overall 0.238 0.243 0.244 0.244 0.212 0.150 0.158
Observations 153 153 153 153 153 153 153
+p<.10
; *p<.05; **p<.01; ***p< .001. a
number of newly registered employer businesses per 1,000 working-age (15-64) individuals in a given province. b
percentage of provincial population that is female.
cpercentage of the provincial population (age, 25 to 44) with a Batchelor’s degree.
dprovince’s share in
total newly landed immigrants. e
federally chartered inflation-adjusted bank loans per 1,000 working-age (15-64) individuals in a given province. f