Estimating the impact of antenatal care visits on
institutional delivery in India: A propensity score
matching analysis
Priyanka Dixit1*, Laxmi Kant Dwivedi2, Faujdar Ram1
1International Institute for Population Sciences, Mumbai, India; *Corresponding Author: dixit15bhu@gmail.com 2Department of Mathematical Demography & Statistics, International Institute for Population Sciences, Mumbai, India
Received 7 February 2013; revised 25 March 2013; accepted 6 April 2013
Copyright © 2013 Priyanka Dixit et al. This is an open access article distributed under the Creative Commons Attribution License, which permits unrestricted use, distribution, and reproduction in any medium, provided the original work is properly cited.
ABSTRACT
Literature asserts that prenatal care is an im- perative factor for subsequent health care utili- zation. However, in the Indian settings presence of selection bias while determining the impact of ANC visits on institutional delivery has been overlooked by the researchers. Therefore this paper aims to examine the net impact of ANC visits on subsequent utilization of institutional delivery after removing the presence of selec- tion bias using recent round of National Family Health survey data. The analysis has been car- ried out in two separate models, in the first model 1 - 2 ANC visits been compared with no visit and in the second model three or more an- tenatal care visits with no visit. The propensity score matching analysis used in this study sheds new light into this line of research which provides an effective strategy for controlling the confounding influence of institutional delivery. Employing the propensity score matching esti- mation approach we found women who made 1 - 2 ANC visits had 6.6 percent higher chance to deliver in an institution compared to women who made no visit. In addition, if a woman visited health centre three or more than three times, her chances were 31 percent higher to deliver in an institution. Result based on sensitivity analysis suggests that selection bias on unobserved covariates would have to be around 40 percent to alter the impact of 1 - 2 ANC visits. Findings suggest that interventions which plan to in- crease institutional delivery should target pregnant women who come for ANC checkups at institution first time, and health workers
should encourage women to return to the health centre for more numbers of visits, as our results indicate that three or more ANC visits signifi- cantly change the women’s attitudes towards institutional delivery.
Keywords:
Antenatal Care; Institutional Delivery;
Selection Bias, Matching Analysis; India1. INTRODUCTION
Despite an increase in budget collocation for health during the past decade, India is unlikely to reach the health related 2015 Millennium Development Goals (MDG) (MDG 2010). The pace of decline is considera- bly slower than what would be required to meet India’s MDG target of reducing the maternal mortality ratio (MMR) 109 per 100,000 live births and the infant mor- tality rate (IMR) to 27 per 1000 live births.
As a result of the continuing efforts made by the Gov-ernment of India through various programs and also en-deavors of other national, international and voluntary organizations, considerable progress has been made in attaining the MDG goals. The Government is still at-tempting to search for the best possible strategies so that improvement in maternal health could be accelerated further. One way could be to improve maternal and neo-natal health by promoting institutional delivery [1,2]. Studies have documented an inverse relationship be-tween the use of maternal health care and maternal and neonatal mortality [3-5]. The indicators of health care (institutional delivery) and health outcomes (maternal mortality ratio and infant mortality rate) substantiate a similar association in the case of India as well (Figures 1(a) and (b).
(a)
[image:2.595.56.290.83.339.2](b)
Figure 1. (a) Association between percent institutional delivery (DLHS-III) and maternal mortality ratio across 15 major states, India (Office of the Registrar General, 2009). A. X axis = insti-tutional delivery (%). Y axis = maternal mortality ratio (MMR) per 100000 live births; (b) Association between percent institu-tional delivery (DLHS-III) and neonatal mortality rate across 15 major states, India (Office of Registrar General and Census Commissioner, India, 2011). A. X axis = institutional delivery (%). Y axis = neonatal mortality rate per 1000.
and child death in India, it is necessary to develop an understanding of the influencing factors associated with the utilization of process indicators like institutional de-livery. Though there have been some improvements in the maternal and child health indicators, the pace of rise of the institutional delivery in India has been slower than for the rest of other maternal and child health indicators [6]. The National Family Health Survey-III found that the coverage of institutional delivery is low at the na-tional level and two out of five of all births took place at home [6].
The issue of socioeconomic and demographic factors and determinants of institutional delivery in a developing country like India has evoked considerable interest among researchers [6-8]. A few have tried to show that antenatal care (ANC) is an important independent factor in determining the choice of delivery place [9-14]. The extant literature review of studies has concluded that the use of antenatal care services during pregnancy serves dual functions.
First, antenatal care provides a preventive service that monitors signs of pregnancy complications, detects and treats preexisting and concurrent problems which helps pregnant women in lowering down their risk. Secondly,
the ANC visits during pregnancy could be considered the entry point for women into the health care systems. Women who make ANC visits are exposed to the health facilities and there is an opportunity to encourage them to seek subsequent health care for themselves and their newborns.
According to studies, subsequent utilization of health care facilities might be increased because of learning by-doing, that is,subsequent participation in the systems may be greatly influenced by the earlier experience [15]. Further, several visits to the health centre may develop a familiarity with health care systems, increasing the like- lihood that mothers will later rely on these systems for the benefit of their children. Moreover, it may be that women who participate in antenatal care programs re- ceive counseling regarding the significance of subse- quent health care utilization, such as delivery care and child immunization. It is envisaged that ANC visits would allow a woman to have frequent contact with the health systems/workers during the pregnancy, thereby enabling her to learn more about possible complications of pregnancy and the benefits that can be gained from institutional delivery.
At the national level the coverage of at least one ante- natal care visit is around 76 percent and is comparatively higher than any other ANC component [6]. It could be argued that if all women who come for ANC visit would turn up for institutional delivery, maternal and infant death could be reduced considerably.
On the contrary, another argument put forward is that a mother who uses prenatal care may also utilize subse- quent health care services, not because of the role of prenatal care but as a consequence of the mother’s in- herent attitudes, beliefs and motivations. Many research- ers demonstrate that a woman’s beliefs, about the risk and effectiveness of health care affect the likelihood that she delivers her birth in an institution [7,11,15]. There- fore, literature also negates the positive impact of ANC visit on institutional delivery. Moreover, the bias always arises in a cross sectional study because one could not observe the outcomes of interest at the same time for a woman when she visits and does not visit the health cen-tre for ANC [16].
All the pooled evidence suggests there are substantial grounds to doubt the effectiveness of antenatal visits on subsequent institutional delivery. In promoting institu- tional delivery care it is essential that the positive effect of ANC visit leaves no room for doubt. However, the existing evidence we do have is not sufficient to quanti- fying its relative contribution to increase the chance of institutional delivery.
tion bias. It is found that selected characteristics women may have a higher chance to visit ANC and these char- acteristics might affect the women’s belief and attitudes for subsequent utilization of health care services. As it is evident from Figure 2, a large proportion of women
from the top two wealthquintiles, belong to urban areas, residents of southern and western regions, having higher education have visited health centre for receiving ANC.
Therefore this paper aims to examine the net impact of ANC visits on subsequent utilization of institutional de- livery after removing the presence of selection bias in the recent round of cross-sectional National Family Health survey data. In particular, an attempt is made to know at what extent the net difference observed in outcome be- tween treated and untreated groups of women could be attributed to ANC visit, given that all possible covariates are matched. Further, we also attempt to assess the sensi- tivity analysis of the applied procedure. Our paper con- tributes the present knowledge in several aspects. First, it reduces the possible selection bias with the help of re- lated covariates. Second, rather than using the conven- tional regression method, we use propensity score ma- tching method with a counterfactuals model that assesses the actual ANC visit effect on treated and untreated groups, and finally with the help of Mantel-Haenszel bounds it tells that whether the result is free from hidden bias or not.
2. DATA
[image:3.595.62.284.592.699.2]Nationwide data from India’s latest National Family Health Survey-III (NFHS-III) conducted during 2005- 2006 is used for the present study (IIPS & Macro Inter- national 2007). This survey is the Indian version of the Demographic Health Survey. The main objective of the survey is to collect reliable up to date information on fertility, mortality, maternal, child health, family planning and other related indicators to provide state level esti- mates. The sampling method used under NFHS was mul- tistage systematic random sampling.The survey adopted a two-stage sample design in rural areas and a three-stage
Figure 2. Mean of selected background characteristics of mo- ther who did not visited health center for ANC, who make 1 - 2 ANC visits and who make more than two ANC visits.
sample design in urban areas (for details regarding sam- pling, see IIPS & ORC Macro, 2007). This survey cov- ered a representative sample of 124,385 women in the age group of 15 - 49 years residing in 109,041 house- holds throughout India. The units of analysis in this study are most recent births that took place during the five years period immediately preceding the survey interview.
3. MEASURES
3.1. Outcome VariableIn NFHS-III, mothers who gave birth during the five years preceding the survey were asked about the place of delivery. Information regarding place of delivery is avail- able for all the successive births during five years pre- ceding the survey. Births occurring in health facilities, such as public institutions, NGO trusts and private hos- pitals are termed ‘institutional delivery’. In this study whether the mother delivered birth in a medical institu- tion (yes/no) is the response variable. Since NFHS-III collected information regarding ANC visits only for the most recent birth, we restrict our analysis only for last birth born during five years preceding the survey.
3.2. Treatment Variable
NFHS-III collected information on ANC visits for the most recent birth that resulted in a live birth during the five years preceding the survey. Mothers were asked about number of antenatal-care visits. In the present pa- per “frequency of contact with health system/workers” is defined as “number of ante natal care visits (No visit/1 - 2 visits/3 or more visits)”. The logic is that the number of times a woman visited for health centre for ANC repre- sents the frequency of her contact to the health sys- tems/workers. Finally, the analysis has been carried out in two separate models, in the first model ANC visits has been classified as either “1 - 2 visits” or “no visit”. In the second model we compare “three or more antenatal care visits” with “no visit”.
3.3. Matching Variables
On the basis of available literature and for the validity of assumptions, a large number of available pre-inter- vention characteristics have been included in the model. Matching based on large number of variables ensures a better chance that propensity score matching assumption holds true. Variables that at the same time influence both the participation decision in ANC visits and the outcome and which in turn, are unaffected by treatment have been included in the analysis. The lists of included variables are given below.
3.4. Household Characteristics
west and south), place of residence (urban and rural), religion (Hindu, Muslim and Other), caste (scheduled caste/scheduled tribe, non-scheduled caste/non-sched- uled tribe) and household wealth quintiles (poorest, poorer, middle, richer and richest) variables have been included in the models.
3.5. Demographic Characteristics
Demographic characteristics measured in NFHS-III include current age of mother (in years), age square of mother for linearity (in years), experience of child loss (no and yes), sex composition of living children (no sons
and no daughters, number of son greater than daughters, number of son less than daughters and equal number of sons and daughters), ever had a terminated pregnancy (no and yes) and birth interval(first birth, less than 24 months and more than 24 months).
3.6. Individual Characteristics
Respondent’s education (in years), respondent’s edu- cation square (in years), frequency of reading newspaper (not at all, less than once a week, at least once a week and almost every day), frequency of listening to radio
(not at all, less than once a week, at least once a week
and almost every day), frequency of watching television (not at all, less than once a week, at least once a week and almost every day), partner’s education (in years), square of partner’s education (in years), whether woman is allowed go to market, health facility and places outside the village/community (alone, with someone else only and not at all), having saving account in bank (no or yes), respondent’s and her partner’s occupation (not working, primary occupation, secondary occupation, tertiary oc- cupation and quaternary occupation), birth status (wanted, mistimed and unwanted) variables reflect individual characteristics.
The variables which were present in the interval scale have been kept only in that form to capture the wide range of propensity scores while performing the match- ing. The analysis was carried out using Stata 10 [17].
4. STATISTICAL PROCEDURES
4.1. Description of Propensity ScoreMatching Analysis
Propensity Score Matching is an innovative class of statistical methods that is useful in evaluating the treat-ment effects for cross-sectional/observational/non-ex- perimental data, when randomized clinical trials are not available.
4.2. Why Propensity Score Matching?
Basically we want to make comparisons of outcomes
(in terms of place of delivery) between those women who have visited health centre 1 - 2 times or more than two times during pregnancy and those who have not. Such comparisons may be relatively straightforward when selection of women who have visited health facil- ity is random and the selection process is not correlated with outcomes of interest. The average outcome for those who have visited a health facility is simply compared with the average outcome for those who have not visited a health facility. Because treated women (those who have visited health centre) and untreated women are expected to be statistically equivalent in all relevant characteristics with any other differences assumed to reflect chance, differences in average outcomes can be more convinc- ingly attributed to the effects of the treatment.
In general practice most of the time, assignment of subjects to the treatment and control groups is not ran- dom, and those who were treated may differ from those who were not, in some systematic way. It can be seen from Table 1 that the group of women who have visited
1 - 2 times or more than two times health center for ANC were different from the group of women who did not make any visit. Specifically, ANC visit is a process that permits schools to select only those women who meet certain requirements like geographical selection is a process that select out women who live in rural areas and belongs to central and eastern region where accessibility and availability of health facility is low compared to their counterparts. Also, demographic selection is a process that excludes from the treatment group those women who have higher parity (detailed descriptions of Table 1,
is given in result part).
In this situation, the estimation of the effect of ANC visits may be biased by the existence of confounding factors. Finally, the question is whether the difference observed in outcome data between those who have visi- ted health center for ANC is attributable to the ANC vis- its or to the fact that the women who have visited health center belong to a different population. If the differences are attributable to the ANC visits, the finding suggests that women who make ANC visits were more likely to deliver in an institution. Whereas, if the differences are attributable to the population of treatment group, the finding would show that women who make ANC visits would always have an institutional delivery, regardless of whether they have visited health center for ANC or not.
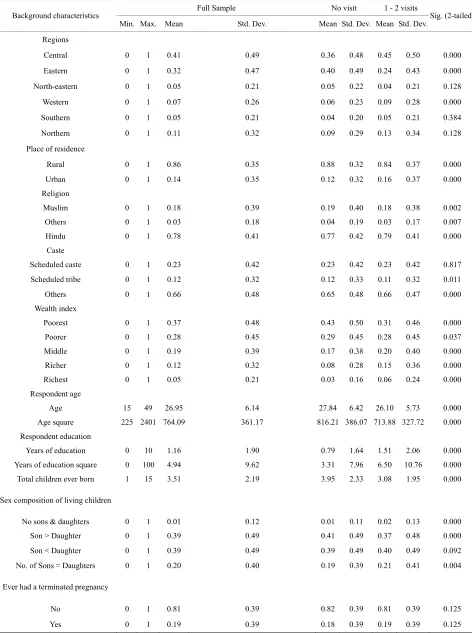
Table 1. Descriptive statistics by frequency of antenatal care visits, India, NFHS-2005-2006.
Full Sample No visit 1 - 2 visits Background characteristics
Min. Max. Mean Std. Dev. Mean Std. Dev. Mean Std. Dev. Sig. (2-tailed)
Regions
Central 0 1 0.41 0.49 0.36 0.48 0.45 0.50 0.000
Eastern 0 1 0.32 0.47 0.40 0.49 0.24 0.43 0.000
North-eastern 0 1 0.05 0.21 0.05 0.22 0.04 0.21 0.128
Western 0 1 0.07 0.26 0.06 0.23 0.09 0.28 0.000
Southern 0 1 0.05 0.21 0.04 0.20 0.05 0.21 0.384
Northern 0 1 0.11 0.32 0.09 0.29 0.13 0.34 0.128
Place of residence
Rural 0 1 0.86 0.35 0.88 0.32 0.84 0.37 0.000
Urban 0 1 0.14 0.35 0.12 0.32 0.16 0.37 0.000
Religion
Muslim 0 1 0.18 0.39 0.19 0.40 0.18 0.38 0.002
Others 0 1 0.03 0.18 0.04 0.19 0.03 0.17 0.007
Hindu 0 1 0.78 0.41 0.77 0.42 0.79 0.41 0.000
Caste
Scheduled caste 0 1 0.23 0.42 0.23 0.42 0.23 0.42 0.817 Scheduled tribe 0 1 0.12 0.32 0.12 0.33 0.11 0.32 0.011
Others 0 1 0.66 0.48 0.65 0.48 0.66 0.47 0.000
Wealth index
Poorest 0 1 0.37 0.48 0.43 0.50 0.31 0.46 0.000
Poorer 0 1 0.28 0.45 0.29 0.45 0.28 0.45 0.037
Middle 0 1 0.19 0.39 0.17 0.38 0.20 0.40 0.000
Richer 0 1 0.12 0.32 0.08 0.28 0.15 0.36 0.000
Richest 0 1 0.05 0.21 0.03 0.16 0.06 0.24 0.000
Respondent age
Age 15 49 26.95 6.14 27.84 6.42 26.10 5.73 0.000
Age square 225 2401 764.09 361.17 816.21 386.07 713.88 327.72 0.000
Respondent education
Years of education 0 10 1.16 1.90 0.79 1.64 1.51 2.06 0.000 Years of education square 0 100 4.94 9.62 3.31 7.96 6.50 10.76 0.000 Total children ever born 1 15 3.51 2.19 3.95 2.33 3.08 1.95 0.000
Sex composition of living children
No sons & daughters 0 1 0.01 0.12 0.01 0.11 0.02 0.13 0.000 Son > Daughter 0 1 0.39 0.49 0.41 0.49 0.37 0.48 0.000 Son < Daughter 0 1 0.39 0.49 0.39 0.49 0.40 0.49 0.092 No. of Sons = Daughters 0 1 0.20 0.40 0.19 0.39 0.21 0.41 0.004
Ever had a terminated pregnancy
No 0 1 0.81 0.39 0.82 0.39 0.81 0.39 0.125
Continued
Full Sample No visit 1 - 2 visits (2-tailed)Sig. Background characteristics
Min. Max. Mean Std. Dev. Mean Std. Dev. Mean Std. Dev.
Wanted last child
Mistimed 0 1 0.09 0.28 0.07 0.25 0.10 0.31 0.000
Unwanted 0 1 0.17 0.38 0.21 0.40 0.14 0.35 0.000
Wanted 0 1 0.74 0.44 0.72 0.45 0.75 0.43 0.000
Birth interval
First birth 0 1 0.18 0.38 0.21 0.40 0.22 0.41 0.000
Less than 24 0 1 0.20 0.40 0.65 0.48 0.20 0.40 0.122 More than 24 0 1 0.62 0.49 0.00 0.00 0.59 0.49 0.000
Experience child loss
No 0 1 0.71 0.45 0.67 0.47 0.75 0.44 0.000
Yes 0 1 0.29 0.45 0.33 0.47 0.25 0.44 0.000
Frequency of reading newspaper/magazine
Not reading paper 0 1 0.88 0.33 0.92 0.27 0.83 0.38 0.000 Reading paper less than once a week 0 1 0.08 0.27 0.05 0.21 0.11 0.31 0.000
Reading paper at least once a week 0 1 0.03 0.18 0.02 0.14 0.05 0.21 0.000 Reading paper almost every day 0 1 0.01 0.12 0.01 0.10 0.02 0.14 0.000
Frequency of listening to radio
Not listening radio 0 1 0.64 0.48 0.67 0.47 0.61 0.49 0.000 Listening radio less than once a week 0 1 0.16 0.37 0.15 0.35 0.18 0.38 0.000
Listening radio at least once a week 0 1 0.10 0.30 0.10 0.30 0.10 0.30 0.695 Listening radio almost every day 0 1 0.10 0.30 0.08 0.28 0.11 0.31 0.000 Frequency of watching television
Not watching television 0 1 0.63 0.48 0.72 0.45 0.54 0.50 0.000 Watching TV less than once a week 0 1 0.13 0.33 0.11 0.31 0.15 0.35 0.000
Watching TV at least once a week 0 1 0.09 0.29 0.07 0.26 0.11 0.31 0.000 Watching TV almost every day 0 1 0.15 0.36 0.10 0.30 0.21 0.40 0.000
Respondent occupation
Not working 0 1 0.58 0.49 0.55 0.50 0.61 0.49 0.000
Primary occupation 0 1 0.33 0.47 0.36 0.48 0.30 0.46 0.000 Secondary occupation 0 1 0.07 0.26 0.07 0.26 0.07 0.26 0.810 Tertiary occupation 0 1 0.02 0.13 0.01 0.11 0.02 0.14 0.002 Quaternary occupation 0 1 0.00 0.02 0.00 0.02 0.00 0.03 0.265 Allowed to go to: market
Alone 0 1 0.39 0.49 0.40 0.49 0.38 0.49 0.013
With someone else only 0 1 0.46 0.50 0.46 0.50 0.47 0.50 0.135 Not at all 0 1 0.15 0.36 0.14 0.35 0.15 0.36 0.215 Allowed to go to: health facility
Alone 0 1 0.38 0.48 0.38 0.49 0.37 0.48 0.099
Continued
Full Sample No visit 1 - 2 visits Background characteristics
Min. Max. Mean Std. Dev. Mean Std. Dev. Mean Std. Dev. Sig. (2-tailed)
Allowed to go to: places outside this village/community
Alone 0 1 0.27 0.44 0.29 0.45 0.25 0.43 0.000
With someone else only 0 1 0.63 0.48 0.60 0.49 0.66 0.48 0.000 Not at all 0 1 0.10 0.30 0.11 0.31 0.09 0.29 0.000 Have bank or savings account
No 0 1 0.94 0.23 0.95 0.22 0.93 0.25 0.000
Yes 0 1 0.06 0.23 0.05 0.21 0.06 0.24 0.000
Partner education
Years of education 0 10 2.35 2.29 2.00 2.24 2.69 2.29 0.000 Years of education square 0 100 10.79 13.37 9.02 12.49 12.50 13.97 0.000
Partner occupation
Not working 0 1 0.04 0.21 0.04 0.21 0.05 0.21 0.765
Primary occupation 0 1 0.37 0.48 0.40 0.49 0.35 0.48 0.000 Secondary occupation 0 1 0.50 0.50 0.49 0.50 0.51 0.50 0.027 Tertiary occupation 0 1 0.07 0.26 0.06 0.24 0.08 0.27 0.000 Quaternary occupation 0 1 0.01 0.09 0.01 0.09 0.01 0.10 0.132
where D = {0, 1} is the indicator of exposure to health facility and X is the multidimensional vector of pre ANC visits characteristics.
the health system/workers. The measure of treatment impact, controlling for other observable characteristics of individuals and assuming a causal interpretation, is given by the regression coefficient for the exposure variable. The conventional regression model using a dichotomous indicator of treatment does not work, and may give an inconsistent and biased estimate about the ANC visits.
4.4. Defining the Impact of Frequency of ANC Visits
The impact of ANC visits for a woman i, noted δi, is
defined as the difference between the potential outcome in the presence of and the potential outcome in the ab- sence of ANC visits
An alternative solution to the multiple regression analysis, is matching methods, which compare outcomes for exposed and unexposed individuals with similar ob- served characteristics or similar likelihoods of being ex- posed [18-20]. However, the limitation of this method is that matching treatment and control individuals becomes increasingly difficult as the number of covariates on which matching is intended increases. Propensity score match- ing helps to overcome this limitation by allowing match- ing to be based on a score function of observable charac- teristics [21].
1 0 i Yi Yi
(1) The evaluation seeks to estimate the mean impact of ANC visits, obtained by averaging the impact across all the women in the population. This parameter is known as Average Treatment Effect (ATE)
1 0
ATEE E Y Y (2)
where E(.) represents the average. 4.3. Calculation of Propensity Score
4.5. Counterfactual Model It is the probability that a woman exposed to health
facility, given her various background characteristics [22]
Recently the counterfactual approach which is the part of causal analysis has made important inroads into statis- tical and econometric work [23,24]. It has then entered sociological research through a number of papers that
Pr
1
articulate the major differences between propensity score matching approach and the widely used standard regres- sion approach to causal inference [25].
It is for the calculation of average treatment effect that the counterfactual model has been constructed. Counter- factual is the potential outcome, or the state of affairs that would have happened in the absence of the cause. Counterfactual model guides the estimation of ANC vis- its effects.
With the help of this model, Average Treatment Effect on the Treated (ATT) has been calculated. This measures the impact of the treatment on treated women
1 1
0ATTE Y D E Y D1
(3)where E Y D
1 1
is the average outcome of thewomen who have visited a health centre.
0 1E Y D
is the counterfactual, it shows averageoutcome that the treated individuals would have obtained in absence of ANC visits, which is unobserved.
Finally, the Average Treatment Effect on the untreated women (ATU) has been measured, which shows the im- pact ANC visits would have had on those who did not make any visit
1 0
0 0ATU E Y D E Y D
(4)where E Y D
0 0
is the average observed outcomefor those women who did not visit health centre.
1 0E Y D
is the counterfactual and it shows theaverage outcome for those women who did not make any visit, if they would have obtained in presence of ANC visits, which is unobserved.
Our main aim is to calculate the average treatment ef-fect (ATE)
1
0
ATEE Y D E Y D
We can write ATT E Y D
0 1
E Y D0 0
if 0 1 0 0ATT E Y D E Y D
(5)If Eq.5 is true, then the ATT can be estimated by the
difference between the mean observed outcomes for treated and untreated women. However, in many cases
Eq.5 is not true. The main goal of an evaluation is to
ensure that the selection bias is equal to 0 in order to correctly estimate the parameter of interest. Matching is the solution to overcome this problem.
4.6. Matching Correction Method
Different matching methods have been developed, all attempting to match as many treatment individuals with control individuals as possible. We have applied several matching methods and overall measures of imbalance in the covariates (before and after matching) are checked.
The result shows that the average standardized bias is reduced maximum through nearest neighbor matching with replacement method. Thus, among all matching me- thods, we make use of the Nearest Neighbor Matching with Replacement method in the both the models i.e. “no visit” vs. “1 - 2 visits” and “no visit” vs. “at least three visits”.
4.7. Assumptions
Basically matching relies on the assumption of condi- tional independence of potential outcomes and treatment assignment given observables. This is the so-called Con- ditional Independence Assumption and is also known as “unconfoundedness” in the program evaluation litera- ture.
4.8. Conditional Independence Assumption
For a given set of observable X which is not affected bytreatment, potential outcomes are independent of treat- ment assignment:
(Un-confoundedness) Y(0), Y(1) D X , X.
The practical meaning of this condition for matching is the availability of characteristics observed before the intervention takes place, as the variables observed after the intervention could themselves be influenced by the intervention.
4.9. Common Support
A further requirement besides independence is the common support or overlap condition. It rules out the phenomenon of perfect predictability of D given X: (Overlap) 0P D
1X
1.It ensures that persons with the same X values have a positive probability of being both participants and non-participants. Treated units whose P is larger than the largest P in the non-treated pool are left unmatched.
5. RESULTS
5.1. Descriptive Statistics: Mean and Standard Deviation by Frequency of Antenatal Care Visits
Table 1 presents the unadjusted mean and standard
deviation of selected socio-economic and demographic characteristics of mother who did not visited health cen- ter for ANC and those who made 1 - 2 ANC visits. The study was based on 7219 (48.6 percent) mothers who do not make any ANC visit and 7641 (51.4 percent) mothers who made 1 - 2 ANC visits for their last pregnancy.
for ANC. It can be noted from the table that compared to their matching counterparts, mothers who did not make any ANC visit were having significantly less chance to reside in urban areas and they mainly belong to the east- ern region followed by the central region, come from the poorest and poorer households and were mainly less educated.
The analysis shows that mother who did not make any ANC visit belong to Muslim religion and scheduled tribes. The data also indicates that the mean total children ever born were relatively higher for these women com- pared to their counterparts. Compared to their matching counterparts these women have large number of sons than daughters, more chance to report their last birth as unwanted and had experienced child loss. Women who did not make any ANC visit had less chance to get ex- posed to the mass media, as the table clearly shows that larger proportion of women were not in touch with news paper, radio and television. Lastly, mothers who do not make any antenatal care visit have more chance than their counterparts to be unemployed.
On the other hand, mothers who made 1 - 2 antenatal care visits were having significantly higher chance to reside in western region, belong to urban areas, being Hindus and to non-scheduled caste/tribes. The table clearly shows that they mainly come from the middle to richest class and were having less number of children ever born and have equal number of sons and daughters. Compared to their counterparts, women who had visited health facility for at least 1 - 2 times reported status of last child was wanted, had less experience of child loss and had higher chance of having exposed to mass media
i.e. their frequency of reading newspaper, listening radio and watching television was significantly higher com- pared to women who did not make any antenatal acre visit. These women had significantly higher chance of having savings account in bank.
In the case of no visit vs. more than two visits, the study is based on 7219 (31.2 percent) mothers who did not make any antenatal care visit and 21,990 (68.8 per- cent) mothers who received more than two antenatal care visits for their youngest child. It can be noted (table not shown) that compared to their matching counterparts, mothers who made at least three ANC visits were having significantly higher chance to reside in urban areas and they mainly belong to southern and eastern regions come from the richer and richest households and were highly educated. The caste profile of these women closely re- sembled that of women who made more than two visits for ANC belonging to non Scheduled Caste/Scheduled Tribes. They have less number of children ever born and have not had any child loss. Their frequency of reading newspaper, listening radio and watching television was significantly higher compared to their counterparts. Hus-
band’s of women who made more than two antenatal care visits are mainly involve in tertiary and quaternary occupations, they allowed women to go to market, health facility and outside the village/community alone com-pare to their counterparts.
The finding reveals that socioeconomic and demo- graphic characteristics of women who make 1 - 2 or more than two ANC visits were significantly different from those who did not make any ANC visit during pregnancy. Also it clearly shows that selection bias was present in the study population, which could be solved by the matching process. Multiple regressions analysis cannot address bias problem and this needs balancing of two groups in terms of all possible covariates.
5.2. Choice of Variables and Algorithm for Matching
Only those variables which show that the means dif- ference, between treated and untreated groups were sig- nificant has been included for matching purpose. Further, “hit or miss” method has been applied to satisfy the bal- ancing property, and finally to achieve the quality of matching, probit model has been applied.
Region of residence, place of residence, household wealth quintiles, religion, caste women age, women age square, respondent education, respondent education square, frequency of reading news paper, sex composition of living child, partner education, partner education square, whether a woman is allowed go to: place outside the vil- lage/community, having saving account in bank, previous birth interval, experience of child loss and number of children, have satisfied the balancing processes between women who had 1 - 2 visit health center for ANC and those who did not make any visit.
when women who have visited a health center more than twice for ANC and those who did not make any visit for ANC are considered, woman’s age, women age square, place of residence, household wealth quintile, respondent’s education, respondent’s education square, women’s religion, frequency of reading news paper, partner’s education, partner’s education square, caste of women, having a savings account in bank, experience of child loss, whether women is allowed go to market and health facility, respondent’s occupation and birth status have satisfied the balancing processes.
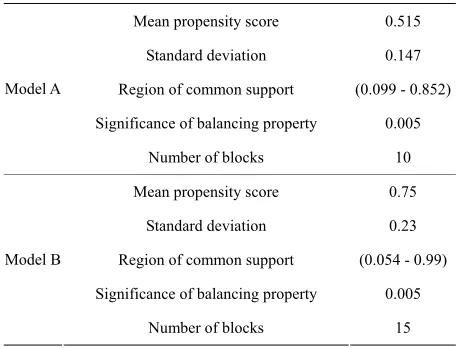
5.3. Description of the Estimated Propensity Scores
Table 2 Model A presents a description of the esti-
Table 2. Estimated propensity scores.
Mean propensity score 0.515 Standard deviation 0.147 Region of common support (0.099 - 0.852) Significance of balancing property 0.005 Model A
Number of blocks 10 Mean propensity score 0.75
Standard deviation 0.23 Region of common support (0.054 - 0.99) Significance of balancing property 0.005 Model B
Number of blocks 15
The balancing property was satisfied at significance level of p < 0.005. The region of common support between the treated and the control group was high and ranges from 0.099 to 0.887 of the propensity score. Treated and con- trol women with propensity scores outside the common support were not considered for the analysis. The final number of blocks was 10.
A comparison of none vs. at least three ANC visits showed that (Model B) the mean propensity score was 0.75 and standard deviation was 0.23, between treatment and control groups. The region of common support be- tween treated and control group is relatively high com- pared to 1 - 2 ANC visit, covering 94 percent of women. The common support region excludes treated units whose propensity score was higher than the highest pro- pensity score of the control units and control units whose propensity scores were lower than the lowest propensity score of the treated units. The final number of blocks was 15.
5.4. Impact Assessment of ANC Visits on Institutional Delivery
Turning to the result of the matching, Model A of Ta- ble 3 illustrates the matching estimates. Propensity score
matching eliminates most of the bias attributable to ob- servable covariates. The difference in mean outcomes in the matched samples can be used to obtain an estimate of the average treatment effect on the treated women. Un- matched sample estimate presents the raw estimate, i.e.
without matching result shows that those women who had visited health center 1 - 2 times for ANC had 11 per- cent higher chance to deliver birth in an institution com- pared to women who did not make any visit. ATT, ATU and ATE show the estimates after matching.
Results give the estimates of the average treatment on treated of antenatal care visits based on the nearest neigh- bour matching with replacement method. Standard error
for difference of average treatment effects (ATT) was calculated by bootstrapping method as suggested by Lechner (2002), using 100 replications [26]. ATT value in treated and control groups were 0.243 and 0.177 re- spectively, which means that among, those women who had 1 - 2 times visited health centre for ANC if they would not visited then, only 17 percent women delivered their birth in an institution. ATU value shows that, if those women who did not visit health centre for ANC would have made 1 - 2 ANC visits, their chance of de- livery in an institution will increase up to 5.9 percent point.
The output shows that we get a significant positive treatment effect on the treated (ATT) of 0.066. That is, the institutional delivery of treated women is signifi- cantly 6.6 percent higher than that of matched control group women. ATE shows the difference between the treated and the untreated women which was 0.062.
Model B of Table 3 gives the estimates of the average
treatment on treated women who have visited more than two times for ANC. Present case unmatched sample es- timate shows that those women who had visited health center at least three times for ANC had 55 percent higher chance of deliver birth in an institution compared to women who did not make any visit. ATT, ATU and ATE show the correct estimates after matching. ATT values under treated and controls groups were 0.680 and 0.363 respectively which shows that among those women who have visited at least three times for ANC only 36 percent women would have delivered their birth at institution if they would not visited health canter. The output shows that we get a higher significant positive treatment effect on the treated women of 0.317. That is women who had visited health centre at least three times for ANC, institu- tional delivery of treated women is 31 percent higher than that of matched control group women. Similarly, ATU value in treated group was 0.127 and for the under control group it was 0.348. This clearly shows that those women who have not visited health centre for ANC their chance of deliver birth at institution will be increase from 12 percent to 34 percent point if they would make at least three ANC visits. The result also gives the estimates of the average treatment on treated of antenatal care visits which was 0.293.
6. VERIFICATION OF ESTIMATES
OBTAINED FROM TABLE 3
6.1. Common SupportModel A of Table 4 demonstrates that the number of
Table 3. Matching estimates of ANC visits on institutional delivery.
Sample Treated Controls Difference S.E. T-stat P > z 95% CI
Unmatched 0.243 0.127 0.116 0.006 18.330
ATT 0.243 0.177 0.066 0.009* 7.430* 0.000* (0.048 - 0.083)*
ATU 0.127 0.186 0.059 . .
Model A
ATE 0.062 . .
Unmatched 0.681 0.127 0.554 0.006 93.33
ATT 0.680 0.363 0.317 0.0115* 27.44* 0.000* (0.294 - 0.339)*
ATU 0.127 0.348 0.221 .
Model B
ATE 0.293
[image:11.595.58.541.285.505.2]Note: *based on bootstrap standard error.
Table 4. Description of sample used in matching analysis.
Sample Size
Treatment assignment Off Support On Support Total
Untreated 4 7196 7200
Treated 0 7629 7629
Total 4 14,825 14,829
Percentage treated dropped (estimating ATT) 0 Model A
Percentage untreated dropped (estimating ATU) 0.0003
Sample Size
Treatment assignment Off support On support Total
Untreated 1 7199 7200
Treated 47 21,911 21,958
Total 48 29,110 29,158
Percentage treated dropped (estimating ATT) 16.0 Model B
Percentage untreated dropped (estimating ATU) 0.003
common support were discarded. Of the 14,829 observa- tions, four were discarded from the untreated group leaving a sample size of 14,825 observations. Table shows that the percentage of untreated dropped sample was 0.0003 only.
Model B of Table 4 reveals that the while comparing
no antenatal care visit to more than two antenatal case visits, of the 29,158 observations, total 48 samples were discarded. One was discarded from the untreated group and 47 were discarded from the treated group leaving a sample size of 29,110 observations. Table also shows that the percentages of treated and untreated dropped sample were 0.16 vs. 0.003 respectively.
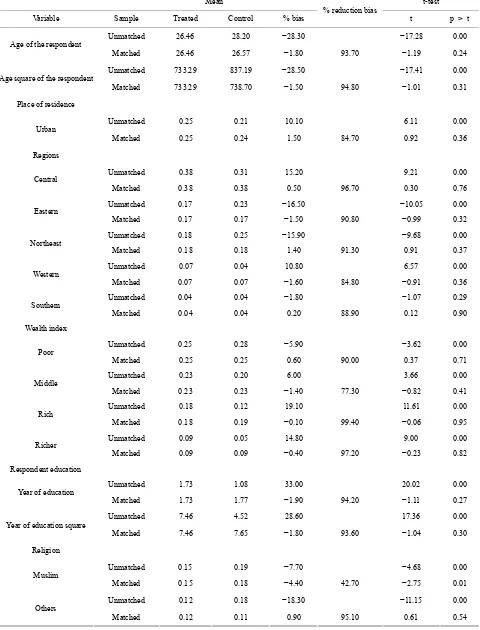
6.2. Balancing Test
Table 5 shows the mean values of each variable before
and after matching in both treated and untreated groups. A bias before and after matching was calculated for each
variable and the change in this bias has also been re- ported. This tablealso shows the percentage bias reduc- tion for all matching variables after matching. Moreover, the difference between the matched pairs was evaluated using t-test and the last column shows the significance level of t-test. The hypothesis of t-test is that the mean value of each variable is the same in the treated women and the untreated women.
It was found that almost all covariates show that mean difference was not significant after matching i.e. covari- ates was sufficiently balances. There were significant differences between individuals in unmatched cases for around all covariates which became insignificant after matching.
Table 5. Covariate balance check and absolute bias reduction, India, NFHS 2005-2006.
Mean t-test
Variable Sample Treated Control % bias % reduction bias t p > t
Unmatched 26.46 28.20 −28.30 −17.28 0.00
Age of the respondent
Matched 26.46 26.57 −1.80 93.70 −1.19 0.24
Unmatched 733.29 837.19 −28.50 −17.41 0.00
Age square of the respondent
Matched 733.29 738.70 −1.50 94.80 −1.01 0.31
Place of residence
Unmatched 0.25 0.21 10.10 6.11 0.00
Urban
Matched 0.25 0.24 1.50 84.70 0.92 0.36 Regions
Unmatched 0.38 0.31 15.20 9.21 0.00
Central
Matched 0.38 0.38 0.50 96.70 0.30 0.76
Unmatched 0.17 0.23 −16.50 −10.05 0.00
Eastern
Matched 0.17 0.17 −1.50 90.80 −0.99 0.32
Unmatched 0.18 0.25 −15.90 −9.68 0.00
Northeast
Matched 0.18 0.18 1.40 91.30 0.91 0.37
Unmatched 0.07 0.04 10.80 6.57 0.00
Western
Matched 0.07 0.07 −1.60 84.80 −0.91 0.36
Unmatched 0.04 0.04 −1.80 −1.07 0.29
Southern
Matched 0.04 0.04 0.20 88.90 0.12 0.90 Wealth index
Unmatched 0.25 0.28 −5.90 −3.62 0.00
Poor
Matched 0.25 0.25 0.60 90.00 0.37 0.71
Unmatched 0.23 0.20 6.00 3.66 0.00
Middle
Matched 0.23 0.23 −1.40 77.30 −0.82 0.41
Unmatched 0.18 0.12 19.10 11.61 0.00
Rich
Matched 0.18 0.19 −0.10 99.40 −0.06 0.95
Unmatched 0.09 0.05 14.80 9.00 0.00
Richer
Matched 0.09 0.09 −0.40 97.20 −0.23 0.82
Respondent education
Unmatched 1.73 1.08 33.00 20.02 0.00
Year of education
Matched 1.73 1.77 −1.90 94.20 −1.11 0.27
Unmatched 7.46 4.52 28.60 17.36 0.00
Year of education square
Matched 7.46 7.65 −1.80 93.60 −1.04 0.30
Religion
Unmatched 0.15 0.19 −7.70 −4.68 0.00
Muslim
Matched 0.15 0.18 −4.40 42.70 −2.75 0.01
Unmatched 0.12 0.18 −18.30 −11.15 0.00
Others
Continued
Mean t-test
Variable Sample Treated Control % bias % reduction bias t p > t
Frequency of reading newspaper or magazine
Unmatched 0.11 0.06 17.80 10.78 0.00
Reading paper less than once a week
Matched 0.11 0.12 −1.70 90.70 −0.91 0.37
Unmatched 0.06 0.03 15.40 9.32 0.00
Reading paper at least once a week
Matched 0.06 0.06 1.00 93.40 0.55 0.58
Unmatched 0.03 0.02 7.80 4.75 0.00
Reading paper almost every day
Matched 0.03 0.03 −3.40 56.10 −1.82 0.07
Sex composition of living children
Unmatched 0.38 0.40 −4.10 −2.49 0.01 No sons and no daughters
Matched 0.38 0.38 −0.40 90.10 −0.25 0.80
Unmatched 0.40 0.39 1.70 1.06 0.29
No. of son greater than daughter
Matched 0.40 0.40 0.70 60.20 0.43 0.67
Unmatched 0.21 0.20 1.90 1.16 0.25
Equal sons and daughters
Matched 0.21 0.21 0.30 86.30 0.16 0.87 Partner education
Unmatched 2.78 2.11 30.20 18.39 0.00
Year of education
Matched 2.78 2.78 0.00 99.90 0.01 0.99
Unmatched 12.83 9.35 26.50 16.08 0.00
Year of education square
Matched 12.83 12.86 −0.20 99.10 −0.13 0.89 Caste of women
Unmatched 0.21 0.18 6.70 4.06 0.00
Scheduled caste
Matched 0.21 0.20 3.60 45.60 2.22 0.03 Unmatched 0.18 0.24 −16.80 −10.25 0.00 Scheduled tribes
Matched 0.18 0.17 1.00 94.20 0.64 0.52 Allowed to go to places outside the
village/community
Unmatched 0.62 0.56 11.60 7.09 0.00
With someone else only
Matched 0.62 0.61 1.10 90.40 0.70 0.49 Unmatched 0.08 0.10 −6.30 −3.86 0.00 Not at all
Matched 0.08 0.09 −1.30 79.10 −0.85 0.40
Unmatched 0.07 0.05 8.00 4.88 0.00
Have bank or savings account
Matched 0.07 0.06 1.90 76.50 1.11 0.27 Birth Interval
Unmatched 0.20 0.21 −1.80 −1.07 0.28 Less than 24
Matched 0.20 0.20 0.90 46.80 0.58 0.56 Unmatched 0.58 0.64 −13.00 −7.93 0.00 More than 24
Matched 0.58 0.58 −0.40 96.70 −0.26 0.79 Unmatched 0.23 0.30 −16.30 −9.93 0.00 Experience at least one child loss
Matched 0.23 0.23 0.80 95.10 0.52 0.60 Unmatched 3.05 3.86 −38.00 −23.19 0.00 Total children ever born
Table 6. Overall significance of model after conducting ma- tching analysis.
nificant difference between two matched groups, which clearly indicate that the two matched groups are well balanced. This method of matching thus generates a high degree of “covariate balance” between the treated and untreated samples that were used in the estimation pro- cedure. The balance between treated and control groups is improved by more than 90 percent from the unmatched sample for 20 variables out of 33 variables.
Sample Pseudo R2 LR chi2 p > chi2 Unmatched 0.066 1347.070 0.000
Matched 0.002 33.160 0.459
[image:14.595.309.537.204.357.2] [image:14.595.312.535.427.575.2]Table 7. A sensitivity analysis using Mantel-Haenszel (1959) bounds for variable institutional delivery.
Figure 3 illustrates the quality of the matching by the
distributions of the propensity scores for women who have visited health centre 1 - 2 times and women who did not visit health centre. Untreated women with pro- pensity score were below the line, and treated women were above the line. As the figure shows, the distribu- tions are almost identical for treated and control groups after matching on propensity scores. The existence of a substantial overlap between the characteristics of treated and untreated women confirms the validity of common support assumption.
Gamma (Γ) Q_mh+ Q_mh− p_mh+ p_mh−
1 7.233 7.233 0.000 0.000
1.1 5.639 8.837 0.000 0.000 1.2 4.189 10.310 0.000 0.000 1.3 2.860 11.675 0.002 0.000 1.4 1.631 12.948 0.051 0.000 1.5 0.488 14.141 0.313 0.000 1.6 0.520 15.267 0.302 0.000 1.7 1.524 16.332 0.064 0.000
6.3. Significance of Model
Table 6 present the value of pseudo-R2, likelihood ra-
tio chi2 and the p-value of the likelihood ratio test for
unmatched and matched sample. The pseudo-R2indicates
how well the predictors explain the probability of ante- natal care visits. After matching, there should be no sys- tematic differences in the distribution of covariates be- tween both groups. The table shows that after matching the value of pseudo R2 is low i.e. 0.002, earlier it was
0.066. The p-value of the likelihood ratio test becomes insignificant in matched sample.
Gamma: odds of differential assignment due to unobserved factors; Q_mh+: Mantel-Haenszel statistic (assumption: overestimation of treatment effect); Q_mh−: Mantel-Haenszel statistic (assumption: underestimation of treatment effect); p_mh+: significance level (assumption: overestimation of treatment effect); p_mh−: significance level (assumption: underestimation of treatment effect).
0 .2 .4 .6 .8
Propensity Score
Untreated Treated: On support
6.4. Sensitivity Analysis
The fact that selection into treatment is only driven by factors that the researcher can observe. But there are some factors which are unobservable. If the assignment to treatment is endogenous i.e. if unobserved variables that affect the assignment procedure are also related to the outcomes, propensity-score matching is not a consis- tent estimator for treatment effects. In order to estimate the extent to which such selection on unobservable may bias quantitative inferences about the effects of antenatal care visits, we present the result of sensitivity analysis using Mantel-Haenszel bounds in Table 7.
Figure 3. Predicted probability of 1 - 2 antenatal care visits: matched sample.
the estimated ANC visits effect is positively related to institutional delivery, we consequently restrict our atten- tion to bounds for positive bias. By comparing the Man- tel-Haenszel bounds on treatment effects at different lev- els of Γ we can assess the strength unmeasured influ- ences would require in order to alter the estimated ANC visits effects. The critical level of Γ was above 1.3 at which we would have to question our conclusion of a positive effect of antenatal care visits. A value for Γ above 1.3 does not mean that there was no positive effect This table shows that the p-value for the averaged
of antenatal care visits on institutional delivery. It sug- gests important information about the level of uncer- tainty contained in matching estimators by showing just how large the influence of a confounding variable must be to weaken the conclusions of a matching analysis.
7. DISCUSSION AND CONCLUSIONS
Focusing on leverage of frequency of contact with the health systems/workers, we examined the impact of fre- quency of antenatal care visits on subsequent institu- tional delivery. The examination was based on the third round of National Family Health Survey data set of 7199 women who did not make any ANC visits, 7629 and 21,958 women make 1 - 2 and three or more antenatal care visits, respectively covering the years 2005-2006 in India.Moreover, literature asserts that prenatal care is an imperative factor for subsequent health care utilization and some researchers have tried to show that antenatal care is associated with institutional delivery [27,28]. However, in social settings where we try to capture the effect of antenatal care visits on institutional delivery, selection bias would be an issue of concern. In the pre- sent paper actual state of study population reveals that
(Table 1) women who did not make any ANC visits were
socioeconomically and demographically different from the women who have visited health centre for ANC, ei- ther 1 - 2 or more than twice. Therefore, in this situation a simple comparison of the outcome variable between group of women who makes and did not make any ANC visits would yield biased estimates of the impact of an- tenatal care visits and the last result would not explicitly adjusted for endogeneity bias.
A review of the existing literature shows that practi- cally no attempt has yet been made to remove the selec- tion bias present in data set to rectify the causal estima- tion of the ANC visit which leads to institutional delivery. Some of the possible difficulties in assessing the actual effect of ANC visits could be unavailability of experi- mental observations or longitudinal data. As for the au- thors knowledge this is the first study which attempts to quantify the magnitude of ANC visits after removing the possible selection bias.
The propensity score matching analysis used in this study sheds new light into this line of research which provides an effective strategy for controlling the con- founding influence of institutional delivery. The match- ing technique offers a means to estimate treatment effects when controlled randomization is not possible and there were no convincing natural experiments which could substitute randomization. This method is able to match two groups of women simultaneously in as many dimen- sions as needed and also provides a way to investigate impact of numbers of antenatal care visitscharacteristics.
The finding based on propensity score matching provides a better comparison group of women who have visited health centre for ANC with less dependence on statistical assumptions than standard regression approaches.
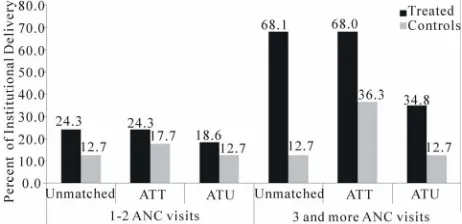
In the present research, we opt for the nearest neighbor with replacement method to match treated and control groups. Figure 4 illustrate that in unmatched sample, 1 -
2 and three or more ANC visits models the difference between treated and control was 11.6 percent and 55.4 percent correspondingly, which was quite high in com- parison to average treatment on treated women (ATT) and average treatment on untreated women (ATU). These findings clearly indicate that the selection bias present in data set leads to overestimates of the positive effects of ANC visits in both the models. However, when treated women were compared with their matched counterparts who were similar in every observed preexisting charac- teristic except ANC visits, women who have visited health centre still has significant positive effects on sub- sequent institutional delivery in both the models.
[image:15.595.308.539.586.698.2]Employing the propensity score matching estimation approach, we found that contact with health workershas shown the positive and significant effect on increasing the institutional delivery. Interestingly, not only is any ANC visit significantly related to institutional delivery but also the number of times a woman makes ANC visits during pregnancy matters. The focus of this paper is to find out the true impact of 1 - 2 and three or more ANC visits on institutional delivery and the results show the latter emerging as a more influential. Specifically, women who made 1 - 2 ANC visits had 6.6 percent higher chance to deliver in an institution compared to women who make no visit. In addition, if a woman vis- ited health centre three or more than three times, her chances were 31 percent higher to deliver in an institu- tion. Our illustrative results demonstrated the usefulness of at least three ANC over 1 - 2 ANC visit for subsequent institutional delivery. In addition to producing valid treatment estimates we also need to produce valid stan- dard errors, which could be possible with the bootstrap method, and result of bootstrap standard deviation con-
firms that in both the situations ANC has significant positive impact on institutional delivery.
While establishing the actual impact of ANC visits on institutional delivery the basic question is whether unob- served factors can alter inference of ANC visit effect? We have employed Mantel-Haenszel bounds method for sensitivity analysis, which determine how strongly an unmeasured variable must influence the selection method to weaken the inferences of the matching analysis. Result based on sensitivity analysis provides an important tool for assessing the level of vigilance that one should use when interpreting the significance tests. The finding sug- gests that selection bias on unobserved covariates would have to be around 40 percent to alter these propensity score matching estimates in case 1 - 2 ANC visits, i.e. if the 39 percent bias involved in the result then also we can observe the true positive effect of 1 - 2 ANC visits on institutional delivery.
8. POLICY IMPLICATIONS
Insufficient improvement in meeting the fifth United Nations Millennium Development Goal of reducing ma- ternal mortality in developing countries, including India, necessitates fresh approaches to maternal health inter- ventions [29]. After implementation of various schemes launched by Government of India, women are not able to deliver in an institution. A large proportion of women were not able to make any ANC visits, which could be considered as a first entry point into health systems. Fur- ther, if they visited to health centres for ANC, they have not continued subsequent health care utilization.
Findings suggest that interventions which plan to in- crease institutional delivery should target pregnant women who come for ANC checkups at institution first time and health workers should take advantage of a woman’s contact with a health facility at that time. Health workers should encourage women to return to the health centre for more number of visits, as our results indicate that more than two ANC visits significantly change the women’s attitudes towards institutional de- livery. Improved interpersonal communications in the health facility at the time of ANC checkup may be an ideal approach to encouraging women for institutional delivery. It has been documented that at the time of pregnancy a woman is likely to be most amenable to being convinced to use services that are favorable for her and for her child’s health [9]. Efforts should also be made to convey the importance of ANC visits to those women who did not make any ANC visits.
REFERENCES
[1] Lim, S.S., Dandona, L., Hoisington, J.A., et al. (2010)
India’s Janani Suraksha Yojana, A conditional cash trans-fer programme to increase births in health facilities: An impact evaluation. Lancet, 375, 2009-2023.
doi:10.1016/S0140-6736(10)60744-1
[2] Titaley, C.R., Dibley, M.J. and Roberts, C.L. (2011) Type of delivery attendant, place of delivery and risk of early neonatal mortality: Analyses of the 1994-2007 Indonesia demographic and health surveys. Health Policy and Plan- ning, 27, 405-416.
[3] Koblinsky, M., Campbell, O. and Heichelheim, J. (1999) Organizing delivery care—What works for safe-mother- hood? Bulletin of World Health Organization, 77, 399- 406.
[4] Graham, W.J., Bell, J.S. and Bullough, C.H.W. (2000) Can skilled attendance at delivery reduce maternal mor- tality in developing countries? Studies in Health Services Organization and Policy, 17, 97-130.
[5] Freedman, L.P., Graham, W.J., Brazier, E., et al. (2007) Practical lessons from global safe motherhood initiatives: Time for a new focus on implementation. Lancet, 370, 1383-1391. doi:10.1016/S0140-6736(07)61581-5 [6] IIPS, ORC MACRO (2007) National family health survey,
2007-2008. International Institute for Population Sciences, Mumbai.
[7] Sugathan, K.S., Mishra. V. and Retherford, R.D. (2001) Promoting institutional delivery in India: Role of antena- tal care services. National family health survey. Subject Report, International Institute for Population Sciences and East West Centre, Honolulu.
[8] Kesterton, A.J., Cleland, J., Sloggett, A. et al. (2010) Insti- tutional delivery in rural India: The relative importance of accessibility and economic status. BMC Pregnancy and Childbirth, 10, 30. doi:10.1186/1471-2393-10-30
[9] Agha, S. and Carton, T.W. (2011) Determinants of insti- tutional delivery in rural Jhang, Pakistan. International Journal for Equity in Health, 10.
doi:10.1186/1475-9276-10-31
[10] Bloom, S.S., Wypij, D. and Das, G.M. (1999) Dimensions of women’s autonomy and the influence on maternal health care utilization in a north Indian city. Demography, 38, 67-78. doi:10.1353/dem.2001.0001
[11] Mishra, V. and Retherfort, R.D. (2006) The effect of an- tenatal care on professional assistance at delivery in rural India. Demographic and Health Research, 28.
http://www.measuredhs.com/pubs/pdf/WP28/WP28.pdf [12] Mishra, V. and Retherfort, R.D. (2008) The effect of an-
tenatal care on professional assistance at delivery in rural India. Population Research and Policy Review, 27, 307- 320. doi:10.1007/s11113-007-9064-3
[13] Ram, F. and Singh, A. (2006) Is antenatal care effective in improving maternal health in rural uttar pradesh? Evi-dence from a district level household survey. Journal of Biosocial Sciences, 38, 433-448.
doi:10.1017/S0021932005026453
ing Corporation, New Delhi, 207-216.
[15] Lee, S.H. (2005) Demand for immunization, parental selection, and child survival: Evidence from rural India. Review of Economics of the Household, 3, 171-197. doi:10.1007/s11150-005-0709-x
[16] Holland, P.W. (1986) Statistics and causal inference. Jour- nal of the American Statistics Association, 81, 945-960. doi:10.1080/01621459.1986.10478354
[17] Statacorp (2007) Stata statistical software: Release 10. Statacorp LP, College Station, TX.
[18] Babalola, S. and Vonrasek, C. (2005) Communication, ideation and contraceptive use in Burkina Faso: An ap- plication of the propensity score matching method. Jour- nal of Family Planning and Reproductive Health Care, 31, 207-212. doi:10.1783/1471189054484022
[19] Yanovitzky, I., Zanutto, E. and Hornik, R. (2005) Esti- mating causal effects of public health education cam- paigns using propensity score methodology. Evaluation and Program Planning, 28, 209-220.
doi:10.1016/j.evalprogplan.2005.01.004
[20] Kincaid, D.L. and Do, M. (2006) Multivariate causal attribution and cost-effectiveness of a national mass me- dia campaign in the Philippines. Journal of Health Com- municatio, 11, 69-90. doi:10.1080/10810730600974522 [21] Conniffe, D., Vanessa, G. & Philip, J.O. (2000) Evaluat-
ing state programmes: “Natural experiments” and pro- pensity scores. The Economic and Social Review, 31, 283- 308.
[22] Rosenbaum, P.R. and Rubin, D.B. (1983) The central role of the propensity score in observational studies for causal
effects. Biometrika, 70, 41-55. doi:10.1093/biomet/70.1.41
[23] Heckman, J.J., LaLonde, R.J., et al. (2000) The econom- ics and econometrics of active labor market programs. In: Ashenfelter, O. and Card, D., Eds., Handbook of Labor Economics, North Holland, Amsterdam, 1865-2097. [24] Rosenbaum, P.R. (2002) Observational studies. 2nd Edi-
tion, Springer, New York. doi:10.1007/978-1-4757-3692-2
[25] Dohoon, L. (2010) The early socioeconomic effects of teenage childbearing: A propensity score matching ap- proach. Demographic Research, 23, 697-736.
doi:10.4054/DemRes.2010.23.25
[26] Lechner, M. (2002) Some practical issues in the evalua- tion of heterogeneous labour market programmes by matching methods. Journal of the Royal Statistical Soci- ety, 165, 59-82. doi:10.1111/1467-985X.0asp2
[27] Hotchkiss, D.R., Magnani, R.J., Rous, J., et al. (1999) The effects of maternal-child health service utilization on subsequent contraceptive use in Morocco. Journal of Bio- social Science, 31, 145-165.
doi:10.1017/S0021932099001455
[28] Zerai, A. and Tsui, A.O. (2001) The relationship between prenatal care and subsequent modern contraceptive use in Bolivia, Egypt and Thailand. The African Journal of Re- productive Health, 5, 68-82. doi:10.2307/3583432 [29] United Nation (2010) The millennium development goals