Assessment of the Selective Properties and Optimization of
Mesh Size of Pelagic Trawl Codends, Used for Fishing
Mackerel (Trachurus Spp) in the Gulf of Guinea
Njomoue Pandong Achille*, Ebeku Ngomo Christopher, Tcham Leopold Department of Fisheries, Faculty of Industrial Engineering, University of Douala, Douala, Cameroon
Email: *[email protected]
Received November 22, 2012; revised February 23, 2013; accepted March 6, 2013
Copyright © 2013 Njomoue Pandong Achille et al. This is an open access article distributed under the Creative Commons Attribu-tion License, which permits unrestricted use, distribuAttribu-tion, and reproducAttribu-tion in any medium, provided the original work is properly cited.
ABSTRACT
Over the past few decades, it has become widely recognized that the management strategies of world fisheries must ensure sustainability of target species. The intervening years have seen many improvements to the concept of gear se- lectivity and methods for measuring the selectivity of fishing towed gears. Improved understanding of the principles of the selection of fish by gears has changed the list of parameters which are known to have a significant effect upon se- lection. The recent development of new mathematical models and the increased availability of powerful computers have resulted in improvements in the analysis procedures for the data produced to measure a gear’s selectivity. The catch of mackerel in the gulf of Guinea has steeply declined during the last two decades, and resource management is clearly required. Therefore, the need for evaluation of trawl codends used in this fishery and the potential improvements to their selectivity are of prime importance. In this paper, we use semi-empirical models to define selective properties of pelagic trawl codends targeting black mackerel (Trachurus spp) in the Gulf of Guinea. These properties are determined using the experimental and theoretical methods of assessing the parameters of the selectivity curve, and by plotting the curve. Selection parameters were obtained by fitting a logistic equation using a maximum likelihood method. Trawl codend selectivity is estimated for 17 internal diamond mesh sizes in the range 47 - 79 mm. Using the basic selectivity equations, we determine the needed mesh size A = 58 mm for fishing mackerel in the gulf of Guinea. This nominal mesh size gives room for nj = 0.1 catch of juveniles, which not exceeds the allowable proportion [nj] = 0.1. To provide
resource conservation, there is the need to make amendments in the fishery regulations for more rational exploitation of mackerel stoks, because the currently use nominal mesh size A = 56 mm is rather unselective.
Keywords: Codend Selectivity; Mesh Size; Gulf of Guinea; Selectivity Models
1. Introduction
Trawling constitutes the principal fishing method of most Gulf of Guinea countries in general and Cameroon in particular. Some of the pelagic fish populations in the region have been heavily exploited and fishing effort may be above optimum levels for many species. One of the main target specie in Gulf of Guinea is black mack- erel (Trachurus spp) [1]. However, in recent years a con- stant drop in catch has been observed due to a high in- tensity of trawl fishing. Consequently, the question of conserving the stocks of this species which constitutes a main source of food for most of the population of Gulf of Guinea countries is being put forward [2]. Such a ques-
tion is often resolved in industrial fishing by way of a rational exploitation of fishable stocks. Rational exploi- tation has been examined by most scientists amongst who is R. J. H. Beverton, S. J. Holt, F. I. Baranov, M. Broadhurst, K. Matsushita, A. I. Trechev, V. N. Mel- nikov, A. V. Melnikov, D. A. Wileman, et al. Presently, different methods of regulating fishing are applicable: preventing, limiting and prohibiting methods. Technical regulations have been introduced in almost all developed fisheries worldwide during the last 30 years. The main objective of these regulations has been to improve the state of the fishery or the stocks within by allowing juve- niles and young individuals to escape [3]. Much studies related to the selective properties of trawl codends have been carried out, until now, they are still being improved
[4,5]. The selective properties of net codends are charac- terized by the selectivity curve S(l) and its parame- ters—selectivity coefficient, selectivity range and the fraction of fish not subject to the selective action of the net [6]. In practice, different methods for studying the selective properties of trawl codends are used (covered codend method, alternate or parallel haul method, meth- ods using special selective devices, etc.). The laborious- ness of experimental studies on the selective properties of net codends as well as the difficulties linked with ex- plaining the results make their use somehow difficult. The problem in using the covered codend method for example is that the cover might affect the fish escape process and hence bias results [7]. As a consequence of the complexity of the process of fish selection, theoreti- cal research gives orientational assessment of the selec- tive properties of net codends, while experimental, which are costly, are of partial character and do not explain many features of the selective action of trawl codends and, most important, it does not permit to establish well, exact and promising qualitative methods of regulating such properties [8].
In this work, the determination of the selective proper- ties of trawl codends is based on the use of semiem- pirical models to evaluate the selectivity curve. These models facilitate a qualitative assessment of the character and degree of influence on the selectivity of the size- composition of the target fish shoal, the biometric char- acteristics of the fish morphology, deformation of the meshes, quantity of the catch etc. [9].
The process of removing fish from a water reservoir is selective and much attention is given to the regulation of fishing gear selectivity. Selectivity is estimated from the part of the gear where most fish escape. Recent research has shown that the selectivity of trawl fishing gears is highly dependent upon the mesh size from the codend [10]. Observations made by divers and towed underwater vehicles certainly show that large amounts of fish do escape in the codend and for most species this is where the main mesh selection is thought to occur [11]. Intro- duction of mesh regulations to reduce the catch of under- sized target species constitutes a long-accepted manage- ment technique. Currently, the selectivity of a pelagic trawl is mainly regulated by the mesh size at the codend, reason for which the required selectivity of trawl codends is enhanced first of all, by choosing their mesh size. By way of varying the mesh size at the trawl codend, at- tempts are being made to regulate the size-composition of fish in the catch and control the degree of exploiting fish of different age groups, and consequently, formulate the most optimal size-age composition of the fish popu- lation remaining in the water-mass or reservoir [12].
Some methods employed to determine the mesh-size of net codends are known:
The experimental methods are of partial character, la-
borious, do not give the generalities well [13,14]. Meth- ods that use mesh size at the net codend equal to 60% - 80% of gillnet mesh size [15,16] give conflicting results because the working conditions and the characteristics of the gillnetting material and the codend netting are dif- ferent. Instead, the methods using fish entanglement at the netting as a condition taking into consideration the biometric characteristics of the fish morphology to justify the mesh size are more justifiable [17]. However, they do not take into consideration the size composition of the targeted shoal, the indicators that regulate fishing, the varying fishing conditions etc. It is difficult to determine the mesh size alongside the coefficient of the allowable fishing mortality using the Baranov-Beverton-Holt equa- tion and their modifications because of the difficulties associated with using the equation [18,19]. Methods based on determining the loss and gain in the transition from one mesh size to another [20] use not theoretical data in the calculations but statistical material, thus in- creasing the exactness of the results, though limiting its domain of use.
Considering the above mentioned shortcomings, this work takes into consideration the method that uses the basic selectivity equations [21] to determine the mesh size at trawl codends when fishing Atlantic black mack- erel. Such equations without assumptions, link among themselves the size-composition of the target shoal of fish, the selectivity curves of the codend netting with mesh size, mature fish size, catch of juveniles, escape- ment of fish via the mesh. This means is more universal, exact, sticks with all other ways of determination of mesh size and can be associated to them.
Most of the countries of the Gulf of Guinea are less developed. They do not possess enough means to carry out laborious and costly experimental works to study the selective properties and the selectivity of trawl codends as a whole, and based on this reason, the selected meth- ods are the most applicable in these countries.
2. Materials and Methods
Following semi-empirical models where used to assess the selectivity curve and its parameters. Selectivity gives where generated using the logistic function fitted to plots of the probability of capture against size.
1
2.2 1 exp
S l
K A l D (1) 0.1 1 1 (1 ) 2 1 m cor
HC m cor
20.2 1 1 cor m com K D A K K
(3)
where S(l) is the function of the selectivity curve, K isthe selectivity coefficient, D is the selectivity range, A is the internal mesh size and α is the proportion of fish not af- fected by the selective effect of the mesh. Qh is the catch
in tons per a tow of one hour duration. Km is the coeffi-
cient of the body of the fish, Kcom is the coefficient that
takes into consideration the deformation of the body of the fish as it passes through the mesh, Kcor is the coeffi-
cient that corresponds to the working shape of the mesh and the form of the mesh at the maximum cross section of fish’s body. εm is the relative work lengthening of the
mesh. l is the fish length; Amin and Amax are the mesh
sizes, which correspond to the minimum and maximum length of fish in the size composition of the targeted shoals.
The determination of the mesh size of the trawl co- dends was based on the condition that, the quantity of juveniles nj does not exceed the allowable [nj]. It is
equally important to also know the relative quantity ntof
mature fish that escape through the mesh codend. These characteristics of the selective action of trawl codends were determined using the following basic selectivity equations.
0 0 0 d d em emg l Р l l
y n
y
g l S l l
(4)
0 0 d 1 d p pg l S l l n
g l l
(5)
d 1 1 d j j t l t t t t t lg l S l l
N Y Y
n
N N
g l S l l
(6)
0 0 0 d ; d j l j jg l S l l Y
n Y
g l S l l
(7)
where Yjis the relative catch of juveniles, Yt is the rela-
tive catch of fish of mature size and Y0 is the relative
total catch (Y0= Yt + Yj). Nt is the fraction of mature fish
in the targeted shoals and nemis the fraction of fishes en-
tangled. g(l) is the function of the distribution density of the size composition of the targeted shoals, S(l) is the function of the selectivity curve of trawl codends and P(l)
represents the function of the codend entanglement ca- pacity (function of the selectivity curve of gillnets), lj is
the mature fish length and αp is the ratio of fish that die
against those that get out through the mesh.
The input data for determining the parameters and the function of the selectivity curve as well as the mesh size or dimension taking into consideration the allowable catch of juveniles are:
Coefficient of fullness of fish’s body Km;
Compression coefficient Kcom of fish’s body as it
goes out via the mesh;
Coefficient of correspondence Kсor between the
working shape of the mesh and the maximum cross- sectional area of the fish’s body;
Relative working lengthening of the mesh εm;
Catch per hour of trawling Qh;
Minimum fish size in the targeted fish shoal l min;
Maximum fish size in the targeted fish shoal l max;
Mature fish size lj;
Allowable catch of juveniles [nj];
Allowable escape of mature fish through mesh of the trawl codend [nt];
Seventeen internal mesh sizes whose selectivity curves cover the range of the size composition of fish in the targeted shoal;
Variation series characterizing the size composition of the targeted shoal.
The value of the mature fish size lj and the allowable
catch of juveniles [nj] are contained in the laws regulat-
ing fishing in the Gulf of Guinea [22].
The experimental fishing for the trawl codend selec- tivity was carried out on board the fishing trawler “Kelly Danielle” owned by the fishing company “Diamond Fish” from 2010 to 2011 in the Gulf of Guinea area with- in the territorial waters of Cameroon, Nigeria, Equatorial Gui- nea, Sao Tome and Principe and Gabon.
Experimental and statistical materials were obtained using the standard method [23]. The trawl codends were made from polyamide of different mesh sizes.
The input data used to determine the mesh size of the trawl codend were:
Material for the trawl codend—Polyamide, 3.1 mm double twine;
Trawling speed υтр = 2.5 м/s;
Tow duration—1 hour;
Average catch per one tow Qh = 2 tons;
Allowable mature fish size by the legislation lj =
220 мм;
Allowable catch of juveniles [nj] = 0.1;
Allowable quantity of fish of mature size, that es- cape via the mesh [nt] = 0.30.
The initial data for the calculated size composition was given in the form of a variation series and inserted in
Taking into consideration the input data, the calculated parameters were determined and inserted in Table 2.
3. Results
For each variant of 17 mesh sizes, we obtained the pa- rameters of the selective curve: The quantity α of fishnot affected by the selective action of the mesh, the selec- tiveity coefficient K and the selectivity range D (Table 3). Results on catch parameters Y0, Yj, Yt, Yem, are given in
Table 4 and the catch indicators nj, nt, nem and np, in Ta- ble 5.
Value of ordinates of selectivity curves for 13 fish sizes are given in Table 6.
4. Discussion
In this work, we use empirical models to define selec- tive properties of a large range of diamond mesh codends of varying mesh sizes. In particular, the selective
proper-Table 1. Size composition of Mackerel.
li (mm) 200 210 220 230 240 250 260 270 280 290 300 310 320 Σmi
mi 4 12 20 51 38 29 15 12 7 4 2 0 4 198
[image:4.595.62.527.228.260.2]li = fish size, mi = number of fishes.
Table 2. Calculated parameters.
Km Kcom Kcor εm Qh lj lmin lmax [nj] [nt] Amin Amax ΔA
0.5 0.93 0.74 0.24 2 220 200 320 0.1 0.3 45 80 2
Km = coefficient of fullness of fish’s body, Kcom = compression coefficient of fish’s body as it goes out via the mesh, Kсor = coefficient of correspondence be-
tween the working shape of the mesh and the maximum cross-sectional area of the fish’s body, εm = relative working lengthening of the mesh, Qh = catch in
tons per hour of trawling, lj = mature fish size, lmin = minimum fish size in the targeted fish shoal, lmax = maximum fish size in the targeted fish shoal, [nj] =
allowable catch of juveniles, [nt] = allowable escape of mature fish through mesh of the trawl codend, Aùin = minimum mesh size, Aùax = maximum mesh size, ΔA = step size.
Таble 3. Selectivity curve parameters α, K and D by mesh sizes (A1 to A17).
Parameter Mesh size
α K D
A1 47 0.811 2.497 195.5
A2 49 0.669 3.452 116.4
A3 51 0.562 3.91 91.58
A4 53 0.481 3.761 80.44
A5 55 0.421 3.995 74.77
A6 57 0.376 4.048 71.86
A7 59 0.342 4.083 70.53
A8 61 0.316 4.107 70.19
A9 63 0.297 4.123 70.51
A10 65 0.282 4.135 71.28
A11 67 0.271 4.144 72.38
A12 69 0.263 4.151 73.71
A13 71 0.257 4.155 75.22
A14 73 0.253 4.159 76.87
A15 75 0.249 4.161 78.61
A16 77 0.247 4.163 80.43
A17 79 0.245 4.165 82.3
[image:4.595.61.536.407.725.2]Таble 4. Catch parameters Y0, Yj, Yt and Yem by mesh sizes (A1 to A17).
Parameter Mesh size
Y0 Yj Yt Yem
A1 47 9.427 1.154 8.273 0.031
A2 49 9.119 1.09 8.028 0.019
A3 51 8.755 1.013 7.742 0.012
A4 53 8.305 0.924 7.382 0.008
A5 55 7.776 0.829 6.947 0.005
A6 57 7.193 0.736 6.457 0.003
A7 59 6.593 0.653 5.94 0.002
A8 61 6.01 0.582 5.428 0.002
A9 63 5.47 0.523 4.946 0.001
A10 65 4.987 0.477 4.51 0.001
A11 67 4.567 0.440 4.127 0.001
A12 69 4.209 0.411 3.798 0.000
A13 71 3.908 0.388 3.52 0.000
A14 73 3.658 0.371 3.287 0.000
A15 75 3.45 0.357 3.094 0.000
A16 77 3.279 0.345 2.933 0.000
A17 79 3.138 0.337 2.801 0.000
Y0= relative total catch (Y0 = Yt + Yj), Yj = relative catch of juveniles, Yt = relative catch of fish of mature size, Yem= relative quantity of entangled fishes.
Таble 5. Catch indicators nj, nt, nem and np by mesh sizes (A1 to A17).
Indicator Mesh size
nj nt np nem
A1 47 0.122 0.036 -0.010 0.003
A2 49 0.120 0.065 -0.006 0.002
A3 51 0.116 0.098 -0.002 0.001
A4 53 0.111 0.140 0.003 0.001
A5 55 0.107 0.191 0.009 0.001
A6 57 0.102 0.248 0.016 0.000
A7 59 0.099 0.308 0.023 0.000
A8 61 0.097 0.368 0.03 0.000
A9 63 0.096 0.424 0.036 0.000
A10 65 0.096 0.475 0.042 0.000
A11 67 0.096 0.519 0.047 0.000
A12 69 0.098 0.558 0.051 0.000
A13 71 0.099 0.59 0.054 0.000
A14 73 0.101 0.617 0.057 0.000
A15 75 0.103 0.640 0.060 0.000
A16 77 0.105 0.658 0.062 0.000
A17 79 0.107 0.674 0.063 0.000
Таble 6. Value of ordinates of the selectivity curve by mesh size.
Sm(l) Mesh
Size (mm) 200 210 220 230 240 250 260 270 280 290 300 310 320
A1 47 0.946 0.951 0.955 0.958 0.962 0.965 0.968 0.971 0.974 0.976 0.979 0.981 0.982
A2 49 0.881 0.895 0.908 0.920 0.931 0.941 0.950 0.957 0.964 0.969 0.974 0.978 0.982
A3 51 0.802 0.828 0.852 0.875 0.895 0.913 0.929 0.942 0.953 0.962 0.970 0.976 0.981
A4 53 0.715 0.750 0.786 0.819 0.850 0.877 0.901 0.921 0.938 0.951 0.962 0.971 0.977
A5 55 0.629 0.669 0.712 0.754 0.794 0.832 0.864 0.893 0.916 0.935 0.950 0.962 0.971
A6 57 0.551 0.592 0.637 0.684 0.732 0.777 0.819 0.856 0.887 0.913 0.933 0.949 0.962
A7 59 0.485 0.524 0.567 0.616 0.666 0.717 0.766 0.811 0.85 0.883 0.910 0.932 0.949
A8 61 0.433 0.466 0.506 0.552 0.602 0.655 0.709 0.759 0.806 0.846 0.880 0.908 0.930
A9 63 0.391 0.420 0.455 0.496 0.543 0.595 0.650 0.704 0.756 0.803 0.844 0.879 0.907
A10 65 0.359 0.383 0.413 0.449 0.491 0.540 0.593 0.648 0.703 0.755 0.802 0.843 0.877
A11 67 0.334 0.354 0.379 0.410 0.447 0.491 0.540 0.594 0.649 0.703 0.755 0.802 0.842
A12 69 0.315 0.332 0.353 0.379 0.411 0.449 0.494 0.543 0.597 0.651 0.705 0.756 0.802
A13 71 0.301 0.314 0.332 0.354 0.381 0.414 0.453 0.498 0.548 0.601 0.656 0.709 0.758
A14 73 0.289 0.301 0.315 0.334 0.357 0.385 0.419 0.459 0.505 0.554 0.607 0.660 0.712
A15 75 0.280 0.290 0.302 0.318 0.337 0.361 0.391 0.426 0.466 0.512 0.562 0.613 0.666
A16 77 0.273 0.281 0.292 0.305 0.321 0.342 0.367 0.398 0.433 0.474 0.520 0.569 0.620
A17 79 0.268 0.275 0.283 0.295 0.309 0.326 0.348 0.374 0.405 0.441 0.483 0.528 0.577
ties of codends with mesh sizes in the range 47 - 79 mm and made from double braided PA twines of 3.1 mm thicknesses.
Many factors influence the selective properties of trawl codends. These could be biological or biometric, physic-technical, technical and exploitation [24]. In this work, we just need to examine the influence of the mesh- size which is an easily modifiable technical factor, and which, according to many papers presented on this sub- ject-matter, has the most significant influence on the se- lective properties of trawl codends [25]. In fact, increas- ing the mesh size causes a displacement of the curve to-
ward the right (Figure 1). Figure 1. Family of selectivity curves for 17 mesh sizes (49 mm to A17= 79 mm) when fishing Mackerel with pelagic A1 = trawls in the Gulf of Guinea.
Likewise, the mesh size also influences the selective parameters K, D and α.
curve S(l). The relationship between the mesh size A and the selectivity coefficient K is shown in Figure 3. The selectivity coefficient K rapidly increases as the mesh- size A increases until it attains a critical value (around K
= 4), then it becomes practically constant. This mode of variation depends on the character of the influence of α
on K. When the quantity of the capture inside the codend is low, the selectivity coefficient K does not depend upon the mesh size. The selectivity range D, tends toward in finity for a mesh size that tends to retain or allow all the For a mesh size of 47 mm, α approches 1 (0.811) and
all fish caught is retained at the codend, while a mesh- size of 79 mm, causes the value of α to get toward 0 (0.245), and all the catch might escape from the codend. The relationship between the mesh size A and the pa- rameter α is complex, and tends to take an exponential shape Figure 2.It depends more on the concrete values ofα. The increase in catch will result to the decrease of α
[image:6.595.56.540.104.489.2]Figure 2. Relationship between the mesh size A and the parameter α.
Figure 3. Relationship between the mesh size A and the selectivity coefficient K.
fish to escape (A = 79 mm; A = 47 mm), while the values of D corresponding to intermediary mesh-sizes are mini- mal as presented in Figure 4.
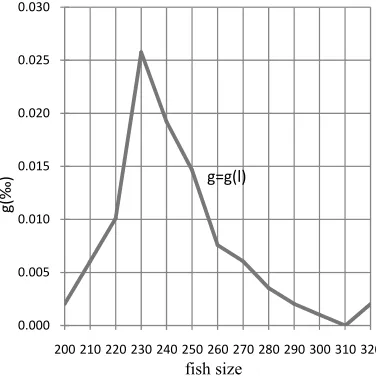
[image:7.595.346.502.84.255.2]The corresponding mesh-size for a variation in α close to 1 or to 0 also depends on the quality of the catch and on the size-composition of the target shoal g(l) as repre- sented in Figure 5. Furthermore, by using the basic se- lectivity equations for trawl codends, we have been able to provide the mesh size at the codend when fishing Mackerel in the Gulf of Guinea. Without assumptions, such curves are link the size-composition of the targeted shoal, the selectivity curve of a codend with a determined mesh size, mature fish size, catch of juveniles and the quantity of fish which escape from the codend. By using the basic selectivity equations, it is possible to determine mesh-size for different limitations in fishing. By solving the equation for different mesh sizes, it is also possible to draw the graphs nj = f1(A), nt = f2(A), nem = f3(A) and np
Figure 4. Relationship between the mesh size A and the selectivity range D.
0.000 0.005 0.010 0.015 0.020 0.025 0.030
200 210 220 230 240 250 260 270 280 290 300 310 320 fish size
g=g(l)
g(‰)
Figure 5. Density of size distribution of targeted shoals curve (‰).
= f4(A).
In this work, such a justification is observed when the quantity of juveniles is limited as when as control is car- ried out for juveniles escaping via the meshes.
Using the data from the tables, we plotted graphs of functionsnj = f1(A) and nt = f2(A) in one coordinate axes.
By the curve nj = f1(A) and the given allowable catch of
juveniles [nj] = 0.1, we determine the needed mesh size А
= 58 mm (Figure 6).
For this mesh size A = 58 mm, nj = [nj] = 10% and nt =
28%.
The escaping of mature fish at this mesh size was 0.28 and did not exceed the allowable [nt] = 0.3, while the
estimated catch of juveniles [nj] = 0.1.
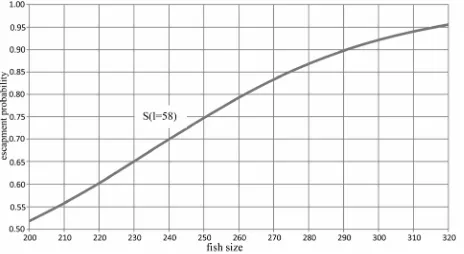
The selectivity curve corresponding to the optimal mesh size А = 58 mm, is shown in Figure 7.
[image:7.595.328.516.294.482.2] [image:7.595.88.259.313.477.2]Figure 6. Dependence of selectivity indicators for catching Mackerel in the Gulf of Guinea with pelagic trawls on the mesh size of trawl codend.
Figure 7. Selectivity curve corresponding of the optimal mesh size A = 58 mm.
The above used models (4-7) are linked between themselves by the regulatory indicators (lj, nj и A), the
control indicator (nt) with the composition of the targeted
shoal and the selectivity curve for the trawl codend. They do not contain assumptions and their exactness depends only on the exactitude of the initial data. The presented models will provide a better under standing of the selec-tion process, permit a more targeted approach to codends selectivity experiments, and assist fishery managers to assess the impact of proposed technical measures that are introduced to reduce the catch of undersized fish. Cur-rently, fishing regulations have adopted a mesh size of A
= 56 mm as the standard for codends of pelagic trawl gears fishing mackerel in the Gulf of Guinea [22]. This mesh size does not enhance the conservation of stocks of this specie because it gives room for a catch of juveniles
nj = 0.11 which exceeds the allowable [nj] = 0.10,
al-though it facilitates the escape of nt = 0.22 of mature fish,
which is less than the allowable [nt] = 0.3. There is
therefore the need to make amendments in the fishery regulations in the Gulf of Guinea for more rational ex-ploitation of mackerel stocks.
5. Acknowledgements
We are grateful to the ‘‘DIAMOND FISH’’ Company for permitting us carry out the experimental work on-
board the fishing trawler “Kelly Danielle”.
REFERENCES
[1] FAO, “The State of World Fisheries and Aquaculture,” FAO Fisheries and Aquaculture Department, Rome, 2009. [2] P. N. Meke, “The Sustainable Management of the Marine
Fish Resources in Cameroon: A Bioeconomic Analysis of the Trawl Fishery,” Ph.D. Thesis, University of Douala, Douala, 2012.
[3] M. K. Broadhurst, R. B. Millar, S. J. Kennelly, W. G. Macbeth, D. J. Young and C. A. Gray, “Selectivity of Conventional Diamond and Novel Square Mesh Codends in an Australian Estuarine Peneid Trawl Fishery,” Fish-eries Research, Vol. 67, No. 2, 2004, pp. 183-194.
doi:10.1016/j.fishres.2003.09.043
[4] R. B. Millar and R. J. Fryer, “Estimating the Size Sele- ction Curves of Towed Gears, Traps, Nets, and Hooks,” Review in Fish Biologyand Fishery, Vol.9, No. 1, 1999, pp. 89-116.doi:10.1023/A:1008838220001
[5] C. Kvamme and B. Isaksen, “Total Selectivity of a Co- mmercial Cod Trawl with and without a Grid Mounted and Codend Selectivity of North-East Artic Cod,” Fish-eries Research,Vol. 68, No. 1-3, 2004, pp. 305-318.
doi:10.1016/j.fishres.2003.11.011
[6] A. V. Melnikov and V. N. Melnikov, “Fishery Selectiv-ity,” ASTU, Astrakhan, 2005.
[7] P. G. He, “Selectivity of Large Mesh Trawl Codends in the Gulf of Maine: I Comparison of Square and Diamond Mesh,” Fisheries Research, Vol. 83, No. 1, 2007, pp. 44- 59.doi:10.1016/j.fishres.2006.08.019
[8] A. P. Njomoue, “Improvement of Pelagic Trawl Fishing in the Gulf of Guinea,” Ph.D. Thesis, VNIRO, Moscow, 2002.
[9] A. V. Melnikov, “Calculation-Experimental Research Methods on Selective Properties and Justification of Me- sh Size on the Concentrating Parts of Entangling Fishing Gears,” Research on the Industrial Fishing Techniques, Collection of VNIRO Scientific Papers, 1983.
[10] R. P. Frandsen, N. Madsen and L. A. Krag, “Selectivity and Escapement of Five Commercial Fishery Species in Standard Square and Diamond-Mesh Codends,” ICES Journal of Marine Science, Vol. 67, No. 8, 2010, pp. 1721-1731.doi:10.1093/icesjms/fsq050
[11] F. G. O’Neill and R. J. Kynoch, “The Effect of Cover Mesh Size and Codend Catch Size on Codend Selecti- vity,” Fisheries Research, Vol. 28, No. 3, 1996, pp. 291- 303.doi:10.1016/0165-7836(96)00501-2
[12] A. I. Chevchenko, “Rational Trawl Fishing Technology of Pollock,” Food Indutry, Moscow, 2004.
[13] D. A. Wileman, R. S. T. Ferro, R. Fonteyne and R. B. Millar, “Manuel of Methods of Measuring the Selectivity of Towed Gear,” ICES Cooperative Research Report, Vol. 215, 1996, p. 126.
[14] A. I. Treshev, “Scientific Basis of Fishery Selectivity,” Food Industry, Moscow, 1974.
[image:8.595.58.290.258.385.2]1998.
[16] F. L. Baranov, “Rational Fishing,” Fisheries, No. 11, 1962, pp. 9-12.
[17] A. L. Fridman, “Theory and Projection of Fishing Gears,” 2nd Edition, Food Industry, Мoscow, 1981.
[18] Y. Matsushita, Y. Inoue, A. I. Shevchenko and Y. G. Norinov, “Selectivity in the Codend and in the Main Body of the Trawl,” ICES Journal of Marine Science, Vol. 196, 1993, pp. 170-177.
[19] R. J. H. Beverton and S. J. Holt, “On the Dynamics of Exploited Fish Populations,” Chapman and Hall, London, 1957.
[20] R. D. Galbraith, R. J. Fryer and K. M. S. Maitland, “De- mersal Pair Trawls Codend Selectivity Models,” Fisher-ies Research, Vol. 20, No. 1, 1994, pp. 13-27.
doi:10.1016/0165-7836(94)90003-5
[21] A. V. Melnikov, “Determination of the Parameters of the Selectivity Curve Using Semi-Empirical Formulas,” Сo- llection of VNIRO Scientific Papers, 1985.
[22] CECAF/XIX, “Global Emerging Issues in Fisheries De-velopment and Management Relevant to the Region,” Cotonou, 2008.
[23] A. I. Treshev, C. F. Efanov, T. N. Stepanovich, et al. “Guidelines for the Collection of Data on the Selectivity of Trawls and Traumatic Death of Fish That Have Passed through the Mesh of the Trawl Codend,” VNIRO, Mos-cow, 1983.
[24] F. G. O’Neill and B. Hermann “А Predictive Model of Codend Selectivity—A Tool for Fishery Managers,” ICES Journal of Marine Science, Vol. 64, 2007, pp. 1558-1568. http://icesjms.oxfordjournals.org/content/64/8/1558.full.p df