http://wrap.warwick.ac.uk
Original citation:
Pappas, George, Ferrari, Stefania, Huang, Xiaobin, Bhagat, Rohit, Haddleton, David M.
and Wan, Chaoying. (2016) Heteroatom doped-carbon nanospheres as anodes in
lithium ion batteries. Materials, 9 (1). 35.
Permanent WRAP url:
http://wrap.warwick.ac.uk/76192
Copyright and reuse:
The Warwick Research Archive Portal (WRAP) makes this work of researchers of the
University of Warwick available open access under the following conditions.
This article is made available under the Creative Commons Attribution 4.0 International
license (CC BY 4.0) and may be reused according to the conditions of the license. For
more details see: http://creativecommons.org/licenses/by/4.0/
A note on versions:
The version presented in WRAP is the published version, or, version of record, and may
be cited as it appears here.
materials
Article
Heteroatom Doped-Carbon Nanospheres as Anodes
in Lithium Ion Batteries
George S. Pappas1,†, Stefania Ferrari1,*,†, Xiaobin Huang2, Rohit Bhagat1, David M. Haddleton3and Chaoying Wan1,*
Received: 30 November 2015; Accepted: 4 January 2016; Published: 9 January 2016 Academic Editor: Federico Bella
1 Warwick Manufacturing Group, University of Warwick, Coventry CV4 7AL, UK;
g.pappas@warwick.ac.uk (G.S.P.); r.bhagat@warwick.ac.uk (R.B.)
2 School of Aeronautics and Astronautics, Shanghai Jiao Tong University, Shanghai 200240, China; xbhuang@sjtu.edu.cn
3 Department of Chemistry, University of Warwick, Coventry CV4 7AL, UK; d.m.haddleton@warwick.ac.uk
* Correspondence: S.Ferrari@warwick.ac.uk (S.F.); chaoying.wan@warwick.ac.uk (C.W.); Tel.: +44-24-7657-5834 (S.F.); +44-24-7657-4038 (C.W.)
† These authors contributed equally to this work.
Abstract:Long cycle performance is a crucial requirement in energy storage devices. New formulations and/or improvement of “conventional” materials have been investigated in order to achieve this target. Here we explore the performance of a novel type of carbon nanospheres (CNSs) with three heteroatom co-doped (nitrogen, phosphorous and sulfur) and high specific surface area as anode materials for lithium ion batteries. The CNSs were obtained from carbonization of highly-crosslinked organo (phosphazene) nanospheres (OPZs) of 300 nm diameter. The OPZs were synthesized via a single and facile step of polycondensation reaction between hexachlorocyclotriphosphazene (HCCP)
and 4,41-sulphonyldiphenol (BPS). The X-ray Photoelectron Spectroscopy (XPS) analysis showed
a high heteroatom-doping content in the structure of CNSs while the textural evaluation from the
N2sorption isotherms revealed the presence of micro- and mesopores and a high specific surface
area of 875 m2/g. The CNSs anode showed remarkable stability and coulombic efficiency in a long
charge–discharge cycling up to 1000 cycles at 1C rate, delivering about 130 mA¨h¨g´1. This study
represents a step toward smart engineering of inexpensive materials with practical applications for energy devices.
Keywords:carbon nanospheres; lithium batteries; organo phosphazene
1. Introduction
Scientific and industrial research in rechargeable batteries has been extended beyond the “conventional”lithium-ion batteries (LIBs) technology, driven by the ongoing development of high
power demanding applications and tools [1]. Li-Air and Li-Sulfur (Li-S), having theoretical energy
densities a few orders of magnitude larger than Li-ion commercial batteries, are the two major
technologies predicted to move forward towards the realization of advanced batteries [1,2]. In the
meantime, graphite-based LIBs still hold a prominent position since graphite is the only material to combine low cost, performance and easy processability—three factors which are crucial for industrial production and realization in true applications. The development and commercialization of advanced
anode materials (silicon, transition metal oxides, various alloys,etc.) for Li-ion batteries is at the core
of today’s efforts [3]. These materials have larger theoretical capacity than graphite (372 mA¨h¨g´1)
but suffer mainly from low electrical conductivity and large volume expansion which lead to poor cycling performance.
Carbon (nano) spheres (C(N)Ss) have also been studied as active materials in various energy
storage and conversion applications such as supercapacitors [4,5], hydrogen storage cells [6],
catalysis [7,8] and lithium ion batteries [9,10]. In LIBs, Li-alloy-core-carbon-shell structures have
been increasingly reported as composite anode materials, since the carbon layer can limit the issues of the alloy anodes mentioned above. Nevertheless, bare CSs (with or without heteroatom doping)
have also attracted some interest in this field as an alternative anode to graphite. Wanget al., prepared
dense nitrogen-doped CNSs by carbonization of polypyrrole nanospheres. The CNSs, with diameters
between 60 and 70 nm and specific area 59 m2¨g´1, delivered a reversible capacity of 380 mA¨h¨g´1at
a current density of 60 mA¨g´1after 60 cycles and showed good high-rate performance delivering
200 mA¨h¨g´1at 3 A¨g´1[11]. Xiaoet al., synthesized hydrogenated CNSs by a low temperature
solvothermal method using CHCl3 as carbon source. Compared to Wang’s work, the obtained
nanospheres had similar textural characteristics (particle size and specific area) and semi-graphitized
structure but higher electrochemical performance (978 mA¨h¨g´1@50 mA¨g´1after 50 cycles) which
was attributed to the high hydrogen-doping favoring the Li binding [12].
In order to increase the storage capacity and shorten the pathway length of Li ion diffusion,
many groups have explored more sophisticated structures such as hierarchically porous [13,14] and
hollow [15,16] carbon spheres. Recently, porous CNSs with single or double hollow architecture
were prepared via a hard template method followed by carbonization and subsequent etching
of the inorganic template. Compared to the single hollow nanospheres, the double shelled
nanospheres showed improved cycling and rate performance ascribed to their unique hollow-in-hollow
structure [17]. An unfavorable consequence of these engineered CSs (besides the multistep synthesis)
is the high irreversible capacity loss at the first cycle. The increased reactivity due to the high surface area usually causes the fast decomposition of the electrolyte and a thick solid-electrolyte interface (SEI)
layer formation [18]. Zhanget al., prepared double shelled CNSs doped with nitrogen and showed
their better electrochemical performance than the un-doped nanospheres when tested both in lithium
ion and sodium ion cells [19]. It is obvious that not only the control over the textural structure but
also the substitution of carbon by heteroatoms has a significantly positive effect in the performance of carbon materials in LIBs.
The synthetic methods for the formation of spherical particles, organic, inorganic or hybrid, relies on the chemical nature of the precursors and the desirable structure and properties of the final
material which subsequently define the reaction conditions [20]. The one-step synthesis of highly
cross-linked hybrid organo(cyclotriphosphazenes) (OPZs) is an excellent and highly efficient method to prepare various nanostructured materials such as nanospheres, nanotubes, core-shell and hollow particles. This method was first reported by Tang and Huang for the synthesis of OPZ nanotubes and microspheres and since then it has been extensively studied and applied to various materials
applications [21,22]. Briefly, the OPZs formation proceeds through a polycondensation reaction
between the hexachlorocyclotriphosphazene monomer and a co-monomer (cross-linker) with two -OH
or -NH2groups, in the presence of triethylamine (TEA). Control over the size and morphology can
easily be achieved by varying the concentration and ratio of the monomers, the chemical structure of
the co-monomer, the type of the solvent and sonication power [23,24]. The as-prepared OPZs have a
hybrid organic–inorganic structure which, after carbonization under inert atmosphere, can provide
heteroatom doped-carbons [25]. The ambient conditions, the fast rate of reaction and the low cost are
the main advantages of this synthetic method.
Materials2016,9, 35 3 of 13
2. Results and Discussion
OPZs were successfully prepared by a single step polycondensation reaction of HCCP and BPS in acetonitrile under ultrasonication at ambient conditions. TEA was added to initiate the reaction which is characterized by a fast rate with completion within seconds. The HCCP/co-monomer ratio
and HCCP concentration are two important factors controlling the size of the OPZ particles [26]. Here,
a 3.5:1 BPS to HCCP molar ratio was selected while the HCCP concentration was 2.25 mg/mL. The resulting nanospheres have relatively narrow size dispersity with diameters ~330 nm and a relatively
smooth surface (Figure1a). The presence of some smaller nanospheres <170 nm is unavoidable but
can be minimized by carefully positioning the flask in the sonicator in order that the sonication power is evenly distributed in the solution. The EDS (Electron Dispersive Spectroscopy) spectrum showed the presence of P, N, S, C, O and some remaining Cl originating from unreacted P-Cl sites of the HCCP
ring (Figure1b).
Materials 2016, 9, 35 3 of 12
and HCCP concentration are two important factors controlling the size of the OPZ particles [26].
Here, a 3.5:1 BPS to HCCP molar ratio was selected while the HCCP concentration was 2.25 mg/mL.
The resulting nanospheres have relatively narrow size dispersity with diameters ~330 nm and a
relatively smooth surface (Figure 1a). The presence of some smaller nanospheres <170 nm is
unavoidable but can be minimized by carefully positioning the flask in the sonicator in order that the
sonication power is evenly distributed in the solution. The EDS (Electron Dispersive Spectroscopy)
spectrum showed the presence of P, N, S, C, O and some remaining Cl originating from unreacted
P‐Cl sites of the HCCP ring (Figure 1b).
CNSs were obtained by carbonization of the as‐prepared OPZs at 850 °C. The structure of the
particles remained intact while an overall decrease in diameter is observed due to the weight loss and
shrinkage during carbonization at high temperature (Figure 1c). From the EDS analysis (Figure 1d) it
is evident that the derived carbon nanospheres are co‐doped with N, P and S, showing the advantage
of this method to produce carbons doped with multiple heteroatoms in one‐pot synthesis. It is worth
mentioning that the doping of carbon materials with multiple heteroatoms is desirable for energy
storage applications since the presence of heteroatoms not only affects the textural characteristics but
also alters the electronic properties of the carbon matrix [27]. The weight loss percentage between 120
and 850 °C calculated from the TGA curve is 56 wt% and two decomposition steps at Tonset = 478 °C
and Tonset = 802 °C were observed (Figure S1). The first weight loss is attributed to the decomposition
of the cross‐linked HCCP/BPS structure and its initial conversion to an amorphous/low graphitized
carbon structure. At higher temperature the transformation of amorphous to graphitic structure
continued simultaneously with some heteroatom removal from the structure.
Figure 1. (a) SEM image of the organo (phosphazene) (OPZ) nanospheres (×50k magnification);
(b) electron dispersive spectroscopy analysis (EDS) spectra of the OPZ nanospheres; (c) SEM image
of the carbon nanospheres (CNSs) after carbonization at 850 °C (×100k magnification); (d) EDS spectra
of the CNSs.
The chemical structure of the cross‐linked OPZs was characterized by Attenuated Total
[image:4.595.106.490.267.577.2]Reflectance‐Infrared Spectroscopy (ATR‐IS) (Figure S2). The arrows indicate the major vibrational Figure 1. (a) SEM image of the organo (phosphazene) (OPZ) nanospheres (ˆ50 k magnification); (b) electron dispersive spectroscopy analysis (EDS) spectra of the OPZ nanospheres; (c) SEM image of the carbon nanospheres (CNSs) after carbonization at 850˝C (ˆ100 k magnification); (d) EDS spectra of the CNSs.
CNSs were obtained by carbonization of the as-prepared OPZs at 850˝C. The structure of the
particles remained intact while an overall decrease in diameter is observed due to the weight loss and
shrinkage during carbonization at high temperature (Figure1c). From the EDS analysis (Figure1d) it
is evident that the derived carbon nanospheres are co-doped with N, P and S, showing the advantage of this method to produce carbons doped with multiple heteroatoms in one-pot synthesis. It is worth mentioning that the doping of carbon materials with multiple heteroatoms is desirable for energy storage applications since the presence of heteroatoms not only affects the textural characteristics but
and 850˝C calculated from the TGA curve is 56 wt % and two decomposition steps at T
onset= 478˝C
and Tonset= 802˝C were observed (Figure S1). The first weight loss is attributed to the decomposition
of the cross-linked HCCP/BPS structure and its initial conversion to an amorphous/low graphitized carbon structure. At higher temperature the transformation of amorphous to graphitic structure continued simultaneously with some heteroatom removal from the structure.
The chemical structure of the cross-linked OPZs was characterized by ATR-FTIR (Attenuated Total Reflectance Fourier Transform Infrared Spectroscopy) (Figure S2). The arrows indicate the
major vibrational peaks attributed to the substituted phosphazene ring and the 4,41-sulfonyl diphenol
while, the peak at 935 cm´1is assigned to the P-O-C
(aromatic)asymmetric stretch vibration indicating the successful reaction of the phenolic hydroxyls with the reactive P-Cl from the HCCP ring. Complementary to infrared spectra the Raman spectra of the OPZ nanospheres before and after
carbonization was recorded (Figure2a). The near infrared laser (785 nm) was selected to record the
spectra of OPZs since the visible laser (532 nm) produced significant fluorescence and the vibration
peaks were not visible. There are three main peaks at 730, 1154 and 1588 cm´1attributed to C-S,
O=S=O, and aromatic C-C stretching, respectively. After carbonization, the peaks arising from HCCP
and BPS are absent and the two broad peaks are observed centered at 1597 cm´1(G band) and 1347
cm´1(D band), which belong to carbonsp2andsp3electronic configurations, respectively. The ratio of
ID/IGis 0.75 which is representative for pyrolized amorphous or partially graphitized carbons (hard
carbons) and to some extent of defected turbostratic graphitic structure [28]. The results from Raman
spectroscopy are further supported by the XRD pattern of the carbon nanospheres (Figure2b). There
are two broad peaks centered at 27 and 50˝2θassigned to the (002) and (101) diffraction planes of
hexagonal carbon layers (JCPDS, No. 75-1621). Similar to the Raman results, the broadening of the peaks is due to the disordered and highly defected structure of the material.
Materials 2016, 9, 35 4 of 12
peaks attributed to the substituted phosphazene ring and the 4,4′‐sulfonyl diphenol while, the peak
at 935 cm⁻1 is assigned to the P‐O‐C(aromatic) asymmetric stretch vibration indicating the successful
reaction of the phenolic hydroxyls with the reactive P‐Cl from the HCCP ring. Complementary to
infrared spectra the Raman spectra of the OPZ nanospheres before and after carbonization was
recorded (Figure 2a). The near infrared laser (785 nm) was selected to record the spectra of OPZs
since the visible laser (532 nm) produced significant fluorescence and the vibration peaks were not
visible. There are three main peaks at 730, 1154 and 1588 cm⁻1 attributed to C‐S, O=S=O, and aromatic
C‐C stretching, respectively. After carbonization, the peaks arising from HCCP and BPS are absent
and the two broad peaks are observed centered at 1597 cm−1 (G band) and 1347 cm−1 (D band), which
belong to carbon sp2 and sp3 electronic configurations, respectively. The ratio of ID/IG is 0.75 which is
representative for pyrolized amorphous or partially graphitized carbons (hard carbons) and to some
extent of defected turbostratic graphitic structure [28]. The results from Raman spectroscopy are
further supported by the XRD pattern of the carbon nanospheres (Figure 2b). There are two broad peaks
centered at 27 and 50° 2θ assigned to the (002) and (101) diffraction planes of hexagonal carbon layers
(JCPDS, No. 75‐1621). Similar to the Raman results, the broadening of the peaks is due to the
disordered and highly defected structure of the material.
Figure 2. (a) Raman spectra of the OPZ and the CNSs; and (b) XRD pattern of the CNSs.
The N2 adsorption isotherm of the OPZ nanospheres shows a very slow increase in N2 adsorption
up to 0.95 of the relative pressure (P/P0) where a steep increase of the adsorbed volume is observed and
capillary condensation takes place (Figure 3a). This behavior is common in non‐porous and/or
macroporous materials (<50 nm diameter). Since no pores of this scale are observed in SEM analysis,
the existence of macropores is originated from the textural void space between the nanospheres. This
result is also evident from the Barrett‐Joyner‐Halenda (BJH) pore size distribution which is very broad
up to relatively unlimited pore sizes (Figure 3b, black line). The specific surface area, calculated by the
Brunauer‐Emmett‐Teller (BET) equation in the range 0.05–0.2 P/P0, is 19 m2 g−1. After carbonization, the
CNSs showed a mixed type of isotherm curves. At low P/P0 < 0.05 a type‐I isotherm with a high initial
N2 uptake is observed which is characteristic of microporous materials. The adsorbed volume remains
constant up to 0.9 P/P0 where the filling of large pores takes place (type‐IV). The desorption‐branch
forms a H1‐type hysteresis loop which closes just below 0.8 P/P0 indicating the presence of a wide range
of mesopores. The specific surface area of CNSs is 875 m2 g−1 and was calculated by the Langmuir
equation since the BET method resulted in a negative C constant value in the range 0.05–0.35 P/P0 which
significantly demeans the true result. According to V‐t plot calculations between 0.1 and 0.2 P/P0, the
micropore area is 808 m2 g−1 and the major contributor of the total specific surface area. The pore size
distribution of the CNSs shows a wide range of mesopores and an incomplete distribution in the
micropore region (limitation of the BJH method). The high micropore surface area is a result of
“defected” carbon structure due to the presence of heteroatoms. Additionally, the presence of the small
quantity of Cl in the OPZs, could also affect the textural structure during carbonization. The large
mesopores and macropores could be attributed to some aggregation between the CNSs during the
[image:5.595.99.494.410.560.2]carbonization. The total pore volume of CNSs is 0.43 cm3 g−1 and the micropore volume is 0.27 cm3 g−1. Figure 2.(a) Raman spectra of the OPZ and the CNSs; and (b) XRD pattern of the CNSs.
The N2adsorption isotherm of the OPZ nanospheres shows a very slow increase in N2adsorption
up to 0.95 of the relative pressure (P/P0) where a steep increase of the adsorbed volume is observed
and capillary condensation takes place (Figure3a). This behavior is common in non-porous and/or
macroporous materials (<50 nm diameter). Since no pores of this scale are observed in SEM analysis, the existence of macropores is originated from the textural void space between the nanospheres. This result is also evident from the Barrett-Joyner-Halenda (BJH) pore size distribution which is very broad
up to relatively unlimited pore sizes (Figure3b, black line). The specific surface area, calculated by the
Brunauer-Emmett-Teller (BET) equation in the range 0.05–0.2 P/P0, is 19 m2¨g´1. After carbonization,
the CNSs showed a mixed type of isotherm curves. At low P/P0 < 0.05 a type-I isotherm with a
high initial N2uptake is observed which is characteristic of microporous materials. The adsorbed
volume remains constant up to 0.9 P/P0where the filling of large pores takes place (type-IV). The
Materials2016,9, 35 5 of 13
presence of a wide range of mesopores. The specific surface area of CNSs is 875 m2¨g´1and was
calculated by the Langmuir equation since the BET method resulted in a negative C constant value in
the range 0.05–0.35 P/P0which significantly demeans the true result. According to V-t plot calculations
between 0.1 and 0.2 P/P0, the micropore area is 808 m2¨g´1and the major contributor of the total
specific surface area. The pore size distribution of the CNSs shows a wide range of mesopores and an incomplete distribution in the micropore region (limitation of the BJH method). The high micropore surface area is a result of “defected” carbon structure due to the presence of heteroatoms. Additionally, the presence of the small quantity of Cl in the OPZs, could also affect the textural structure during carbonization. The large mesopores and macropores could be attributed to some aggregation between
the CNSs during the carbonization. The total pore volume of CNSs is 0.43 cm3¨g´1and the micropore
volume is 0.27 cmMaterials 2016, 9, 35 3¨g´1. 5 of 12
Figure 3. (a) N2 adsorption‐desorption isotherms; and (b) pore size distribution of the OPZs and CNSs.
XPS analysis was performed on the CNSs in order to investigate the chemical composition and
the relative concentration, and give information regarding chemical bonding configurations in the
doped carbon nanospheres. The survey spectrum of the sample (Figure 4a) evidenced peaks of the
expected doping elements, N, S, P together with C and O. This result is a clear indication of the
successful incorporation of N, S and P atoms within the carbon spheres (in agreement with EDS
analyses). The atomic percentage of the elements is reported in Table 1 together with the peaks
position and width.
Table 1. Atomic percentage, peak position and width obtained by fitting the high resolution XPS spectra.
Element at% Peak Position (eV) Width (eV)
C 1s 67.0 (I) 284.3 1.2
(II) 289.8 2.8
O 1s 19.6
(I) 532.4 2.0
(II) 530.5 1.4
(III) 535.7 1.9
(IV) 537.9 1.9
P 2p 8.0 (3/2) 132.8 1.8
(1/2) 133.6 1.8
N 1s 4.7
(I) 397.6 1.6
(II) 399.6 1.6
(III) 401.2 1.6
S 2p 0.7 (3/2) 163.4 0.9
(1/2) 164.6 0.9
It can be observed that—apart from O—among the other heteroatoms, P has the highest atomic
percentage, while S is present in less than 1 at%. The high at% of P is related to: (i) the higher bonding
degree of P in the initial OPZs’ structure; (ii) the lower “diffusion” ability through the carbon
structure due to the larger atomic radius of P compared to N or S; and (iii) partial oxidation of P
during carbonization. Peak fitting was performed using multiple components and the P 2p and S 2p
[image:6.595.85.512.250.400.2]curves were fitted taking into account the spin‐orbit splitting and ratio 2p1/2:2p3/2 components of 0.5. Figure 3.(a) N2adsorption-desorption isotherms; and (b) pore size distribution of the OPZs and CNSs.
XPS analysis was performed on the CNSs in order to investigate the chemical composition and the relative concentration, and give information regarding chemical bonding configurations in the doped
carbon nanospheres. The survey spectrum of the sample (Figure4a) evidenced peaks of the expected
doping elements, N, S, P together with C and O. This result is a clear indication of the successful incorporation of N, S and P atoms within the carbon spheres (in agreement with EDS analyses). The
atomic percentage of the elements is reported in Table1together with the peaks position and width.
Table 1.Atomic percentage, peak position and width obtained by fitting the high resolution XPS spectra.
Element at % Peak Position (eV) Width (eV)
C 1s 67.0 (II) 289.8(I) 284.3 1.22.8
O 1s 19.6
(I) 532.4 2.0
(II) 530.5 1.4
(III) 535.7 1.9
(IV) 537.9 1.9
P 2p 8.0 (3/2) 132.8(1/2) 133.6 1.81.8
N 1s 4.7
(I) 397.6 1.6
(II) 399.6 1.6
(III) 401.2 1.6
[image:6.595.177.417.556.739.2]It can be observed that—apart from O—among the other heteroatoms, P has the highest atomic percentage, while S is present in less than 1 at %. The high at % of P is related to: (i) the higher bonding degree of P in the initial OPZs’ structure; (ii) the lower “diffusion” ability through the carbon structure due to the larger atomic radius of P compared to N or S; and (iii) partial oxidation of P during
carbonization. Peak fitting was performed using multiple components and the P 2pand S 2pcurves
were fitted taking into account the spin-orbit splitting and ratio 2Materials 2016, 9, 35 p1/2:2p3/2components of 0.5. 6 of 12
Figure 4. XPS of the CNSs sample: (a) survey spectrum and fitted high resolution spectra of; (b) C 1s;
(c) N 1s; (d) P 2p; (e) S 2p; and (f) O 1s.
The high resolution spectra of C 1s (Figure 4b) shows the typical graphitic carbon asymmetric
peak‐shape centered at 284.3 eV due to sp2 bonding, with an associated shake‐up feature at 289.8 eV
originating from the pi to pi* transition [29]. Examination of the N 1s spectrum shown in Figure 4c
revealed three different components that following previous interpretations [30] can be assigned to
pyridinic (397.6 eV), pyrrolic (399.6 eV) and substitutional (401.2 eV) N. Phosporous doped carbons have
been reported in a very small number of studies [27,31] and for this reason clear evidence for the bonding
of P even in graphitic carbon nanomaterials is missing [32]. The P 2p spectrum reported in Figure 4d shows
the existence of a single P bonding environment, with the 2p3/2 component centered at 132.8 eV. According
to some authors, this can be attributed to P‐O bonds, while usually a P 2p signature between 131 and
129 eV is assigned to C‐P species (substitutional P) [33]. Sulphur was also successfully incorporated in
the CNSs as confirmed by XPS analysis; the S 2p spectrum (Figure 4e) shows the S 2p3/2 and S 2p1/2
peaks at 163.4 and 164.6 eV respectively, which are consistent with C‐S‐C bonds such as in
thiophene‐S [7,34]. SOx groups, which usually show peaks at higher binding energy (about 168 eV), were
not detected here [7,34]. The O 1s spectral envelope (Figure 4f) contains several different components
pertaining to different oxygen‐containing species. While the components at higher binding energies are
ascribed to atmospheric contamination (H2O, C‐OH, COOH, etc.), the component at 530.5 eV is likely
due to NO/CO groups as determined previously for carbon nanoparticles [35].
Figure 4.XPS of the CNSs sample: (a) survey spectrum and fitted high resolution spectra of; (b) C 1s; (c) N 1s; (d) P 2p; (e) S 2p; and (f) O 1s.
The high resolution spectra of C 1s(Figure4b) shows the typical graphitic carbon asymmetric
peak-shape centered at 284.3 eV due to sp2bonding, with an associated shake-up feature at 289.8 eV
originating from the pi to pi* transition [29]. Examination of the N 1sspectrum shown in Figure4c
revealed three different components that following previous interpretations [30] can be assigned to
pyridinic (397.6 eV), pyrrolic (399.6 eV) and substitutional (401.2 eV) N. Phosphorous doped carbons
have been reported in a very small number of studies [27,31] and for this reason clear evidence for the
bonding of P even in graphitic carbon nanomaterials is missing [32]. The P 2pspectrum reported in
Figure4d shows the existence of a single P bonding environment, with the 2p3/2component centered
at 132.8 eV. According to some authors, this can be attributed to P-O bonds, while usually a P 2p
[image:7.595.124.473.181.580.2]Materials2016,9, 35 7 of 13
successfully incorporated in the CNSs as confirmed by XPS analysis; the S 2pspectrum (Figure4e)
shows the S 2p3/2 and S 2p1/2peaks at 163.4 and 164.6 eV respectively, which are consistent with
C-S-C bonds such as in thiophene-S [7,34]. SOxgroups, which usually show peaks at higher binding
energy (about 168 eV), were not detected here [7,34]. The O 1sspectral envelope (Figure4f) contains
several different components pertaining to different oxygen-containing species. While the components
at higher binding energies are ascribed to atmospheric contamination (H2O, C-OH, COOH,etc.),
the component at 530.5 eV is likely due to NO/CO groups as determined previously for carbon
nanoparticles [35].
Electrochemical Behavior
The lithium storage properties of the heteroatom-doped CNSs were evaluated in Swagelok and coin lithium half-cells by cyclic voltammetry and galvanostatic cycling for their potential application
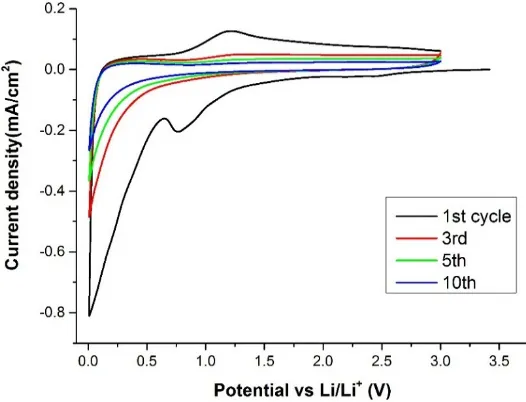
as anode material for lithium batteries. In Figure5the cyclic voltammetry (CV) test recorded at 0.1
mV¨s´1is reported. The first cycle shows a first cathodic peak at about 0.8 V that can be related to the
formation of the SEI layer [16]. Also a second peak from about 0.2 V to 0.005 V is clearly observed,
which can be assigned to the insertion of the Li ions in the pores of the nanospheres. A very broad anodic peak is also detected at about 1.0 V which could indicate that a reversible oxidation of some SEI components was taking place. For the subsequent cycles no other relevant reduction/oxidation peaks were observed. The voltammogram of this sample is in full agreement with previous reports in which
SEI formation and Li insertion peaks were reported in the initial cycles [16,19].
Materials 2016, 9, 35 7 of 12
Electrochemical Behavior
The lithium storage properties of the heteroatom‐doped CNSs were evaluated in Swagelok and coin
lithium half‐cells by cyclic voltammetry and galvanostatic cycling for their potential application as anode
material for lithium batteries. In Figure 5 the cyclic voltammetry (CV) test recorded at 0.1 mV s−1 is
reported. The first cycle shows a first cathodic peak at about 0.8 V that can be related to the formation of
the SEI layer [16]. Also a second peak from about 0.2 V to 0.005 V is clearly observed, which can be
assigned to the insertion of the Li ions in the pores of the nanospheres. A very broad anodic peak is also
detected at about 1.0 V which could indicate that a reversible oxidation of some SEI components was
taking place. For the subsequent cycles no other relevant reduction/oxidation peaks were observed. The
voltammogram of this sample is in full agreement with previous reports in which SEI formation and
Li insertion peaks were reported in the initial cycles [16,19].
Figure 5. Cyclic voltammetry (CV) test of the CNSs. The graph shows some selected cycles between
5 mV and 3 V at a scan rate of 0.1 mV s−1.
The galvanostatic discharge/charge results are shown in Figure 6. The cells were cycled at
different current rates up to 1C (Figure 6a) after three initial formation cycles at a current of C/20 (the
theoretical capacity was considered 372 mA h g−1 as for a graphite electrode). A first discharge
capacity of more than 1126 mA h g−1 (Figure 6b) was found with a large irreversible capacity of about
440 mA h g−1, as expected due to the large part of the initial discharge capacity related to the
electrolyte decomposition and SEI formation on the anode. The high surface area of the CNSs can be
considered responsible for the increased reactivity toward the electrolyte, which led to the observed
irreversible capacity. In a previous work of Dahn’s group [36] the important role of the S and O atoms
on the irreversible capacity of disordered carbons was evidenced. The authors found that the
irreversible capacity loss increased by increasing the chalcogen content. In this work the S content is
low and should have a minor effect on the capacity loss; the O content instead is significant and
together with the high surface area is associated with the observed capacity loss after the first cycle.
The charge and discharge voltage profile of the second and subsequent cycles are very similar with
a steep voltage increase/decrease at higher current rates, which mainly suggests a pseudo‐capacitive
behaviour. This cell was then cycled for a further 100 cycles at the medium‐low C/5 current rate
(Figure 6c). After an initial recovery of the capacity that reached 300 mA h g−1 a continuous decline
was observed with an overall 7% loss in discharge capacity for these cycles. However, a remarkable
[image:8.595.165.428.372.573.2]coulombic efficiency approaching 100% was obtained.
Figure 5.Cyclic voltammetry (CV) test of the CNSs. The graph shows some selected cycles between 5 mV and 3 V at a scan rate of 0.1 mV¨s´1.
The galvanostatic discharge/charge results are shown in Figure6. The cells were cycled at
different current rates up to 1C (Figure6a) after three initial formation cycles at a current of C/20
(the theoretical capacity was considered 372 mA¨h¨g´1as for a graphite electrode). A first discharge
capacity of more than 1126 mA¨h¨g´1(Figure6b) was found with a large irreversible capacity of
about 440 mA¨h¨g´1, as expected due to the large part of the initial discharge capacity related to
the electrolyte decomposition and SEI formation on the anode. The high surface area of the CNSs can be considered responsible for the increased reactivity toward the electrolyte, which led to the
observed irreversible capacity. In a previous work of Dahn’s group [36] the important role of the S and
together with the high surface area is associated with the observed capacity loss after the first cycle. The charge and discharge voltage profile of the second and subsequent cycles are very similar with a steep voltage increase/decrease at higher current rates, which mainly suggests a pseudo-capacitive behaviour. This cell was then cycled for a further 100 cycles at the medium-low C/5 current rate
(Figure6c). After an initial recovery of the capacity that reached 300 mA¨h¨g´1a continuous decline
was observed with an overall 7% loss in discharge capacity for these cycles. However, a remarkable coulombic efficiency approaching 100% was obtained.
Materials 2016, 9, 35 8 of 12
Figure 6. (a) Capacity vs. cycle number at C/20 (3 cycles), C/10 and C/5 (5 cycles each) and 1C current rate (25 cycles); (b) charge and discharge voltage profile of the first and second cycles at C/20; and (c) capacity vs. cycle number at C/5 current for 100 cycles.
The
CNSs
anode
was
then
tested
at
1C
and
higher
C
rates
to
check
the
rate
capability.
The
cell
was
cycled
at
1C
for
more
than
1000
cycles
(Figure
7a)
and
is
well
beyond
the
generally
reported
cycling
for
this
type
of
materials
for
which
no
more
than
few
hundreds
of
cycles
are
usually
reported.
The
importance
of
this
test
has
to
be
underlined
since
a
novel
anode
material
should
be
able
to
sustain
a
prolonged
cycling
for
being
considered
competitive
with
the
graphite
anodes
currently
in
use
in
commercial
devices.
The
first
few
formation
cycles
confirmed
the
behaviour
previously
observed
of
an
initial
large
irreversible
capacity.
A
stable
capacity
value
of
about
180
mA
h
g
−1was
reached
and
maintained
for
about
300
cycles,
then
a
constant
decay
led
to
the
final
discharge
value
of
125
mA
h
g
−1for
the
last
cycle.
Figure 7. Capacity vs. cycle number at: (a) 1C rate for 1100 cycles; and (b) at 1C, 2C and 5C current rate for 50 cycles each.
The
coulombic
efficiency,
although
showing
some
fluctuation
due
to
the
experimental
conditions,
was
definitely
high
with
an
average
value
of
99.992%
(calculated
over
the
whole
cycling)
that
is
the
ideal
efficiency
required
for
a
real
application.
In
general,
for
all
our
tests,
the
efficiency
was
affected
during
the
initial
cycles
by
the
formation
of
the
SEI
film
and
this
is
common
for
amorphous
carbon
also.
The
heteroatom
‐
doped
CNSs
showed
an
efficiency
among
the
highest
reported
in
the
literature
so
far
Figure 6.(a) Capacityvs.cycle number at C/20 (3 cycles), C/10 and C/5 (5 cycles each) and 1C current rate (25 cycles); (b) charge and discharge voltage profile of the first and second cycles at C/20; and (c) capacityvs.cycle number at C/5 current for 100 cycles.
The CNSs anode was then tested at 1C and higher C rates to check the rate capability. The cell was
cycled at 1C for more than 1000 cycles (Figure7a) and is well beyond the generally reported cycling
for this type of materials for which no more than few hundreds of cycles are usually reported. The importance of this test has to be underlined since a novel anode material should be able to sustain a prolonged cycling for being considered competitive with the graphite anodes currently in use in commercial devices. The first few formation cycles confirmed the behaviour previously observed of
an initial large irreversible capacity. A stable capacity value of about 180 mA¨h¨g´1was reached and
maintained for about 300 cycles, then a constant decay led to the final discharge value of 125 mA¨h¨g´1
for the last cycle.
[image:9.595.88.508.195.500.2]Materials2016,9, 35 9 of 13
achieved due to the unique porous structure of the CNSs which favoured strain relaxation during Li+
insertion/extraction and also to an appropriate surface area. At a higher C rate (5C) the discharge
capacity was still around 90 mA¨h¨g´1(Figure7b). Although similar carbon systems have shown
higher rate capabilities [16,19,37], the CNSs characterized herein for Li-ion cells, doped with N, P
and S showed an interesting electrochemical performance and could represent a promising material concept. A synergetic effect between structure and heteroatom doping might be responsible for the observed high cycle stability. Heteroatoms are known to affect the electronic properties of carbon, the textural structure (porosity, disorder degree, crystal size) and also increase the active sites of the
anode material [27]. All these effects are concomitant thus making it complicated to interpret the
single contribution of all those factors to the electrochemical behavior of the CNSs. Although the nitrogen-doped carbons have been well studied in energy storage applications (see references herein), there is limited knowledge for other heteroatoms’ effect and even less for dual or ternary heteroatom
doped carbons [27]. In this concept, further work is needed in order to clarify the doping effect on the
electrochemical response optimizing the materials for real device applications.
Materials 2016, 9, 35 8 of 12
Figure 6. (a) Capacity vs. cycle number at C/20 (3 cycles), C/10 and C/5 (5 cycles each) and 1C current rate (25 cycles); (b) charge and discharge voltage profile of the first and second cycles at C/20; and (c) capacity vs. cycle number at C/5 current for 100 cycles.
The CNSs anode was then tested at 1C and higher C rates to check the rate capability. The cell was
cycled at 1C for more than 1000 cycles (Figure 7a) and is well beyond the generally reported cycling for
this type of materials for which no more than few hundreds of cycles are usually reported. The importance
of this test has to be underlined since a novel anode material should be able to sustain a prolonged cycling
for being considered competitive with the graphite anodes currently in use in commercial devices. The
first few formation cycles confirmed the behaviour previously observed of an initial large irreversible
capacity. A stable capacity value of about 180 mA h g−1 was reached and maintained for about 300 cycles,
then a constant decay led to the final discharge value of 125 mA h g−1 for the last cycle.
Figure 7. Capacity vs. cycle number at: (a) 1C rate for 1100 cycles; and (b) at 1C, 2C and 5C current rate for 50 cycles each.
The coulombic efficiency, although showing some fluctuation due to the experimental conditions,
was definitely high with an average value of 99.992% (calculated over the whole cycling) that is the ideal
efficiency required for a real application. In general, for all our tests, the efficiency was affected during the
initial cycles by the formation of the SEI film and this is common for amorphous carbon also. The
heteroatom‐doped CNSs showed an efficiency among the highest reported in the literature so far Figure 7.Capacityvs.cycle number at: (a) 1C rate for 1100 cycles; and (b) at 1C, 2C and 5C current
rate for 50 cycles each.
3. Materials and Methods
3.1. Materials
Hexachlorocyclotriphosphazene (98%, Acros Organics, Pittsburgh, PA, USA), 41-sulphonildiphenol
(Fisher Scientific, Pittsburgh, PA, USA), triethylamine (Fisher Scientific) and acetonitrile (analytical grade, Fisher Scientific) were used as received. Acetone and deionized water were used for the washing steps.
3.2. Synthesis of Organophosphazene Nanospheres
The synthesis of the OPZs was performed according to literature [22,38] with a slightly
modification in order to prepare particles of smaller diameter. Typically, a 250 mL round bottom flask containing 150 mL of acetonitrile, HCCP (2.25 mg/mL) and BPS (5.7 mg/mL), was placed in a sonicator bath (80 W, 37 kHz) and the precursors left to dissolve before 4 mL of TEA were added. The particle formation was observed within 10 s and the mixture left under sonication for 10 min. The solids were collected by centrifugation, washed several times with acetone and water, and finally dried
in vacuum oven at 50˝C for 24 h (yield 70%).
3.3. Carbonization
The conversion of the as-prepared OPZ nanospheres to carbon nanospheres took place in a tube
furnace from 25˝C to 850˝C under N
[image:10.595.86.512.289.433.2]An isothermal step at 850˝C was maintained for 2 h and then the furnace left to cool down to room temperature.
3.4. Characterization
Field emission scanning electron microscopy (FE-SEM) and X-ray electron dispersive spectroscopy analysis (EDS) were performed on a Zeiss SIGMA SEM (Carl Zeiss AG, Oberkochen, Germany). Gold-Palladium (AuPd) sputtering was applied to the samples before observation. Carbonized samples did not need sputtering. FT-IR spectra were recorded on a Bruker Tensor 27 spectrometer equipped with an ATR cell (Bruker, Billerica, MA, USA). Raman spectra were recorded on a Renishaw
in Via Confocal Raman Microscope equipped with 532 nm and 785 laser-lines, and a 0.75 NA (ˆ50)
lens was used (Renishaw, Wotton-under-Edge, UK). Thermogravimetric analysis curves were obtained with a Mettler Toledo instrument (Mettler-Toledo, Columbus, OH, USA) in the temperature range
25–850˝C at a heating rate of 10˝C¨min´1under gas N
2flow. Specific surface area and pore size
distribution were calculated from the nitrogen adsorption-desorption isotherm curves obtained with a Micromeritics ASAP 2020 Physisorption Analyzer (Micromeritics, Norcross, GA, USA). CNSs were
degassed at 200˝C and OPZ at 60˝C for 16 h before measurements. X-ray Photoelctron spectroscopy
(XPS) characterization was carried out with a Kratos Axis Ultra DLD spectrometer (Kratos Analytical
Ltd, Manchester, UK) using monochromatic Al Kαsource (hν= 1486.6 eV). Survey spectra were
collected with a pass energy of 160 eV over a binding energy (BE) range of 1200–0 eV. High-resolution spectra were obtained using a 20 eV pass energy (resolution approximately 0.4 eV) and an analysis area
of ~300ˆ700µm. The spectrometer was calibrated using the Fermi edge position of a polycrystalline
Ag sample immediately prior to the experiments reported below. Peak fitting was performed by using CasaXPS software, using mixed Gaussian-Lorentzian (Voigt) line shapes and Shirley backgrounds.
3.5. Electrode Preparation and Electrochemical Characterization
To prepare the electrode, a slurry was made by mixing the carbon nanospheres with carbon black (Super P 65, TIMCAL, Cleveland, OH, USA) and poly(vinylidene fluoride) (PVDF, Solvay, Brussels,
Belgium) inN-methyl-2-pyrrolidone (NMP, Sigma-Aldrich, St. Louis, MO, USA) with a weight ratio
of 80:20:10. The obtained suspension was sonicated for one hour, then mixed on a magnetic stirrer for four hours and spread on a copper current collector by using a draw-down coater and a stainless
steel applicator (bird applicator) with a 70µm gap. The solvent was let to completely evaporate in
a vacuum oven overnight and the foils were then transferred to a dry-room (humidity less than 1%,
´45˝C dew point, Munters, Fort Myers, FL, USA). All cell components were dried in a vacuum oven
(Binder Vacuum Drying Ovens with integrated vacuum pump system) at 50˝C overnight before
assembly. The galvanostatic cycling were performed using 2032 coin cells from MTI (Richmond, CA 94804, USA); lithium metal was used as the counter electrode, and Celgard 2325 (Celgard, Charlotte, NC, USA) was used as the separator. To assemble the 2032 coin cells, the electrode foils were cut into
disks of 1.2 cm diameter with a loading of about 3.5 mg/cm2of active material. The electrolyte was 1
M LiPF6 in Ethylene Carbonate/ Ethyl methyl Carbonate (EC/EMC) 3:7 v/v and 1 wt % VC (PuriEl, Soulbrain MI, Northville, MI, USA). The cell were cycled at different current rate (from C/20 to 5C) in the 0.005–2 V range by using a Maccor Series 4000 battery cycler (Maccor, Tulsa, OK, USA). Swagelok cells with Li as reference electrode were also assembled for the cyclic voltammetry (CV) test. The CV was performed at a scan rate of 0.1 mV/s in the potential range 0.005–3.0 V using a Biologic VMP3 (Bio-Logic, Grenoble, France). The cells were tested at ambient temperature.
4. Conclusions
Heteroatom co-doped carbon nanospheres were successfully prepared by a carbonization process
of highly cross-linked poly(cyclotriphosphazene-co-4,41 sulphonyl diphenol) nanospheres. The
co-doped carbon nanospheres have a mixed microporous/mesoporous structure and a high surface
Materials2016,9, 35 11 of 13
revealed the respective atomic concentration of S, N and P. The as-prepared CNSs showed remarkable
cycling stability for more than 1000 cycles, delivering a capacity of about 130 mA¨h¨g´1at a current
rate of 1C. In addition, a remarkable coulombic efficiency as high as 99.99% was maintained during the long cycling thereby showing great promise for application in lithium batteries. The high specific surface area, the porous structure and multi-heteroatom doping all contributed to the electrochemical performance of the CNSs. Heteroatom doped CNSs are potential materials for various important applications in catalysis, supercapacitors and hydrogen storage and the synergistic effects of dopant atoms could be key to advanced technology.
Supplementary Materials:The following are available online at www.mdpi.com/1996-1944/9/1/35/s1.
Acknowledgments:The authors would like to thank Marc Walker (Warwick Photoemission Facility) for assistance during the XPS data collection and for helpful contribution for XPS data analysis.
Author Contributions:Chaoying Wan and George S. Pappas conceived and designed the experiments; George S. Pappas and Stefania Ferrari performed the experiments; George S. Pappas and Stefania Ferrari analyzed the data; David M. Haddleton, Rohit Bhagat, Xiaobin Huang and Chaoying Wan contributed reagents/materials/analysis tools; Xiaobin Huang contributed on the discussion; George S. Pappas and Stefania Ferrari wrote the paper; all the authors revised the paper.
Conflicts of Interest:The authors declare no conflict of interest.
References
1. Bini, M.; Capsoni, D.; Ferrari, S.; Quartarone, E.; Mustarelli, P. Rechargeable lithium batteries: Key scientific and technological challenges. InRechargeable Lithium Batteries: From Fundamentals to Applications; Franco, A.A., Ed.; Woodhead Publishing Limited: Cambridge, UK, 2015; pp. 1–16.
2. Pappas, G.S.; Ferrari, S.; Wan, C. Recent advances in graphene-based materials for lithium batteries.Curr. Org.
Chem.2015,19, 1838–1849. [CrossRef]
3. Obrovac, M.N.; Chevrier, V.L. Alloy negative electrodes for Li-ion batteries.Chem. Rev.2014,114, 11444–11502. [CrossRef] [PubMed]
4. Lee, W.; Moon, J.H. Monodispersed N-doped carbon nanospheres for supercapacitor application.ACS Appl.
Mater. Interfaces2014,6, 13968–13976. [CrossRef] [PubMed]
5. Dai, Y.; Jiang, H.; Hu, Y.; Fu, Y.; Li, C. Controlled synthesis of ultrathin hollow mesoporous carbon nanospheres for supercapacitor Applications.Ind. Eng. Chem. Res.2014,53, 3125–3130. [CrossRef]
6. Jiang, J.; Gao, Q.; Zheng, Z.; Xia, K.; Hu, J. Enhanced room temperature hydrogen storage capacity of hollow nitrogen-containing carbon spheres.Int. J. Hydrog. Energy2010,35, 210–216. [CrossRef]
7. You, C.; Liao, S.; Li, H.; Hou, S.; Peng, H.; Zeng, X.; Liu, F.; Zheng, R.; Fu, Z.; Li, Y. Uniform nitrogen and sulfur co-doped carbon nanospheres as catalysts for the oxygen reduction reaction.Carbon2014,69, 294–301. [CrossRef]
8. Centi, G.; Barbera, K.; Perathoner, S.; Gupta, N.K.; Ember, E.E.; Lercher, J.A. Onion-like graphene carbon nanospheres as stable catalysts for carbon monoxide and methane chlorination. ChemCatChem2015, 7, 3036–3046. [CrossRef]
9. Wang, H.; Abe, T.; Maruyama, S.; Iriyama, Y.; Ogumi, Z.; Yoshikawa, K. Graphitized carbon nanobeads with an onion texture as a Lithium-ion battery negative electrode for high-rate use.Adv. Mater.2005,17, 2857–2860. [CrossRef]
10. Jin, Y.Z.; Kim, Y.J.; Gao, C.; Zhu, Y.Q.; Huczko, A.; Endo, M.; Kroto, H.W. High temperature annealing effects on carbon spheres and their applications as anode materials in Li-ion secondary battery.Carbon2006,44, 724–729. [CrossRef]
11. Wang, Y.; Su, F.; Wood, C.D.; Lee, J.Y.; Zhao, X.S. Preparation and characterization of carbon nanospheres as anode materials in lithium-ion secondary batteries.Ind. Eng. Chem. Res.2008,47, 2294–2300. [CrossRef] 12. Xiao, J.; Yao, M.; Zhu, K.; Zhang, D.; Zhao, S.; Lu, S.; Liu, B.; Cui, W.; Liu, B. Facile synthesis of hydrogenated
13. Wang, S.-X.; Chen, S.; Wei, Q.; Zhang, X.; Wong, S.Y.; Sun, S.; Li, X. Bioinspired synthesis of hierarchical porous graphitic carbon spheres with outstanding high-rate performance in lithium-ion batteries.Chem.
Mater.2015,27, 336–342. [CrossRef]
14. Wang, F.; Song, R.; Song, H.; Chen, X.; Zhou, J.; Ma, Z.; Li, M.; Lei, Q. Simple synthesis of novel hierarchical porous carbon microspheres and their application to rechargeable lithium-ion batteries.Carbon2015,81, 314–321. [CrossRef]
15. Chen, X.; Kierzek, K.; Jianh, Z.; Chen, H.; Tang, T.; Wojtoniszak, M.; Kalenczuk, R.J.; Chu, P.C.; Borowiak-Palen, E. Synthesis, growth mechanism, and electrochemical properties of hollow mesoporous carbon spheres with controlled diameter.J. Phys. Chem. C2011,115, 17717–17724. [CrossRef]
16. Tang, K.; White, R.J.; Mu, X.; Titirici, M.-M.; van Aken, P.A.; Maier, J. Hollow carbon nanospheres with a high rate capability for lithium-based batteries.ChemSusChem2012,5, 400–403. [CrossRef] [PubMed] 17. Zang, J.; Ye, J.; Fang, X.; Zhang, X.; Zheng, M.; Dong, Q. Hollow-in-hollow carbon spheres for lithium-ion
batteries with superior capacity and cyclic performance.Electrochimica Acta2015,186, 436–441. [CrossRef] 18. Vu, A.; Qian, Y.; Stein, A. Porous electrode materials for lithium-ion batteries—How to Prepare them and
what makes them special.Adv. Energy Mater.2012,2, 1056–1085. [CrossRef]
19. Zhang, K.; Li, X.; Liang, J.; Zhu, Y.; Hu, L.; Cheng, Q.; Guo, C.; Lin, N.; Qian, Y. Nitrogen-doped porous interconnected double-shelled hollow carbon spheres with high capacity for lithium ion batteries and sodium ion batteries.Electrochimica Acta2015,155, 174–182. [CrossRef]
20. Nieto-Márquez, A.; Romero, R.; Romero, A.; Valverde, J.L. Carbon nanospheres: Synthesis, physicochemical properties and applications.J. Mater. Chem.2011,21, 1664–1672. [CrossRef]
21. Zhu, L.; Xu, Y.; Yuang, W.; Xi, J.; Huang, X.; Tang, X.; Zheng, S. One-pot synthesis of poly (cyclotriphosphazene-co-4,41-sulfonyldiphenol) nanotubes via anin situtemplate approach. Adv. Mater. 2006,18, 2997–3000. [CrossRef]
22. Zhu, Y.; Huang, X.; Li, W.; Fu, J.; Tang, X. Preparation of novel hybrid inorganic—Organic microspheres with active hydroxyl groups using ultrasonic irradiation via one-step precipitation polymerization.Mater.
Lett.2008,62, 1389–1392. [CrossRef]
23. Zhu, Y.; Huang, X.; Fu, J.; Wang, G.; Tang, X. Morphology control between microspheres and nanofibers by solvent-induced approach based on crosslinked phosphazene-containing materials.Mater. Sci. Eng. B2008,
153, 62–65. [CrossRef]
24. Wang, Y.; Shi, L.; Zhang, W.; Jiang, Z.; Mu, J. A comparative structure-property study of polyphosphazene micro-nano spheres.Polym. Bull.2014,71, 275–285. [CrossRef]
25. Fu, J.; Wang, M.; Zhang, C.; Zhang, P.; Xu, Q. High hydrogen storage capacity of heteroatom-containing porous carbon nanospheres produced from cross-linked polyphosphazene nanospheres.Mater. Lett.2012,
81, 215–218. [CrossRef]
26. Zhang, P.; Huang, X.; Fu, J.; Huang, Y.; Zhu, Y.; Tang, X. A one-pot approach to novel cross-linked polyphosphazene microspheres with active amino groups. Macromol. Chem. Phys. 2009,210, 792–798. [CrossRef]
27. Paraknowitsch, J.P.; Thomas, A. Doping carbons beyond nitrogen: An overview of advanced heteroatom doped carbons with boron, sulphur and phosphorus for energy applications.Energy Environ. Sci.2013,6, 2839–2855. [CrossRef]
28. Schwan, J.; Ulrich, S.; Batori, V.; Ehrhardt, H. Raman spectroscopy on amorphous carbon films.J. Appl. Phys.
1996,80, 440–447. [CrossRef]
29. Xu, S.; Yan, X.B.; Wang, X.L.; Yang, S.R.; Xue, Q.J. Synthesis of carbon nanospheres from carbon-based network polymers.J. Mater. Sci.2010,45, 2619–2624. [CrossRef]
30. Zhu, D.; Wang, Y.; Gan, L.; Liu, M.; Cheng, K.; Zhao, Y.; Deng, X.; Sun, D. Nitrogen-containing carbon microspheres for supercapacitor electrodes.Electrochim. Acta2015,158, 166–174. [CrossRef]
31. Hasegawa, G.; Deguchi, T.; Kanamori, K.; Kobayashi, Y.; Kageyama, H.; Abe, T.; Nakanishi, K. High-level doping of nitrogen, phosphorus, and sulfur into activated carbon monoliths and their electrochemical capacitances.Chem. Mater2015,27, 4703–4712. [CrossRef]
32. Susi, T.; Pichler, T.; Ayala, P. X-ray photoelectron spectroscopy of graphitic carbon nanomaterials doped with heteroatoms.Beilstein J. Nanotechnol.2015,6, 177–192. [CrossRef] [PubMed]
Materials2016,9, 35 13 of 13
34. Chen, X.; Chen, X.; Xu, X.; Yang, Z.; Liu, Z.; Zhang, L.; Xu, X.; Chen, Y.; Huang, S. Sulfur-doped porous reduced graphene oxide hollow nanosphere frameworks as metal-free electrocatalysts for oxygen reduction reaction and as supercapacitor electrode materials.Nanoscale2014,6, 13740–13747. [CrossRef] [PubMed] 35. Ray, S.C.; Saha, A.; Jana, N.R.; Sarkar, R. Fluorescent carbon nanoparticles: Synthesis, characterization and
bioimaging application.J. Phys. Chem. C2009,113, 18546–18551. [CrossRef]
36. Larcher, D.; Mudalige, C.; Gharghouri, M.; Dahn, J.R. Electrochemical insertion of Li and irreversibility in disordered carbons prepared from oxygen and sulfur-containing pitches. Electrochimica Acta1999,44, 4069–4072. [CrossRef]
37. Li, D.; Ding, L.-X.; Chen, H.; Wang, S.; Li, Z.; Zhu, M.; Wang, H. Novel nitrogen-rich porous carbon spheres as a high-performance anode material for lithium-ion batteries. J. Mater. Chem. A2014,2, 16617–16622. [CrossRef]
38. Wei, W.; Huang, X.; Tao, Y.; Chen, K.; Tang, X. Enhancement of the electrocapacitive performance of manganese dioxide by introducing a microporous carbon spheres network.Phys. Chem. Chem. Phys.2012,14, 5966–5972. [CrossRef] [PubMed]