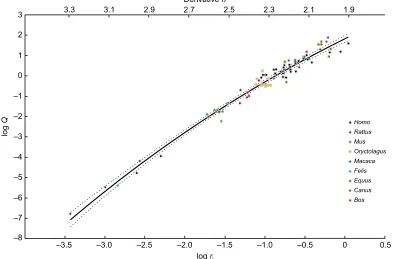
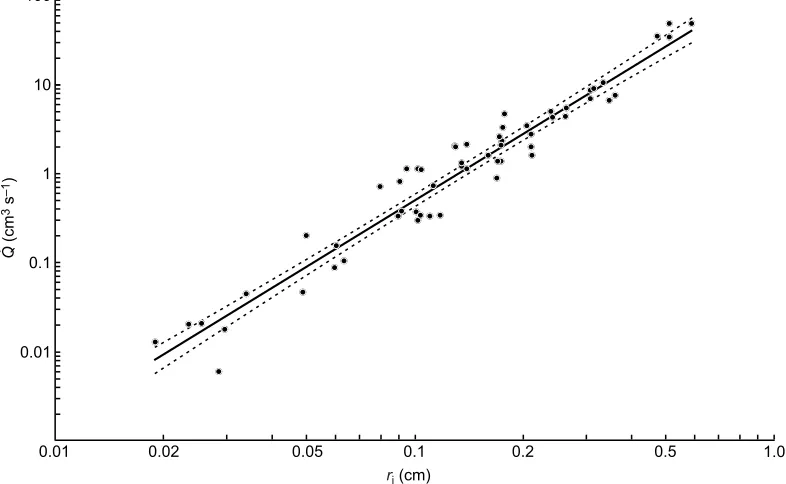
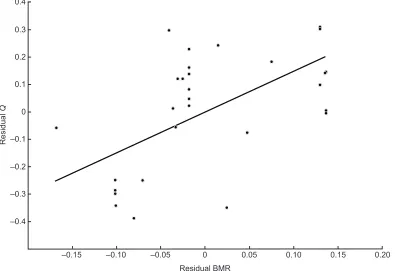
Interspecific scaling of blood flow rates and arterial sizes in mammals
Full text
Figure


Related documents
12 The effect remains statistically significant when including distance along the Nile and population density in grid i as control variables (column (2)) and also when
In the lean concept, we focus on identifying and eliminating activities that are deemed unnecessary (non-value added activity) in the entire system in the company so that
The pilot mobile application ChilDiBu has been developed with a Bulgarian language support for children with special educational needs and is presented in the
To end your MATLAB session, type quit in the Command Window, or select File −→ Exit MATLAB in the desktop main menu.. 1.4
It is cus- tomarily admitted that neutral countries, although obliged by the fact of the international conununity not to restrain the liberty of the
the owner of an autonomous vehicles should remain liable. For example, if the owner attempts to override the AI system piloting the vehicle, or modifies the vehicle in any way,
Erythrocyte segmentation results of Artificial neural network, (a) is the pre-processed image from KEMRI, (c) is the pre-processed image from CDC, (b) and (d) are the resultant
