RESEARCH ARTICLE
Periodic, moderate water flow reversibly increases hair bundle
density and size in
Nematostella vectensis
Allison Campbell, Ashlyn Dykes and Patricia Mire*
ABSTRACT
Animals employ hair bundles on hair cells to detect flow, vibrations and gravity. Hair bundles on sea anemone tentacles detect nearby vibrations in the water column produced by prey movements and then regulate discharge of cnidae to capture prey. This study investigated: (1) the progressive effects of periodic water flow on hair bundle morphology and density of hair bundles and cnidae in sea anemones, (2) the reversibility of the flow response and (3) the ability of the response to be expedited with increased flow duration. Linear density of hair bundles along tentacles and each hair bundle’s dimensions was measured in anemones exposed to flow and in the absence of flow. With increasing numbers of days of flow, hair bundles in anemones exposed to flow for 1 h every weekday for 20 days increased in density and grew longer and wider at bases and middles, whereas controls did not. Time courses fit to a linear function exhibited significantly larger positive slopes from animals exposed to flow compared with controls. Hair bundles in anemones exposed to flow for 3 h each day increased in linear density, length, base width and middle width after 10 days of flow and returned to control levels after 10 days following cessation of flow. In addition, there was a trend for an increase in density of cnidae with flow. Therefore, anemone hair bundles are dynamically and reversibly modified by periodic, moderate flow to become more abundant and robust. These findings may have relevance to hair cells in acoustico-lateralis systems of higher animals.
KEY WORDS: Anemone, Cnidae, Phenotypic plasticity, Hair cell, Mechanoreceptor
INTRODUCTION
Nematostella vectensis, the starlet sea anemone, has become a model organism because of its simple nervous system, ability to regenerate and utility in studying development in an evolutionary context (reviewed in Layden et al., 2016). Sea anemones belong to the phylum Cnidaria, the simplest animals to possess true tissues and a nervous system. Despite their primitive origin, they share homologous genes with those of higher-level organisms, including
vertebrates (Darling et al., 2005). For example,N. vectensispossesses
genes homologous to those involved in mesodermal differentiation in
Bilateria (Martindale et al., 2004).Nematostella vectensisalso has a
homolog of cadherin 23, which is an important protein in vertebrate hair cells (Di Palma et al., 2001). Cadherin 23 is localized to tip links
in hair bundle mechanoreceptors arising from the hair cells in both vertebrates and anemones (Watson et al., 2008).
Hair bundle mechanoreceptors are used to detect flow, vibrations and gravitational forces in many animals. Hair bundles on sea anemone tentacles share many common features with those of the acoustico-lateralis system of vertebrates, including actin-based
stereocilia connected by proteinaceous linkages, sigmoidal
stimulus–response curves, and sensitivity to certain drugs such as
aminoglycoside antibiotics (reviewed in Watson and Mire, 1999). In anemones, hair bundle mechanoreceptors, in concert with chemoreceptors, regulate discharge of cnidae found on its tentacles. Cnidae are cnidarian organelles that, when stimulated, discharge in order to capture prey either through the use of toxins or by physically incapacitating the prey. Hair bundles are composed of small-diameter stereocilia that originate from two to four hair cells, surrounding six to eight longer, large-diameter stereocilia, originating from a central sensory neuron (Mire-Thibodeaux and Watson, 1994; Watson et al., 2009). The stereocilia are interconnected by numerous linkages, including lateral links and tip links (Watson et al., 1997,) to ensure that the hair bundle moves as a unit in response to vibrations in the environment. Hair bundles are modulated by activation of particular chemoreceptors on hair cells. One type of chemoreceptor binds N-acetylated sugars commonly found in mucus. These sugars are thought to diffuse into the water column from prey surfaces. The stimulation of the chemoreceptors by the binding of N-acetylated sugars causes polymerization of the actin filaments in the stereocilia, leading to elongation of both the small- and large-diameter stereocilia (Watson and Roberts, 1995). This elongation tunes the hair bundles to lower frequencies corresponding to those produced by vibrations made by swimming prey (Watson and Hessinger, 1989). When vibrations are detected, the movement of the hair bundle causes a change in membrane potential of the surrounding hair cells (Mire and Watson, 1997; Watson et al., 2009). Signaling by hair cells is communicated to the sensory neuron by gap junctions and then through the underlying nerve net to cnidocytes, sensitizing them to discharge cnidae upon contact of prey to the tentacles (Mire et al., 2000).
In contrast to vertebrates, anemones have a remarkable ability to repair hair bundles after damage (Watson et al., 1998). After a 1 h
Ca2+-free treatment, which severely disrupts hair bundles, hair
bundle structure and function are restored and animals recover normal vibration-sensitive discharge of cnidae within 4 h. Repair is accomplished by a cocktail of proteins produced by the anemone and secreted into the mucus. When this cocktail of proteins is supplied exogenously to damaged hair bundles, repair is accomplished in a matter of minutes. Anemone repair proteins also enhance repair of damaged hair bundles in neuromasts of fish (Repass and Watson, 2001) and cochlea of mice (Tang et al., 2016). The plasticity of anemone hair bundles is likely an adaptation to its environment. Anemones, which are sessile marine predators, rely on prey that either swim past them or are carried over them by water
Received 16 March 2018; Accepted 31 October 2018
Department of Biology, P.O. Box 43606, University of Louisiana at Lafayette, Lafayette, LA 70504-3602, USA.
All authors contributed equally to this work *Author for correspondence ( [email protected])
P.M., 0000-0002-4908-399X
Journal
of
Experimental
currents. Prey capture requires contact between the prey and anemone tentacles and massive discharge of cnidae from the tentacle surface. However, to function in detecting vibrations from
prey, hair bundles must protrude out into this‘noisy’and potentially
damaging environment. Previous studies have not directly addressed how the presence of a periodic, moderate mechanical stimulus, such as water flow in the natural habitat, may affect hair bundles in anemones. The present study aimed to determine the progressive effects of periodic, moderate water flow on the morphology and density of hair bundles in tentacles of the sea
anemoneN. vectensis.Because hair bundles in anemones regulate
discharge of cnidae, the effect of flow on density of cnidae in tentacles was also examined. In addition, this study investigated the ability of the flow response to be expedited with increasing flow duration and the reversibility of the flow response.
MATERIALS AND METHODS Animal culture maintenance
Mass cultures ofNematostella vectensisStephenson 1935 anemones
were kept in 9×11 inch (=22.86×27.94 cm) glass dishes filled with 16 ppt seawater. Anemones were fed concentrated, freshly hatched brine shrimp nauplli twice weekly and the seawater was changed out the next day. Prior to each experiment, 40 anemones were selected from the mass cultures matched by mass, randomly separated into two groups of 20 each, and then each group was placed into a glass dish containing 1300 ml of 16 ppt seawater and 0.56 liters of sand. Sand was placed at the bottom of the dishes to provide a substrate into which the anemones could partially burrow, mimicking the natural
habitat of N. vectensis, a burrowing anemone. The cultures were
maintained by feeding the anemones twice a week with equal volumes of freshly hatched brine shrimp nauplii (Brine Shrimp Direct), followed by changing out equal volumes of seawater the next day. The experimental groups were additionally exposed to a flow rate
of 4.45±0.29 ml s−1for either 1 h every weekday for 20 days or for
3 h every weekday for 10 days. Intermittent flow was selected to mimic what might occur in the natural habitat of marshes and estuaries. Flow was created by a submersible pump (Rio600, TAAM) placed in a separate container of 16 ppt seawater connected to input and output tubes placed into the experimental culture. The input and output tubes were positioned near the edge of the dish opposite to each other, and the flow rate was adjusted by clamping the tubes until anemones were not dislodged from the sand. With the tubes clamped, flow rate was determined by pouring a known volume of seawater into the glass dish, marking the level of water on the side of the dish, removing the known volume of water, removing the outflow tubing, turning on the pump, and then timing how long the pump ran before the water reached the mark. Tubing of the same length and type was placed in the control culture for 1 h every weekday but not connected to a pump.
Tissue preparation and microscopy
To determine progressive effects of 1 h of flow per day, two animals from the experimental group and two animals from the control group were randomly selected every 2 days and analyzed for each of 10 time points. Thus, 20 anemones were analyzed for each condition over the time course of 20 days. In addition, two anemones (matched by mass) were removed directly from the mass cultures and analyzed for comparison. To investigate the effect of increasing duration of flow
on hair bundles to 3 h day−1, to examine flow effects on cnida density
and to determine the reversibility of the flow response, two randomly selected animals from the experimental group and two from the control group were analyzed prior to flow (day 0), after 5 and 10 days
of flow (days 5 and 10), and after 5 and 10 days following cessation of flow (days 15 and 20). Thus 10 anemones were analyzed for each condition over the time course of 20 days. For analysis, anemones were placed in potassium seawater (KSW) for at least 1 h to anesthetize them. KSW is modified from normal artificial seawater
by replacing 45.5 mmol l−1of NaCl with 45.5 mmol l−1of KCl to
inhibit action potential formation. KSW was prepared by dissolving
concentrations (in mmol l−1) of: NaCl (166), MgSO
4 (13), MgCl2
(12), KCl (50), CaCl2(6) and NaHCO3(1) and then diluting to 16 ppt
with deionized water. The oral discs of anemones were then removed and placed in fixative for between 30 min and 24 h ( pilot studies showed no significant change in hair bundles or cnidae fixed for this time interval). Fixative contained 4% paraformaldehyde and 0.5%
glutaraldehyde prepared in Millonig’s buffer. Oral discs were then
washed in 1× phosphate-buffered saline (PBS) solution. In the PBS solution, the oral discs were sectioned and wet mount slides were
made. For the experiment utilizing 1 h day−1of flow, the wet mount
slides were viewed and photographed using phase contrast microscopy and a 100×, 1.25 na, PLAN oil-immersion lens (Motic BA300 microscope, Moticam 2.0 camera and Motic Images Plus 2.0
software). For the experiment utilizing 3 h day−1of flow, to examine
cnidae density and to test reversibility of the flow response, wet mount slides were viewed with oblique contrast and a 100×, 1.30 na, PLAN apochromat oil-immersion lens (LOMO Lumam microscope model RP011-T, LOMO America, 11,000 SBIG cooled CCD camera and Maxim-DL software, Diffraction Limited). Oblique contrast provided better resolution of cnidae in the tentacles. For each anemone, three tentacles were selected at random, and progressive fields of view were imaged starting at the tip of the tentacle. For the Motic camera, three fields of view were imaged with each field of view equal to 125 µm in length. For the SBIG camera, two fields of view were imaged, each of 182 µm in length.
Data collection
From the digital images of tentacles, the hair bundles in profile were counted and the linear distance of each tentacle edge was measured to calculate linear density expressed as number of hair bundles per 100 µm of tentacle (ImageJ software, National Institutes of Health). The length and width at the base, middle and tip were measured for each hair bundle in focus by digitally enlarging the hair bundle and sharpened to better resolve the hair bundle. Lines were then drawn onto the enlarged hair bundle and length in pixels was converted to micrometers (ImageJ software). To calculate cnida density, the digital images were rotated to make the tentacle surface parallel to the long axis of the image and then images were digitally contrasted and sharpened to enhance cnidae. From each image, a 25×100 µm rectangular area was selected where cnidae were in best focus, and the image was cropped. For each cropped image, the number of cnidae
was counted in the 2500μm2area (Cell Counter, ImageJ software).
For the progressive study, data on hair bundles were collected from an experimental and a control culture every 2 days of 1 h of flow each day for 20 days. For investigating the effects of increased duration of flow on hair bundles and the effects of flow on cnida density, and to determine the reversibility of the flow response, data were collected from a second set of cultures prior to the beginning of flow (day 0), 5
and 10 days after the beginning of flow for 3 h day−1(days 5 and 10),
and 5 and 10 days after cessation of flow (days 15 and 20). Although the number of anemones in each culture increased owing to reproduction, only the largest animals were taken out of each
culture for analysis. Nematostella vectensis routinely reproduces
asexually by physal pinching and sexually by embryogenesis. Physal
pinching is a type of transverse fission whereby the parent anemone
Journal
of
Experimental
pinches off a small piece at the physal end. The physal fragment is much smaller than the oral end (approximately one-fifth the size). Whereas the oral end need only close the wound to continue feeding and growing, the physal fragment must close the wound, form a new oral disc and form tentacles before it can continue feeding and growing, a process requiring several weeks. Embryogenesis results in a planula larva which develops into a primary polyp approximately
1 mm long approximately 7–14 days after fertilization. The primary
polyps are able to feed on brine shrimp nauplii and begin growing. Adult size is not reached for many months. Because this study focused on the effects of flow on hair bundles and cnidae in fully developed, adult anemones, the largest anemones were selected for analysis to include only animals in the original cohort and avoid individuals produced either asexually from physal fragments or sexually by embryogensesis.
Statistical analyses
For the progressive study, means for each anemone were calculated
from pooled data for each variable per time point (n=9 fields of view
per time point for density andn=37–70 hair bundles per time point
for morphology). Time courses were statistically analyzed within
treatments for each variable with one-way ANOVA (n=2 anemones
per time point, 20 anemones per time course) and when significance
was found (P≤0.05), further analyzed by apost hocTukey’s honest
significant difference test (Statistica, StatSoft). Time courses were compared across treatments by fitting each time course to a linear
function and comparing slopes using at-test (slope test, Microsoft
Excel). Data are presented as means±s.d. (n=2 anemones per time
point). For the experiment investigating the effects of increasing flow duration on hair bundles, the effects of flow on cnida density, and the reversibility of the flow response, means for each anemone were calculated from pooled data for each variable per time point
(n=6 fields of view per time point for densities of hair bundles and
cnidae and 15–33 hair bundles for morphology). For each variable
at each time point, experimental means were statistically compared
with control means using at-test (n=2 anemones per time point for
each variable, two-tailed, type IIt-test, Microsoft Excel).
RESULTS Light microscopy
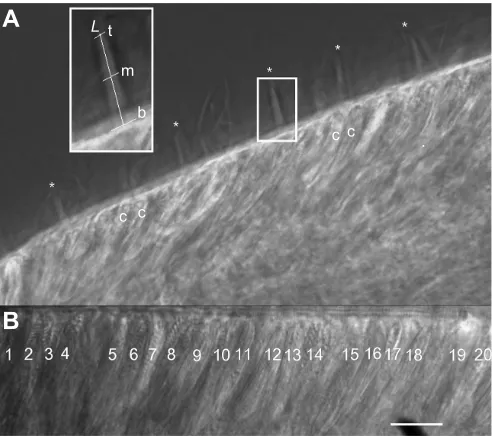
A representative image shown in Fig. 1 depicts tentacles with hair bundles protruding from the surface (Fig. 1A) and cnidae (Fig. 1A, B) within the epidermis. Hair bundles (examples indicated with asterisks) appear as cone-shaped structures formed by stereocilia converging onto a central kinocilium. Cnidae are large intracellular secretory products appearing as elongated, oval-shaped structures within the epidermis. From images as in Fig. 1A, the mean linear density of hair bundles was calculated for each anemone and the mean length and width at the base, middle and tip were calculated from measurements of each hair bundle in focus for each anemone (after enlargement and application of an unsharp mask filter to better resolve the hair bundles; see inset of boxed hair bundle in Fig. 1A
for example). Length (L) was measured as the distance from the base
of the hair bundle to the tip of the longest stereocilia parallel to the long axis of the hair bundle. Widths were measured across the base (nearest to the tentacle surface), middle (halfway to the tip) and tip (at the longest stereocilia) perpendicular to the long axis of the hair bundle. Mean density of cnidae was calculated for each anemone from tentacle images after rotation so that the tentacle surface was parallel to the edge of a field of view, cropping an area of the
epidermis equal to 2500 µm2, and applying an unsharp mask filter
to better resolve the cnidae as shown in Fig. 1B.
Linear density of hair bundles increased with flow
Mean±s.d. linear density of hair bundles per 100 µm of tentacle length is shown for the experimental group exposed to flow for
1 h day−1(Fig. 2A) and for controls not exposed to flow over the
time course (Fig. 2B). Within-treatment analysis of mean hair bundle linear densities over the time course indicates significant
variation in the experimental group (ANOVA,P=0.008) but not in
the control group (P=0.79). Post hoc analysis cross-comparing
linear density at each time point in the experimental group indicates
three statistically different groups of data (Tukey’s HSD,P≤0.03;
Fig. 2A). In particular, mean linear density at day 20 was significantly higher than that at days 2, 4, 6 and 8. Linear density at days 10 through 18 was comparable to that at time points before as well as to day 20. The experimental group time course shows a fairly
good fit to a linear function (R2=0.81) with a slope of 0.08. The
control time course does not show a good fit to a linear function
(R2=0.11) and has a slope of 0.02. Comparison of the slopes across
treatments indicates that the experimental group has a significantly
larger slope than the control (slopet-test,P≤0.006). For reference,
the mean±s.d. linear density from two animals immediately after removal from the mass culture is plotted at day 21 (Fig. 2B).
Length of hair bundles increased with flow
Mean±s.d. length of hair bundles is shown for the experimental
group exposed to flow for 1 h day−1(Fig. 3A) and the control group
not exposed to flow over the time course (Fig. 3B). Within-treatment analysis of mean hair bundle length shows significant
L
A
B
t
m
c c
[image:3.612.316.562.57.276.2]c c b
Fig. 1. Representative digital images of anemone tentacles.(A) From images as depicted here, density and morphology of the hair bundles were measured. Linear density was measured by counting the hair bundles in profile (examples indicated by asterisks) and measuring the linear distance of each tentacle edge. Morphology of hair bundles was measured after digitally enlarging the hair bundle and applying an unsharp mask filter to better resolve the hair bundle as shown in the inset of the boxed hair bundle:L, length; b, base width; m, middle width; t, tip width (ImageJ software). Several cnidae (c) are partially visible within the tentacles epidermis. (B) From images as depicted here, density of cnidae was measured by counting the number of cnidae (indicated by numbers) within an area of tentacle epidermis cropped to 2500 µm2. Prior to cropping, the image was digitally rotated until the tentacle
surface was parallel to the edge of the image and unsharp mask filtering was applied to enhance visualization of the cnidae (ImageJ software). The scale bar in B is 11 µm for B and the entire image in A, and 5 µm for the inset in A.
Journal
of
Experimental
variation in the experimental group (P<0.004) but not in the control
group (P>0.10). Cross-comparisons of mean lengths in the
experimental group indicates seven different groups of data
(P<0.04; Fig. 3A). Hair bundle length at day 18 was significantly
larger than at days 2 through 8. Lengths at days 10 through 16 were comparable to time points before as well as to day 18. Length at day 20 was not significantly different than any of the other time points. The experimental group time course better fits a linear function
(R2=0.61) than the control time course (R2=0.47). Comparison of
the slopes across treatments indicates that the slope of the experimental group at 0.16 is significantly larger than the slope of
the control time course at 0.04 (P≤0.03). For reference, the mean±
s.d. length of hair bundles from two animals immediately after removal from the mass culture is plotted at day 21 (Fig. 3B).
Base width of hair bundles increased with flow
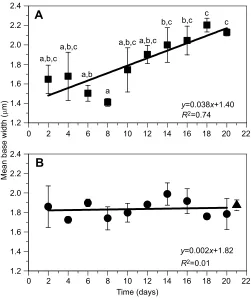
Mean±s.d. widths of bases of hair bundles are shown for the
experimental group exposed to flow for 1 h day−1(Fig. 4A) and the
control group not exposed to flow over the time course (Fig. 4B). Within-treatment analysis indicates significant variation in the
experimental group in base widths over the time course (P<0.003;
Fig. 3A) but not in the control group (P>0.31; Fig. 3B).Post hoc
analysis of the experimental group shows five different groups of data
(P<0.03; Fig. 4A). Base widths of hair bundles were significantly
larger at days 18 and 20 compared with days 6 and 8. Width at day 8 was significantly smaller than at day 14 and all subsequent time points. The experimental group time course has a better fit to a linear
function (R2=0.74) than the control time course (R2=0.01).
Comparison of the slopes across treatments indicates that the slope of the experimental group at 0.04 is significantly larger than the slope
of the control time course at 0.001 (P≤0.002). For reference, the
mean±s.d. base width of hair bundles from two animals immediately after removal from the mass culture is plotted at day 21 (Fig. 4B).
Middle width of hair bundles increased with flow
Mean±s.d. widths across the middle of hair bundles are shown for
the experimental group exposed to flow for 1 h day−1(Fig. 5A) and
the control group not exposed to flow over the time course (Fig. 5B). Within-treatment analysis indicates significant variation in the
experimental group in middle widths over the time course (P<0.002;
Fig. 5A) but not in the control group (P>0.32; Fig. 5B).Post hoc
analysis of the experimental group shows five different groups
of data (P<0.03; Fig. 5A). Middle widths of hair bundles were
significantly larger at days 18 and 20 compared with days 2 through 10. Width at day 12 and 14 was not significantly different than at
A
B
4.5
4.0
a a a a
a,b
a,b
R2=0.081
y=0.89x+2.05
R2=0.11
y=0.015x+2.682 a,b a,b
a,b b
3.5
3.0
2.5
2.0
1.5
1.0
0 2 4 6 8 10 12 14 16 18 20 22
0 2 4 6 8 10
Time (days)
Mean linear density (hair bundles 100
µ
m
–1
)
12 14 16 18 20 22 4.5
4.0
3.5
3.0
2.5
2.0
1.5
[image:4.612.54.298.55.341.2]1.0
Fig. 2. Time course of hair bundle linear density with 1 h day−1flow and without flow.Each data point represents the mean±s.d. hair bundle density (hair bundles 100μm–1;n=2 anemones) from anemones exposed to gentle
flow for 1 h per weekday (A, squares) or not (B, circles). In B, the triangle represents data from size-matched animals immediately removed from the mass cultures for reference (no flow and no sand; arbitrarily plotted at day 21). Within-treatment analysis shows significant variation in hair bundle density in anemones exposed to gentle flow (ANOVA,P=0.008) compared with anemones not exposed to flow (P=0.79). Different lowercase letters in A indicate statistically different groups of data based on Tukey’s HSDpost hoc analysis (P≤0.05). Lines represent a linear fit of each time course (equation andR2value shown). Comparison of the slopes indicates a significantly larger
positive slope in the experimental time course compared with controls (slope t-test,P≤0.006).
A
B 10
9
8
7 a,b a,b
a,b,c
a,b,c,db,c,d
c,d c,d
d
a,b,c,d
a 6
5
10
9
8
7
6
5
0 2 4 6 8 10 12 14 16 18 20 22
0 2 4 6 8 10 12 14 16 18 20 22
R2=0.061
y=0.162x+5.59
R2=0.47
y=0.045x+6.40
Time (days)
Mean length (
µ
m)
Fig. 3. Time course of hair bundle lengths with 1 h day−1flow and without flow.Each data point represents the mean±s.d. hair bundle length (μm;n=2 anemones) from anemones exposed to gentle flow for 1 h per weekday (A, squares) or not (B, circles). In B, the triangle represents data from size-matched animals immediately removed from the mass cultures for reference (no flow and no sand; arbitrarily plotted at day 21). Within-treatment analysis shows significant variation in hair bundle length in anemones exposed to gentle flow (ANOVA,P<0.04) compared with anemones not exposed to flow (P>0.10). Different lowercase letters in A indicate statistically different groups of data based on Tukey’s HSDpost hocanalysis (P≤0.05). Lines represent a linear fit of each time course (equation andR2value shown). Comparison of
the slopes indicates a significantly larger positive slope in the experimental time course compared with controls (slopet-test,P≤0.03).
Journal
of
Experimental
[image:4.612.321.558.56.334.2]time points before or after. Width at day 16 was comparable to all time points except days 6 and 8. The experimental group time
course shows a good fit to a linear function (R2=0.85) as compared
with the control time course (R2=0.01). Comparison of the slopes
across treatments indicates that the slope of the experimental group at 0.02 is significantly larger than the slope of the control time
course at 0.001 (P≤0.003). For reference, the mean±s.d. widths of
hair bundles across the middle from two animals immediately after removal from the mass culture is plotted at day 21 (Fig. 5B).
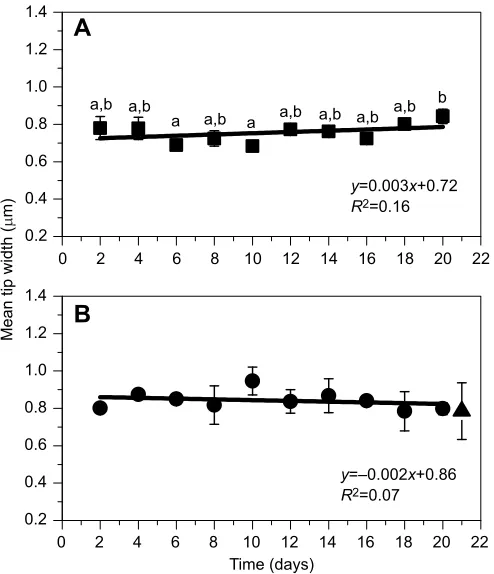
Tip widths of hair bundles were less variable with flow Mean±s.d. widths of tips of hair bundles are shown for the
experimental group exposed to flow for 1 h day−1 (Fig. 6A) and
the control group not exposed to flow over the time course (Fig. 6B). Within-treatment analysis indicates significant variation in the
experimental group in tip widths over the time course (P<0.02;
Fig. 6A) but not in the control group (P>0.45; Fig. 6B).Post hoc
analysis of the experimental group shows three different groups of
data (P<0.03; Fig. 6A). Tip widths of hair bundles were significantly
larger at day 20 compared with at days 6 and 10. Widths at all other time points were comparable. The experimental group time course
does not show a good fit to a linear function (R2=0.16), nor does the
control time course (R2=0.07). Comparison of the slopes across
treatments indicates that the slope of the experimental group at 0.0.003 is not significantly different than the slope of the control time
course at−0.002 (P≥0.18). For reference, the mean±s.d. tip widths of
hair bundles from two animals immediately after removal from the mass culture is plotted at day 21 (Fig. 6B).
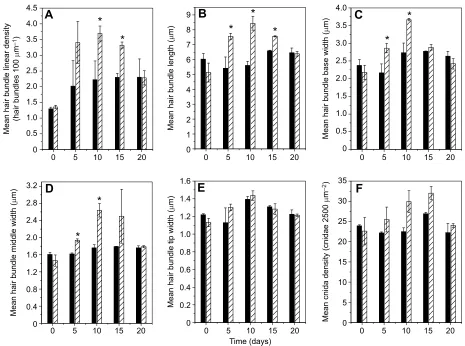
Linear density of hair bundles increased faster with increased duration of flow and decreased to control levels following cessation of flow
Mean±s.d. linear density of hair bundles per 100 µm of tentacle length is shown for the control group (solid bars) not exposed to flow and the experimental group (hatched bars) exposed to flow for
3 h day−1(Fig. 7A). Density of hair bundles was not significantly
different between the two groups prior to the onset of flow (day 0) or after 5 days of flow (day 5). Density of hair bundles was significantly greater after 10 days of flow (day 10, 3.69±0.24 hair
bundles 100μm−1) compared with the control in the absence of flow
(2.22±0.59 hair bundles 100 μm−1, two-tailed, type II t-test,
P<0.05). The density of hair bundles remained significantly
different following cessation of flow for 5 days (day 15, 3.32±
A
a
B
0 2 4 6 8 10 12 14 16 18 20 22
0 2.4
2.2
2.0
1.8 a,b,c
a,b,c
a,b
a,b,c a,b,c
b,c b,c
c c
1.6
1.4
1.2
2.4
2.2
2.0
1.8
1.6
1.4
1.2
2 4 6 8 10 12 14 16 18 20 22
R2=0.01
y=0.002x+1.82
R2=0.74
y=0.038x+1.40
Time (days)
Mean base width (
µ
[image:5.612.49.300.57.355.2]m)
Fig. 4. Time course of hair bundle width at the base with 1 h flow day−1 and without flow.Each data point represents the mean±s.d. base width (μm; n=2 anemones) from anemones exposed to gentle flow for 1 h per weekday (A, squares) or not (B, circles). In B, the triangle represents data from size-matched animals immediately removed from the mass cultures for reference (no flow and no sand; arbitrarily plotted at day 21). Within-treatment analysis shows significant variation in base width in hair bundles from anemones exposed to gentle flow (ANOVA,P<0.003) compared with anemones not exposed to flow (P>0.31). Different lowercase letters in A indicate statistically different groups of data based on Tukey’s HSDpost hocanalysis (P≤0.05). Lines represent a linear fit of each time course (equation andR2value shown).
Comparison of the slopes indicates a significantly larger positive slope in the experimental time course compared with controls (slopet-test,P≤0.002).
A
a
B
0 2 4 6 8 10 12 14 16 18 20 22
0 0.4 0.6 0.8 1.0 1.2 1.4 1.6 1.8
a,b a,b a,b
a,b,c
b,c c c
a,b,c
a 2.0
0.4 0.6 0.8 1.2
1.0 1.4 1.6 1.8 2.0
2 4 6 8 10 12 14 16 18 20 22
Time (days)
Mean middle width (
µ
m)
R2=0.85
y=0.025x+0.99
R2=0.012
y=0.001x+1.26
Fig. 5. Time course of hair bundle width at the middle with 1 h day−1flow and without flow.Each data point represents the mean±s.d. middle width (n=2 anemones) from anemones exposed to gentle flow for 1 h per weekday (A, squares) or not (B). In B, the triangle represents data from size-matched animals immediately removed from the mass cultures for reference (no flow and no sand; arbitrarily plotted at day 21). Within-treatment analysis shows significant variation in middle width in hair bundles from anemones exposed to gentle flow (ANOVA,P<0.002) compared with anemones not exposed to flow (P>0.31). Different lowercase letters in A indicate statistically different groups of data based on Tukey’s HSDpost hocanalysis (P≤0.05). Lines represent a linear fit of each time course (equation andR2value shown).
Comparison of the slopes indicates a significantly larger positive slope in the experimental time course compared with controls (slopet-test,P≤0.003).
Journal
of
Experimental
[image:5.612.317.564.59.348.2]0.10 hair bundles 100μm−1for the experimental group compared
with 2.30±0.12 hair bundles 100 μm−1 for the control group,
P<0.02). At 10 days following cessation of flow (day 20),
the density of the experimental group (2.28±0.23 hair bundles
100 μm−1) was comparable to that of the control group (2.30±
0.58 hair bundles 100μm−1,P>0.97).
Hair bundle length, base width and middle width increased faster with increased duration of flow and decreased to control levels following cessation of flow
Mean±s.d. hair bundle length (Fig. 7B), base width (Fig. 7C) and middle width (Fig. 7D) are shown for the control group (solid bars) not exposed to flow and the experimental group (hatched bars)
exposed to flow for 3 h day−1. All of these hair bundle dimensions
were comparable prior to the onset of flow (day 0,P>0.23 in all
cases). Hair bundle length after 5 days of flow (7.55±0.21μm) was
significantly greater than length in the absence of flow (5.42±0.75
μm,P<0.04, Fig. 7B). In addition, the base width of hair bundles
after 5 days of flow (day 5, 2.86±0.13μm) was significantly greater
than that in the absence of flow (2.16±0.25μm,P<0.04; Fig. 7C).
Likewise, the middle width of hair bundles after 5 days of flow
(1.94±0.04μm) was greater than that in the absence of flow (1.62±
0.03μm,P<0.01; Fig. 7D). After 10 days of flow (day 10), hair
bundle length remained significantly greater in the experimental
group (8.45±0.46 μm; Fig. 7B) compared with the control group
(5.61±0.28μm,P<0.01). Base width remained significantly greater
after 10 days of flow (3.67±0.03μm; Fig. 7C) compared with the
control group in the absence of flow (2.74±0.27 μm, P<0.03).
Middle width of hair bundles also remained significantly greater
after 10 days of flow (2.64±0.16 μm; Fig. 7D) compared with
controls (1.76±0.07μm,P<0.01). After 5 days following cessation
of flow (day 15), hair bundle lengths remained significantly greater
in the experimental group (7.56±0.04μm; Fig. 7B) compared with
the control group (6.58±0.05 μm,P<0.01). However, base width
(Fig. 7C) and middle width (Fig. 7D) were comparable after 5 days following cessation of flow (day 15) between the experimental group
and the control group (P>0.15 in all cases). By 10 days following
cessation of flow (day 20), hair bundle length (Fig. 7B), base width (Fig. 7C) and middle width (Fig. 7D) were comparable between
experimental groups and control groups (P>0.25 in all cases).
Hair bundle tip width and cnida density were not significantly affected by flow
Mean±s.d. hair bundle width at tips is shown for the control group (solid bars) not exposed to flow and the experimental group (hatched bars) exposed to flow for 3 h per day (Fig. 7E). Tip widths at all time points were not significantly different between the experimental
groups and the control groups (P>0.10 in all cases). Densities of
cnidae prior to flow and after 5 days of flow were comparable
between groups (P>0.30 in all cases; Fig. 7F). Density of cnidae
approached statistical significance (P<0.07) after 10 days of flow and
remained near significance after 5 days following cessation of flow
(P<0.06). After 10 days following cessation of flow, cnida density
was more comparable to that of controls (P>0.30).
DISCUSSION
This study provides evidence that mechanosensory hair bundles of anemones are reversibly modified by periodic, moderate water current. In particular, hair bundle mechanoreceptors increased in linear density along the tentacle and changed in morphology after exposure to flow. Morphological changes included lengthening of hair bundles and widening of the bases and middles. Increasing frequency of flow from
1 to 3 h day−1decreased the time required to produce the flow response
from 20 to 10 days. Flow responses elicited with 3 h of flow per day returned to control levels after 10 days following cessation of flow. There was an apparent increase in density of cnidae with flow, but this was not statistically significant.
Because the hair bundles in anemones are involved in detecting prey as well as regulating discharge of cnidae to successfully capture prey, changes in hair bundles likely affect the predation capabilities of the anemones. In the natural habitat of the anemone, increased water current likely carries potential prey into the vicinity of the anemones. Hence, periodic increased water flow may serve as a mechanical stimulus indicating the presence of a food source nearby. In this scenario, detection of flow, possibly by the hair bundle mechanoreceptors, would induce growth of new hair bundles as well as growth in dimensions of existing hair bundles. An increase in length of the bundles could result from actin polymerization within the stereocilia, similar to what occurs following chemoreceptor activation (Watson and Roberts, 1995). Although elongation of the large-diameter stereocilia would contribute to the increase in length of the hair bundles because they are the tallest stereocilia present in the bundle, the increased base and middle width could be attributed to changes to the shorter, small-diameter stereocilia. Specifically, elongation and untwisting of existing small-diameter stereocilia or
A
a
B
0 2 4 6 8 10 12 14 16 18 20 22
0 2 4 6 8 10 12 14 16 18 20 22
0.4
0.2 0.6 0.8
a,b a,b
a,b a a,b a,b a,b a,b
1.0 1.2 1.4
0.2 0.4 0.6 0.8 1.0 1.2 1.4
R2=0.16
y=0.003x+0.72
R2=0.07
y=–0.002x+0.86
Time (days)
Mean tip width (
µ
m)
[image:6.612.52.299.57.344.2]b
Fig. 6. Time course of hair bundle width at the tip with 1 h day−1flow and without flow.Each data point represents the mean±s.d. tip width (μm;n=2 anemones) from anemones exposed to gentle flow for 1 h per weekday (A, squares) or not (B, circles). In B, the triangle represents data from size-matched animals immediately removed from the mass cultures for reference (no flow and no sand; arbitrarily plotted at day 21). Within-treatment analysis shows significant variation in tip width in hair bundles from anemones exposed to flow (ANOVA,P<0.02) compared with anemones not exposed to flow (P>0.45). Different lowercase letters in A indicate statistically different groups of data based on Tukey’s HSDpost hocanalysis (P≤0.05). Lines represent a linear fit of each time course (equation andR2value shown).
Comparison of the slopes indicates no significant difference between the experimental time course and the control time course (slopet-test,P≥0.18).
Journal
of
Experimental
addition of new small-diameter stereocilia would result in wider bases and middles of hair bundles. A previous study indicates that hair bundles change from a twisted configuration in controls to a configuration in which the small-diameter stereocilia lie more parallel to the long axis of the hair bundle after chemoreceptor activation (Mire and Nasse, 2002). Prior to elongation, the small-diameter stereocilia lean at a more acute angle against the large-diameter stereocilia and become more parallel to the large-diameter stereocilia with elongation. The tip width of hair bundles is the least affected during elongation because the tallest stereocilia are in the central core of the hair bundle and consist of parallel, large-diameter stereocilia. In the presence of flow, it may be necessary for the anemone to increase its effectiveness at sensing prey by tuning of the hair bundles and increasing density of the hair bundles.
Though the widths continued to increase over the time course in the presence of flow, the increased length of the hair bundles appeared to drop off at 20 days of 1 h flow per day. Twenty days of flow was chosen based on a pilot study we performed suggesting that hair bundles on anemones exposed to intermittent flow for several weeks may be longer than those not exposed to flow. A longer time course would be needed to determine whether the decrease in length persists, and if so, this may indicate that there is an optimal period of time for the greatest amount of growth to occur. However, looking at hair bundle linear density and length data together from both experiments
provides evidence that the decrease in mean length at 20 days may be due to a larger number of hair bundles that are in the process of newly developing or repairing and have not yet reached maximal length. In support of this interpretation is the increase in linear density of hair
bundles also occurring at 20 days of flow at 1 h day−1. Increasing
duration of flow to 3 h day−1 also supports the interpretation that
changes to existing hair bundles is a faster response, occurring within 5 days, than increasing linear density of hair bundles, occurring within
10 days. Presumably between 5 and 10 days of 3 h day−1of flow, new
hair bundles have adequate time to grow to maximum length. Interestingly, base width and middle width of hair bundles return to control levels faster after cessation of flow, occurring within 5 days, than either length or density of hair bundles. These data suggest that small-diameter stereocilia arising from hair cells along the periphery of hair bundles may be dismantled first after cessation of flow, followed by dismantling of the large-diameter stereocilia arising from the central sensory neuron. Once the large-diameter stereocilia are dismantled, those hair bundles would disappear, resulting in decreased density of hair bundles along the tentacle. It is not known at this time whether the observed increase in hair bundle linear density with flow is due to differentiation of new hair cells and sensory neurons or to a more complete repair of hair bundles from existing cells.
The tensegrity model proposes that physical stress on cells may cause changes in gene expression through integrin receptors (Ingber,
0 0
0 0.4 0.8 1.2 1.6 2.0 2.4 2.8 3.2 0.5 1.0 1.5 2.0 2.5 3.0 3.5 4.0
0 0.5 1.0 1.5 2.0 2.5 3.0 3.5 4.0 4.5
0 0.2 0.4 0.6 0.8 1.0 1.2 1.4 1.6
0 5 10 15 20 25 30 35 1
2 3 4 5 6 7 8 9
5 10 15 20 0 5 10 15 20 0 5 10 15 20
0 5 10 15 20 0 5 10
Time (days)
15 20 0 5 10 15 20
*
A
*
*
*
B
*
*
*
C
*
D
*
E
F
Mean hair bundle middle width (
µ
m)
Mean hair bundle linear density
(hair bundles 100
µ
m
–1
)
Mean hair bundle
tip width (
µ
m)
Mean hair bundle length (
µ
m)
Mean cnida density (cnidae 2500
µ
m
–2
)
M
ean hair bundle base width (
µ
m)
[image:7.612.74.539.55.401.2]0
Fig. 7. Flow responses with increased duration of flow and reversibility with cessation of flow.(A) Hair bundle linear density; (B) hair bundle length; (C) hair bundle base width; (D) hair bundle middle width; (E) hair bundle tip width; and (F) cnida density. Data are presented as means±s.d. for the control groups (solid bars) not exposed to flow and the experimental groups (hatched bars) exposed to 3 h day−1of flow at time points as follows: prior to flow (day 0), after 5 days
of flow (day 5), after 10 days of flow (day 10), after 5 days following cessation of flow (day 15) and after 10 days following cessation of flow (day 20). Statistical significance between control and experimental data at each time point is indicated by an asterisk (two-tailed, type IIt-test, *P<0.05).
Journal
of
Experimental
2008).Nematostella vectensishas integrin genes that are expressed differentially during regeneration (Gong et al., 2014). It remains to be seen whether moderate water flow causes an upregulation of gene
expression inN. vectensisand, if so, whether integrins are involved.
Alternatively, periodic feeding events likely damage hair bundles and induce repair. Repair depends on secreted proteins carried in mucus (Watson et al., 1998). Water flow may physically aid in transporting repair proteins to damaged hair bundles and thus increasing the number of recognizable hair bundles. Although the water flow was moderate (animals were not dislodged from the sand) and occurred for only 1 h each weekday, it is possible that it caused some damage to the hair bundles and induced repair mechanisms. Because repair of hair bundles involves changes to the actin cytoskeleton within stereocilia as well as replacing linkages between stereocilia, widths of the hair bundles may be altered during the repair process (Watson and Mire, 2001). Increasing the density of the hair bundles along the tentacles as well as making the hair bundles stronger by increasing the widths at the base and middle may serve to acclimate anemones to the flow environment. Owing to similarities in hair bundles between sea anemones and those in the vertebrate acoustico-lateralis systems, the increase in hair bundle density in response to the increased water flow could potentially be applicable to remediation of vertebrate hair bundle loss (Watson et al., 1997; Mire and Watson, 1997; Watson and Mire, 1999). A study in vertebrates shows that intense water-jet stimulation of hair bundles causes a loss of rigidity owing to changes to the internal structure of the stereocilia (Duncan and Saunders, 2000). Intense stimulation in auditory hair cells leads to hair cell death and hearing loss. The use of invertebrate models to inform hearing and vestibular disorders and potential therapies has several advantages over the use of vertebrate models (Christie and Eberl, 2014). Perhaps low-level, periodic mechanical stimulation could prove useful in maintaining a healthy population of auditory and vestibular hair cells.
Acknowledgements
The authors thank anonymous reviewers for insightful suggestions that improved the original study.
Competing interests
The authors declare no competing or financial interests.
Author contributions
Conceptualization: P.M.; Methodology: A.C., A.D., P.M.; Formal analysis: A.C., P.M.; Investigation: A.C., A.D.; Resources: P.M.; Data curation: A.C., A.D.; Writing -original draft: A.C.; Writing - review & editing: P.M.; Supervision: P.M.; Project administration: P.M.
Funding
This research received no specific grant from any funding agency in the public, commercial or not-for-profit sectors.
References
Christie, K. W. and Eberl, D. F.(2014). Noise-induced hearing loss: new animal
models.Curr. Opin Otolaryngol. Head Neck Surg.22, 374-383.
Darling, J. A., Reitzel, A. R., Burton, P. M., Mazza, M. E., Ryan, J. F., Sullivan,
J. C. and Finnerty, J. R.(2005). Rising starlet: the starlet sea anemone,
Nematostella vectensis.BioEssays27, 211-221.
Di Palma, F., Holme, R. H., Bryda, E. C., Belyantseva, I. A., Pellegrino, R.,
Kachar, B., Steel, K. P. and Noben-Trauth, K.(2001). Mutations in Cdh23,
encoding a new type of cadherin, cause stereocilia disorganization in waltzer, the mouse model for Usher syndrome type 1D.Nat. Genet.27, 103-107.
Duncan, R. K. and Saunders, J. C.(2000). Stereocilium injury mediates hair
bundle stiffness loss and recovery following intense water-jet stimulation.J. Comp. Physiol. Ser. A186, 1095-1106.
Gong, Q., Garvey, K., Qian, C., Yin, I., Wong, G. and Tucker, R. P.(2014). Integrins
of the starlet sea anemoneNematostella vectensis.Biol. Bull.227, 211-220.
Ingber, D. E.(2008). Tensegrity-based mechanosensing from macro to micro.Prog.
Biophys. Mol. Biol.97, 163-179.
Layden, M. J., Rentzsch, F. and Röttinger, E.(2016). The rise of the starlet sea
anemoneNematostella vectensisas a model system to investigate development and regeneration.Wiley Interdiscip. Rev. Dev. Biol.5, 408-428.
Martindale, M. Q., Pang, K. and Finnerty, J. R.(2004). Investigating the origins of
triploblasty: mesodermal gene expression in a diploblastic animal, the sea anemone
Nematostella vectensis(phylum, Cnidaria; class, Anthozoa).Development131,
2463-2474.
Mire, P. and Nasse, J.(2002). Hair bundle motility induced by chemoreceptors in
anemones.Hear. Res.163, 111-120.
Mire, P. and Watson, G. M.(1997). Mechanotransduction of hair bundles arising
from multicellular complexes in anemones.Hear. Res.113, 224-234.
Mire, P., Nasse, J. and Venable-Thibodeaux, S. (2000). Gap junctional
communication in the vibration-sensitive response of sea anemones. Hear. Res.144, 109-123.
Mire-Thibodeaux, P. and Watson, G. M.(1994). Morphodynamic hair bundles
arising from sensory cell/supporting cell complexes frequency-tune nematocyst discharge in sea anemones.J. Exp. Zool.268, 282-292.
Repass, J. J. and Watson, G. M.(2001). Anemone repair proteins as a potential
therapeutic agent for vertebrate hair cells: facilitated recovery of the lateral line of blind cave fish.Hear. Res.154, 98-107.
Tang, P.-C., Smith, K. M. and Watson, G. M.(2016). Repair of traumatized
mammalian hair cells via sea anemone repair proteins.J. Exp. Biol. 219, 2265-2270.
Watson, G. M. and Hessinger, D. A.(1989). Cnidocyte mechanoreceptors are tuned
to the movements of swimming prey by chemoreceptors.Science243, 1589-1591.
Watson, G. M. and Mire, P.(1999). A comparison of hair bundle mechanoreceptors in
sea anemones and vertebrate systems.Curr. Top. Dev. Biol.43, 51-84.
Watson, G. M. and Mire, P.(2001). Reorganization of actin during repair of hair
bundle mechanoreceptors.J. Neurocytol.30, 895-906.
Watson, G. M. and Roberts, J.(1995). Chemoreceptor-mediated polymerization
and depolymerization of actin in hair bundles of sea anemones.Cytoskeleton30, 208-220.
Watson, G. M., Mire, P. and Hudson, R. R.(1997). Hair bundles of sea anemones
as a model system for vertebrate hair bundles.Hear. Res.107, 53-66.
Watson, G. M., Mire, P. and Hudson, R. R.(1998). Repair of hair bundles in sea
anemones by secreted proteins.Hear. Res.115, 119-128.
Watson, G. M., Pham, L., Graugnard, E. M. and Mire, P.(2008). Cadherin 23-like
polypeptide in hair bundle mechanoreceptors of sea anemones.J. Comp. Physiol. A194, 811-820.
Watson, G. M., Mire, P. and Kinler, K. M.(2009). Mechanosensitivity in the model
sea anemoneNematostella vectensis.Mar. Biol.156, 2129-2137.