Original Article
Effects of pressure-controlled ventilation-volume
guaranteed on airway pressure, oxygenation, and
postoperative complications in one-lung ventilation:
a prospective randomized-controlled study
Cengiz Sahutoglu, Seden Kocabas, Fatma Zekiye Askar
Department of Anesthesiology and Reanimation, Ege University School of Medicine, Izmir, Turkey
Received January 26, 2018; Accepted July 6, 2018; Epub December 15, 2018; Published December 30, 2018
Abstract: The aim of this study was to investigate the effects of pressure-controlled ventilation-volume guaranteed (PCV-VG) and volume-controlled ventilation (VCV) mode on oxygenation, respiratory parameters, and complications in patients with one-lung ventilation (OLV) that underwent lobectomies. A prospective randomized-controlled study was conducted from July 2016 to February 2017. All participants underwent one-lung ventilation and lobectomies. Eighty patients were randomly divided into two groups, group 1 (PCV-VG) and group 2 (VCV). Data including demo-graphic characteristics of the patients, intraoperative mechanical ventilation parameters, intraoperative and post-operative oxygenation parameters, and complications were recorded. Two ventilation modes were compared. The mean age of all patients, of whom 70% (n=56) were male, was 56.5±14.9 (range: 20 to 75) years. PaO2 values were
significantly higher only in PCV-VG modes with two-lung ventilation (P=0.033). However, remaining values including PH, PaCO2, PaO2, PaO2/FiO2, and lactate were similar (P>0.05). Most patients with a significant increase in airway
pressure (Plato pressure >35 cm H2O) were in the VCV mechanical ventilation mode. Fiberoptic bronchoscopy was
used to confirm tube location (group 1: One patient vs group 2: Ten patients, P=0.007). There were no significant
differences in postoperative complication rates between the groups (P>0.05). In conclusion, the use to PCV-VG
ventilation mode in one-lung ventilation resulted in a significant decrease in peak airway pressure. However, it did
not increase intra- and postoperative oxygenation or reduce complications.
Keywords: One-lung ventilation, lobectomy, volume-controlled ventilation, pressure-controlled ventilation-volume guaranteed, airway pressure, complications
Introduction
Hypoxemia may develop in certain patients. One-lung ventilation (OLV) can be safely imple-mented to expand the field of vision and facili -tate surgical manipulation during lung surger-ies. The main cause of hypoxemia is pulmonary shunt due to a single non-ventilated lung [1]. Volume-controlled ventilation (VCV) is often used as a mechanical ventilation mode, when OLV is implemented. Increased airway pressure in ventilated lungs causes blood flow to be directed to the non-ventilated lung and the rate of pulmonary shunts further increases, leading to a deepening of hypoxemia [2]. On the oth- er hand, pressure-controlled ventilation (PCV) mode is used as a preventive ventilation
provide tidal volume adjusted by the lowest inspiratory pressure with the use of decelerat-ed current [8, 9].
This present study aimed to investigate the effects of PCV-VG mode on oxygenation, need for manipulation, and postoperative complica-tions in patients undergoing OLV, although the null hypothesis states that PCV-VG mode is equally efficacious as VCV.
Materials and methods
Study protocol was approved by the Scientific Ethics Committee (Decision No: 16-7/35). Written informed consent was obtained from each patient. This study was conducted in accordance with the principles of the De- claration of Helsinki.
This prospective randomized-controlled study included a total of 80 patients, aged 18-75 years, undergoing one-lung ventilation and lo- bectomies between July 2016 and February 2017. Patients were excluded if they had severe renal, cardiac, and hepatic impairment, previ-ous thoracic surgery, and were defined as less than 50% of the predicted values of forced expiratory volume in 1 and forced vital capacity.
[image:2.612.93.372.74.321.2]cultation and fiberoptic bronchoscopy. Main-tenance anesthesia was provided with desflu -rane (0.5-1 MAC), remifentanil (0.25-0.5 µg/ kg/min), and propofol (1 mg/kg/h), added to oxygen and air mixture as 50% FiO2. Patients were given mechanical ventilatory support (Da- tex-Ohmeda Avance Anesthesia Machine, GE Healthcare, Madison WI USA) at a tidal volume of 7 mL/kg predicted body weight with 4 cm H2O positive end expiratory pressure (PEEP) support to achieve an inspiration/expiration ratio of 1:2 and 50% FiO2. Patients were then maintained in the lateral position with a central venous catheter inserted into the internal jugu-lar vein of the operation side. During OLV, tidal volumes of patients were reduced to 4 mL/kg and respiratory frequency was increased up to 18-20 (patients were targeted as ETCO2 35-45 mmHg and oxygen saturation over 92%). Blood pressure, central venous pressure (CVP), arte-rial blood gas values, compliance, peak ins- piratory pressure (PIP), plateau pressure (PP), mean airway pressure (Pmean), baseline, 15th and 60th min OLV, and 15 minutes after two lung ventilation (TLV) following lobectomies were recorded. In addition, postoperative 6th and 24th-hour arterial blood gas analyses were recorded. In cases of intraoperative hypoxemia,
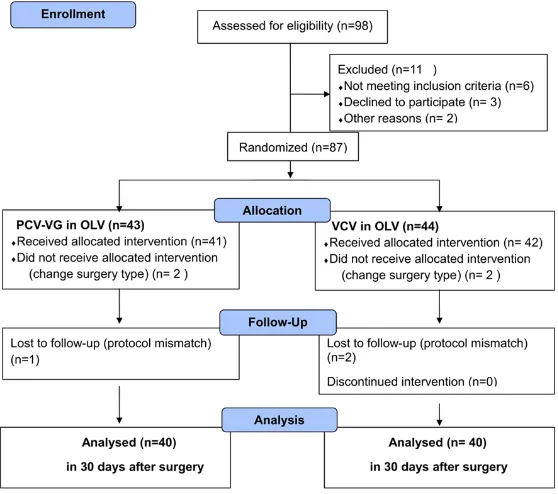
Figure 1.CONSORT diagram showing the flow of patients enrolled in the
study. OLV; one-lung ventilation, PCV-VG; pressure-controlled ventilation-volume guaranteed, VCV; ventilation-volume-controlled ventilation.
-certain maneuvers were performed for patient optimization including re-adjustment of tidal volume, increasing oxygen ratio, increasing PEEP, oxygen insufflation in non-ventilated lungs, fiberoptic confirmation of location of the intubation tube, and intermittent two-lung ven-tilation. Recruitment maneuvers (constant air-way pressure of 35 cm H2O to the whole lung for 10 seconds) were performed two times by mechanic ventilators when transitioning from OLV to TLV and at the end of operation. Restrictive fluid therapy was applied during intraoperative and postoperative periods (Ba-sed on patient weight, using the 4/2/1 rule to estimate preoperative fluid losses. All patients were applied with 500 mL crystalloid loading during the first hour. Maintenance fluid therapy was titrated as mean arterial blood pressure (MAP) above 65 mmHg (ephedrine was admin -istered to treat refractory hypotension), heart rate (HR) 60-100 bpm, CVP 5-10 mmHg, and urine output above 0.5 mL/kg/h. Postoperative fluid therapy was calculated as 1000 mL/ m2/24 h in the first postoperative day). Intercostal block (bupivacaine 100 mg), diclof-enac 75 mg via intramuscular, paracetamol 1 g intravenous, and tramadol 100 mg intraven- ous were administered to all patients for anal-gesia. Maintenance analgesia was provided by patient-controlled analgesia (total tramadol as much as 400 mg as needed) and with diclofe-nac and paracetamol, as necessary (visual analog scale <4). Sugammadex was used for reversal neuromuscular blockade and all pa-
complications: pneumonia, re-intubation, tra-cheotomy, acute respiratory distress syndrome, respiratory failure (requires mechanic ventila-tion), air leak up 5 days, bronchopleural fistula; Cardiac complications: heart failure, arrhyth-mias (that requires treatment), myocardial in- farction; Renal dysfunction: 0.3 mg dL-1 increase in creatinine levels compared to baseline val-ues or need for renal replacement treatment or dialysis; Neurological complications: stroke (cerebral hemorrhage, infarct); Gastrointestinal complications: ileus, mesenteric ischemia, he- morrhage; Hematological complications: plate -let count of <75000/mm3 and an elevation of the prothrombin or partial thromboplastin time >1.5 times the control value; Sepsis: presence of infection and concurrent systemic inflamma -tory response syndrome; Revision: defined as the need for re-operation for any reason. The primary outcome of this study was to deter-mine the relationship between PCV-VG mecha-nical ventilation mode and intraoperative/pos-toperative arterial oxygenation. The secondary outcome was to control whether PCV-VG could decrease intraoperative lung pressure, need for manipulation, and postoperative complicati-ons. The anesthesiologist that performed the anesthesia did not take part in the collection of postoperative data.
Statistical analysis
[image:3.612.91.400.98.251.2]Considering previous studies [7, 10, 11], the sample size was calculated as 80 patients (to tients were extubated in the operation room. Data including demo-graphic characteristics, hemodynamic and respi-ratory parameters, int- raoperative mechanical ventilation parameters, intra- and postoperati- ve oxygenation parame-ters, duration of hospi-talization, and intra- and postoperative complica-tions were recorded. Bo-th mechanical ventilato-ry modes were compar- ed. Postoperative com-plications were defined as follows. Respiratory Table 1. Demographic and clinical data of patients
(independent-sam-ples t-test and Chi-square test)
All Patients
(n=80) PCV-VG (n=40) (n=40)VCV valuep
Age (Year) 56.5±14.9 54.6±16.2 58.5±13.4 0.246
Gender (Female/Male) 24/56 11/29 13/27 0.808
BMI (Kg/m2) 25.9±4.2 25.1±3.7 26.7±4.5 0.086
Additional disease (No/Yes) 26/54 17/23 9/31 0.103
Operation Side (Right/Left) 49/31 26/14 23/17 0.647
Diagnosis (Bronchiectasis/Cancer) 10/70 5/35 5/35 0.999
Cigarette smoking (No/Yes) 24/56 13/27 11/29 0.808
FEV1 (Litres) 2.5±0.7 2.6±0.6 2.46±0.8 0.357
FVC (Litres) 3.5±0.8 3.6±0.7 3.4±0.9 0.326
FEV1/FVC (%) 74.2±10.3 76±11 72.4±9.3 0.124
Table 2. Intraoperative blood gas and lactate values of the patients (Mann-Whitney U-test and independent-samples t-test)
PH PaCO2 PaO2 PaO2/FiO2 Lactate
Baseline PCV-VG 7.43±0.05 36±5 209±75 411±144 1.18±0.5
VCV 7.42±0.04 34±4 222±87 421±132 1.20±0.5
OLV15 PCV-VG 7.42±0.05 36±6 93±66 146±90 1.15±0.5
VCV 7.42±0.04 34±5 100±53 169±88 1.05±0.4
OLV60 PCV-VG 7.42±0.05 35±5 81 (54-238) 131 (54-264) 1.20±0.4
VCV 7.42±0.04 33±6 92 (52-316) 168 (61-395) 1.25±0.6
TLV PCV-VG 7.39±0.06 38±5 227 (78-481)* 369±125 1.51±0.8
VCV 7.39±0.05 35±6 168 (96-384) 332±80 1.75±0.8
Postoperative
6th h PCV-VG 7.34±0.05 39±7 116±32 233±63 1.83±0.8
VCV 7.32±0.05 38±8 118±42 235±85 1.75±0.8
24th h PCV-VG 7.38±0.04 36±4 109±32 217±64 1.8 (0.9-4)
VCV 7.38±0.05 34±4 113±38 227±77 1.5 (0.9-3)
Abbreviations: OLV15; 15th-min one-lung ventilation, OLV60; 60th-min one-lung ventilation, TLV; two-lung ventilation after lobec-tomy, PCV-VG; pressure-controlled ventilation-volume guarantee, VCV; volume-controlled ventilation. Data were presented in mean ± standard deviation or median (min-max). *:P=0.033.
detect a difference of 40±5 in O2 index during OLV and compare complications). Statistical analysis was performed using SPSS version 21.0 software (IBM Corp., Armonk, NY, USA). Data are expressed as mean ± standard devia-tion, median, and percentages (%). Normal dis-tribution of data was analyzed using the Ko- lmogorov-Smirnov test. Chi-squared and Fi- sher’s exact tests were used for categorical variables, whereas independent-samples t- tests and Mann-Whitney U-tests were used for quantitative variables. P values of <0.05 are considered statistically significant.
Results
Ninety-eight patients were enrolled in the study, with eighty patients completing it (Figure 1). The mean age of all patients, of whom 70% (n=56) were male, was 56.5±14.9 (range: 20 to 75) years. Of these patients, 87.5% and 12.5% underwent lobectomies due to lung tumors and bronchiectasis, respectively. Of these, 40% had more than one systemic disease, while 32.5% did not have any comorbid conditions. Twenty patients had chronic obstructive pulmonary disease, 20 patients had hypertension, 6 pa- tients had coronary artery disease, 3 patients had cerebrovascular disease, 11 patients had diabetes mellitus, 8 patients had multinodular goitre, and 56 patients were smokers (P>0.05). Demographic and baseline characteristics of
the patients are shown in Table 1. Evaluation of intra- and postoperative first 24-hour blood gases demonstrated that the PaO2 values were significantly higher with TLV only in the PCV-VG mode. However, remaining values including PH, PaCO2, PaO2, PaO2/FiO2, and lactate were simi-lar (Table 2).
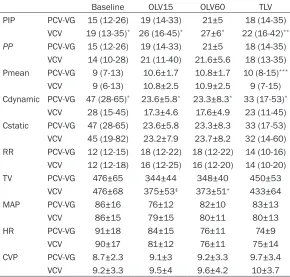
Table 3. Intraoperative airway pressure and compliance values of the patients (Mann-Whitney U-test and independent-samples t-test)
Baseline OLV15 OLV60 TLV
PIP PCV-VG 15 (12-26) 19 (14-33) 21±5 18 (14-35)
VCV 19 (13-35)* 26 (16-45)* 27±6* 22 (16-42)**
PP PCV-VG 15 (12-26) 19 (14-33) 21±5 18 (14-35)
VCV 14 (10-28) 21 (11-40) 21.6±5.6 18 (13-35)
Pmean PCV-VG 9 (7-13) 10.6±1.7 10.8±1.7 10 (8-15)***
VCV 9 (6-13) 10.8±2.5 10.9±2.5 9 (7-15)
Cdynamic PCV-VG 47 (28-65)* 23.6±5.8* 23.3±8.3* 33 (17-53)*
VCV 28 (15-45) 17.3±4.6 17.6±4.9 23 (11-45)
Cstatic PCV-VG 47 (28-65) 23.6±5.8 23.3±8.3 33 (17-53)
VCV 45 (19-82) 23.2±7.9 23.7±8.2 32 (14-60)
RR PCV-VG 12 (12-15) 18 (12-22) 18 (12-22) 14 (10-16)
VCV 12 (12-18) 16 (12-25) 16 (12-20) 14 (10-20)
TV PCV-VG 476±65 344±44 348±40 450±53
VCV 476±68 375±53‡ 373±51+ 433±64
MAP PCV-VG 86±16 76±12 82±10 83±13
VCV 86±15 79±15 80±11 80±13
HR PCV-VG 91±18 84±15 76±11 74±9
VCV 90±17 81±12 76±11 75±14
CVP PCV-VG 8.7±2.3 9.1±3 9.2±3.3 9.7±3.4
VCV 9.2±3.3 9.5±4 9.6±4.2 10±3.7
Abbreviations: OLV15; 15th-min one-lung ventilation, OLV60; 60th-min one-lung ventilation, TLV; two-lung ventilation after lobectomy, PCV-VG; pressure-controlled ventilation-volume guaranteed mode, VCV; volume-controlled ventilation, PIP; Peak inspiratory pressure (cm H2O), PP; plateau pressure (cm H2O), Pmean; mean airway pressure (cm H2O), C; Compliance (mL/cm H2O), RR; respiratory rate/min, TV; tidal volume (mL), MAP; mean arterial pressure (mmHg), HR; Heart rate (bpm), CVP; cen -tral venous pressure (mmHg). Data were presented in mean ± standard deviation or median (min-max). *P<0.001; **P=0.002; ***P=0.001; ‡=0.006; +=0.017.
were in the VCV mechanical ventilation mode. Fiberoptic bronchoscopy was used to confirm tube location (group 1, n=1 vs group 2, n=10, P=0.007). Despite several interventions, inter-mittent two-lung ventilation was performed in eight patients with continuous high levels of desaturation or airway pressure (group 1, n=1 vs group 2, n=7; P=0.057).
At least one major complication was reported in 16% of the patients (n=13). Respiratory complications occurring in 12.5% (n=10) of the patients was the most frequent complication. Five of the patients developed a clinical pre-sentation of acute renal failure, while none received dialysis. Only one of the patients (1.3%) died, due to multi-organ failure (Table 4). Discussion
The present study demonstrates that PCV-VG ventilation leads to a significant decrease in
PaO2 values were reported, whereas there was a significant decrease in PIP and Pmean val -ues. PCV-VG mode led to an increase in oxygen-ation values in 67.5% of the patients during OLV, reportedly due to reduced pulmonary vas-cular resistance and reduced rates of shunts by PCV-VG mode. Only one of the patients ven-tilated in the VCV mode was reported to devel-op hypoxemia. On the other hand, Song et al. [9] compared PCVG and VCV in their study of 27 patients. In their study, PCV-VG increased genation in 63% patients and decreased oxy-genation in 33% patients. However, there was no difference between the two modes in terms of oxygenation. PIP values were found to be significantly lower in PCV-VG mode, whereas Pmean values were reported to be higher. Therefore, the dynamic compliance of the PCV-VG group was reported to be higher, whereas static compliance was found to be lower. In another study, Boules et al. [10] compared PCV
PIP. However, it has no effect on intra- and postoperative oxygenation values and do- es not reduce complica- tions.
Volume control mode is the most common mode of me- chanical ventilation, during OLV. Recent publications have shown that PCV mode improves oxygenation dur-ing OLV [5, 6, 12]. In PCV mode, decelerated current is used while tidal volume is not constant. Also, pressure is applied and the chest wall is altered according to com-plications [4-7]. PCV-VG mo- de, which combines the VCV and PCV modes, is a more novel mode. Attempts have been made to provide the tidal volume adjusted by the lowest inspiratory pressure with the use of decelerated current [2].
and PCV-VG modes. The authors found that air-way pressure, ETCO2, PaO2, and oxygenation indexes were similar in both modes. This condi-tion was suggested to be associated with a decelerating flow pattern in both modes. Lin et al. [13] also compared VCV, PCV, and PCV-VG modes in 66 patients older than 65 years. They demonstrated that PIP was significantly lower, whereas PaO2 was significantly higher in PCV and PCV-VG groups, compared to the VCV group. However, comparison of PCV and PCV-VG modes revealed no significant differences between the groups. This can be attributed to the fact that neuromuscular blockade and sedation levels keep surgical manipulations under control and do not allow sudden changes in lung compliance. In addition, although the patients were over 65-years-old, their lung function was not poor. Therefore, the authors concluded that PCV-VG mode was unable to ful-fill the advantages that could automatically compensate for compliance and resistance changes. The authors, however, suggested that PCV-VG mode should be considered as the pri-mary ventilation mode during OLV.
Results of the present study were similar. PCV-VG mode showed an all-time decrease in PIP values and an increase in dynamic compliance. The increase in dynamic compliance in PCV-VG mode was attributed to the decelerated flow applied. Mean airway pressure was also found to be increased significantly in PCV-VG mode only during the TLV period. As a result, an increase in the PaO2 values was found during
respiratory modes on patient outcomes, with different patient groups, such as obese patients.
[image:6.612.92.339.96.254.2]In a prospective cross-over study, Dion et al. [15] compared VCV, PCV, and PCV-VG modes in 20 patients undergoing bariatric surgery. Although PCV and PCV-VG modes were re- ported to reduce PIP values, no contribution to intraoperative hemodynamics, oxygenation, and anesthetic agent consumption were report-ed in their study. Comparison of PCV and PCV-VG modes demonstrated no differences in PIP values and all patients were able to be venti-lated with PCV and PCV-VG modes without any problems. However, one of the patients venti -lated in the VCV mode required modal change. In four patients, it was necessary to reset the inspiratory time to keep PIP at ≤40 cm H2O. In the present study, baseline FiO2 was 50% in all patients. FiO2 increases were reported to be necessary in half of the patients. Fiberoptic bronchoscopy and intermittent TLV were more likely to be necessary in VCV mode due to excessive increase in airway pressure during OLV. The fact that there was less manipulation in patients ventilated in the PCV-VG mode facili-tated the duty of the anesthetist and surgeon. In recent years, several studies have suggested that PCV ventilation mode is preferred due to the reduction of airway pressure and reduction of oxygenation by reducing shunts [5, 6, 12]. Table 4. Distribution of postoperative complications
(Chi-squared and Fisher’s exact tests)
Complications All Patients n (%) PCV-VG n (%) VCV n (%) p value At least one complication 13 (16.3) 10 (25) 3 (7.5) 0.066
Respiratory 10 (12.5) 7 (17.5) 3 (7.5) 0.311
Cardiac 1 (1.25) 0 (0) 1 (2.5) >0.999
Renal 5 (6.25) 4 (10) 1 (2.5) 0.359
Neurological 1 (1.25) 1 (2.5) 0 (0) >0.999
Gastrointestinal 2 (2.5) 2 (5) 0 (0) 0.494
Hematological 2 (2.5) 1 (2.5) 1 (2.5) >0.999
Sepsis 2 (2.5) 1 (2.5) 1 (2.5) >0.999
Revision 1 (1.25) 1 (2.5) 0 (0) >0.999
Mortality 1 (1.25) 0 (0) 1 (2.5) >0.999
Some patients had more than one complication. Abbreviations: PCV-VG; pressure-controlled ventilation-volume guarantee, VCV; volume-con-trolled ventilation, n; number of patients, %; percent.
this period. Improved oxygenation was also attributed to the moderate increase in the Pmean provided by PCV-VG mode. However, oxygenation pa-rameters were found to be similar dur-ing the postoperative period, as pati- ents were extubated, since mode ap- plication was discontinued.
Lin et al. [5] and Tugrul et al. [6] reported that PCV mode developed arterial oxygenation dur-ing OLV in patients with older and lower res- piratory function tests. Senturk et al. [12] also used PCV + 4 cm H2O PEEP with VCV + 0 PEEP, suggesting that oxygenation in the PCV + 4 cm H2O PEEP group improved. In addition, several studies have demonstrated that, although PCV mode during thoracic surgery decreased airway pressure, it did not correct oxygenation [5, 7, 16].
The present study included patients with good respiratory function test results. Only 27.5% of the patients were in the >65-year-old patient group. However, this study did not include mor -bid obese patients and only 15% of the pati- ents were overweight. There was no relation-ship between advanced age and overweight and postoperative complications. There were also no significant differences in oxygenation values between the groups. The increase in PaO2 during TLV was attributed to the mode- rate increase in Pmean due to PCV-VG mode. All patients underwent a minimum of 4 cm H2O PEEP, which was continued throughout surgery. PEEP was reported to prevent the development of postoperative atelectasis and hypoxemia, resulting in complications similar in the two study groups.
However, there were some limitations to this study. First, patients with poor respiration and a history of serious disease were excluded from the study. Second, a pulmonary artery catheter was introduced. Shut rates and mixed venous saturations were not compared between the groups.
In conclusion, although the use of PCV-VG ven-tilation during OLV resulted in a significant decrease in peak airway pressure, it did not contribute to intra- and postoperative oxygen-ation values. It also did not reduce complica-tions. However, less manipulation with intraop -erative mechanical ventilation and double-lu- men tubing in patients ventilated during PCV-VG mode facilitated the duty of the anesthesi-ologist. Further large-scale studies are required to confirm these findings and to establish a definite conclusion.
Acknowledgements
This research did not receive any specific grants from funding agencies in public, commercial, or not-for-profit sectors.
Ethics Committee approval was received for this study from the Clinical Research Ethical Committee of Ege University School of Me-dicine. Written informed consent was obtained from patients participating in this study. Disclosure of conflict of interest
None.
Address correspondence to: Dr. Cengiz Sahutoglu, Department of Anesthesiology and Reanimation,
Ege University School of Medicine,Ege Universitesi
Tip Fakultesi, Anesteziyoloji ve Reanimasyon AD,
Bornova 35100, Izmir, Turkey. Tel: +902323902143;
Fax: +902323397687; E-mail: csahutoglu@yahoo. com
References
[1] Lohser J. Evidence-based management of one-lung ventilation. Anesthesiol Clin 2008; 26: 241-272.
[2] Pu J, Liu Z, Yang L, Wang Y and Jiang J. Applica-tions of pressure control ventilation volume guaranteed during one-lung ventilation in tho-racic surgery. Int J Clin Exp Med 2014; 7: 1094-1098.
[3] Prella M, Feihl F and Domenighetti G. Effects of short-term pressure-controlled ventilation on gas exchange, airway pressures, and gas distribution in patients with acute lung injury/ ARDS: comparison with volume-controlled ven-tilation. Chest 2002; 122: 1382-1388. [4] Cadi P, Guenoun T, Journois D, Chevallier JM,
Diehl JL and Safran D. Pressure-controlled ventilation improves oxygenation during lapa-roscopic obesity surgery compared with
vol-ume-controlled ventilation. Br J Anaesth 2008;
100: 709-716.
[5] Lin F, Pan L, Huang B, Ruan L, Liang R, Qian W
and Ge W. Pressure-controlled versus volume-controlled ventilation during one-lung ventila-tion in elderly patients with poor pulmonary function. Ann Thorac Med 2014; 9: 203-208. [6] Tugrul M, Camci E, Karadeniz H, Senturk M,
Pembeci K and Akpir K. Comparison of volume controlled with pressure controlled ventilation
during one-lung anaesthesia. Br J Anaesth
1997; 79: 306-310.
[7] Unzueta MC, Casas JI and Moral MV.
Pressure-controlled versus volume-Pressure-controlled ventilation during one-lung ventilation for thoracic sur-gery. Anesth Analg 2007; 104: 1029-1033. [8] Boules N and Ghobrial H. Efficiency of the new
[9] Song SY, Jung JY, Cho MS, Kim JH, Ryu TH and Kim BI. Volume-controlled versus
pressure-controlled ventilation-volume guaranteed mo- de during one-lung ventilation. Korean J Anes-thesiol 2014; 67: 258-263.
[10] Boules N and El Ramely M. Does
pressure-controlled ventilation-volume guaranteed dif-fer from pressure-controlled ventilation in an- esthetized patients. Ain-Shams J Anaesthesiol 2014; 7: 96-100.
[11] Esteban A, Alia I, Gordo F, de Pablo R, Suarez J,
Gonzalez G and Blanco J. Prospective random -ized trial comparing pressure-controlled venti-lation and volume-controlled ventiventi-lation in ARDS. For the Spanish Lung Failure Collabora-tive Group. Chest 2000; 117: 1690-1696. [12] Senturk NM, Dilek A, Camci E, Senturk E,
Orhan M, Tugrul M and Pembeci K. Effects of positive end-expiratory pressure on ventilatory and oxygenation parameters during pressure-controlled one-lung ventilation. J Cardiothorac Vasc Anesth 2005; 19: 71-75.
[13] Lin F, Pan L, Qian W, Ge W, Dai H and Liang Y.
Comparison of three ventilatory modes during one-lung ventilation in elderly patients. Int J Clin Exp Med 2015; 8: 9955-9960.
[14] Assad OM, El Sayed AA and Khalil MA. Com-parison of volume-controlled ventilation and pressure-controlled ventilation volume guaran-teed during laparoscopic surgery in trendelen-burg position. J Clin Anesth 2016; 34: 55-61. [15] Dion JM, McKee C, Tobias JD, Sohner P, Herz D,
Teich S, Rice J, Barry ND and Michalsky M.
Ventilation during laparoscopic-assisted bar-iatric surgery: volume-controlled, pressure-controlled or volume-guaranteed pressure-reg-ulated modes. Int J Clin Exp Med 2014; 7: 2242-2247.