Abstract—The present paper examines a merger of two companies—one in Japan and the other in the US—with respect to the assimilation of corporate culture differences, particularly quality culture. The study aims to clarify the root cause of declines in quality ratings from customers after the merger despite maintaining products and services as they were before the merger, and whether cultural differences affect decision-making in a newly merged company. We examined the relationship between actions taken to assimilate quality culture and the resulting quality ratings given by customers, and analyzed the time required to address quality incidents and the progress of cultural assimilation. A total of 301 incidents in the 5 years after the merger were analyzed, focusing on the time requited to resolve the incidents. Our empirical analysis revealed that the extent of cultural assimilation is associated with the speed of organizational decision-making and the quality ratings given by customers.
Index Terms—Corporate culture, cross-border M&A, organizational decision-making, quality culture
I. INTRODUCTION
Corporate consolidations through mergers and acquisitions (M&As) are often performed for the purposes of strategic expansion or to strengthen the resource base or competitiveness of the companies involved through diversification and/or efficiency improvement. Although many M&As involve companies in the same country, cross-border M&As are becoming more common, recently reaching a proportion of 40% of all M&As [1], [2].
Many of the issues related to cross-border M&As are similar to those for domestic M&As. However, due to the different economic, institutional, and cultural structures encountered during international consolidation, cross-border M&As present unique challenges [3], [4]. Even in domestic M&As, cross-border issues often arise when operations are located in different countries [5]. In today’s global business environment, issues related to cross-border M&As are becoming increasingly common.
While M&A activities have been steadily increasing over the last 10 years, few have been successful in achieving synergistic expectations. Several studies have reported that
Manuscript received June 19, 2009
Satoshi Ito. Author is with the Graduate School of Innovation Management, Tokyo Institute of Technology, Minatoku, Tokyo 108-0023 Japan (phone: +81-90-3336-1039; fax: +81-465-36-9703; e-mail: [email protected]). Toshihiko Tamiya. Author is a former senior management of Company C, Kanagawa-ken, Japan (e-mail: [email protected]).
Shuzo Fujimura. Author is a professor of the Graduate School of Innovation Management, Tokyo Institute of Technology, Minatoku, Tokyo 108-0023 Japan (e-mail: [email protected]).
approximately 50-80% of all M&As fail to meet their expectations [6], [7], [8]. Differences in corporate culture have been suggested as the major cause for the failure of M&A activities to effectively achieve synergy [8], [9].
In addition, various studies have pointed out that the quality of products and services is greatly influenced by a company’s corporate culture [10], [11], therefore, it is likely that changes in quality ratings before and after a merger indicate corresponding changes in corporate culture. However, examination of productivity or/and financial indices often dominates discussion of the result of M&As, while the impacts on quality ratings are neglected. Moreover, few studies of cultural differences in corporate consolidations have investigated the influence of organizational decision-making.
The present study aimed to clarify the following: first, the root cause of deterioration in company performance (particularly as reflected in quality ratings given by customers) after the merger of two companies; and second, whether cultural differences between the two companies influenced organizational decision-making and, ultimately, company performance. The goal of the study is to assess how internal cultural inconsistency is associated with the speed of organizational decision-making and quality ratings from customers through empirical analysis of corporate cultural assimilation during a cross-border M&A.
II. CORPORATECULTURE AND QUALITY CULTURE
Schein [12] defines corporate culture as ‘A pattern of basic assumptions—invented, discovered, or developed by a given group as it learns to cope with its problems of external adaptation and internal integration.’ This definition is generally accepted to be the foundation of organizational culture theory. Schein divides cultural elements into three levels by their level of visibility. Level 1, the most visible level, comprises “Artifacts and Creations”. Although it is easy to observe Level 1, understanding of Level 2, “Values”, is necessary to see the meaning of Level 1 and the interrelation between Levels 1 and 2. Level 2 comprises values, norms, and principles shared by organization members. When a solution pathway has repeated success, this value becomes further ingrained in the culture until it finally becomes accepted as the de-facto response or behavior. Eventually this progresses to Level 3, “Basic Assumptions”. At this level, assumptions are not questioned or challenged, and actually guide the behavior of members on how to perceive, think, and feel about various topics. Level 3 is considered to be the essence of corporate culture.
Assimilation of Quality Culture and Its Effect
– An Empirical Study of A Cross-Border M&A
We define quality culture to be one aspect of corporate culture related to the quality of products and services, and it can be divided into three hierarchical levels on the basis of the definition by Schein. Figure 1 illustrates the three-layer model of quality culture.
For the purpose of the present study, Level 1 of quality culture is called the “Quality System,” which is composed of quality-related organization structures, processes, and specifications that allow the quality of products and services to be maintained and improved. Level 2 is “Common Quality Values,” the organization’s values with respect to quality, which are articulated as operation norms and guidelines for quality-related situations and incentive plans for quality achievements. Level 3, “Accepted Quality Basis,” comprises implicit assumptions that determine the approach taken during decision-making. When quality culture is discussed in the context of corporate consolidations, it is crucial to delve deeper into Levels 2 and 3.
III. HYPOTHESES
Previous studies demonstrated that corporate culture could affect company performance. Osada et al. [11] generated a management system model to clarify the way in which corporate culture influences value creation within a company. The results showed that corporate culture plays a key role in not only financial performance but also in the quality of products and services. Fairfield-Sonn [10] argues that bringing about change in quality culture is even more important to quality improvement than tools and techniques. Thus, it is clear that quality culture exerts a significant influence on quality.
When two companies with different corporate cultures are merged into a new company, cultural friction inevitably arises, creating internal inconsistency in quality culture until the completion of assimilation. This cultural inconsistency may affect quality ratings and organizational decision-making. We hypothesize that the extent of quality culture assimilation is associated with these dependent variables in determining company performance, as follows:
Hypothesis 1: The extent of quality culture assimilation is positively associated with quality ratings given by customers. We supposed that the decline in quality ratings following a merger might be caused by inconsistencies in quality culture that negatively influenced customers’ evaluations.
Hypothesis 2: The extent of quality culture assimilation is negatively associated with organizational decision-making time in quality-related situations.
Decision-making is a vital function of an organization. We supposed that inconsistencies in quality culture might lengthen the decision-making process in quality-related situations.
IV. METHODS
The first and second authors were members of a company that was established as the result of a merger between two companies, one from Japan and the other from the US. Thereby the present study was based mostly on the empirical analysis of data performed with the consent of the company. After the merger, a significant deterioration in company performance, including quality ratings and market share, was observed, even though the products and services of both companies were maintained in the same form as before the merger. We concluded that cultural differences might have played a role in this deterioration in performance. Our study thus focused on the process and effects of cultural assimilation within the company during and after the merger.
A. Quarterly Business Review (QBR) Score
To obtain study data, we used at an external evaluation figure of quality ratings provided in customers’ quarterly business reviews (QBRs). Since the company specialized in electronic equipment used for customers’ system products and the majority of sales were to businesses, most customers held QBRs with each key supplier every quarter. In QBRs, the customer and supplier discuss the supplier’s performance in the previous term and the business plan for the next term. The customer evaluates the supplier’s performance in several categories: quality, technology, price, and supply. This evaluation is called the QBR score, and the quality rating is the most significant element of the QBR score in most cases. We examined a QBR record of a newly merged company and weighed it with internal quality data, and analyzed the relationship between quality ratings and management actions taken to assimilate corporate culture. We then attempted to determine the causes of deterioration in quality ratings and the overall effects of cultural assimilation.
B. Quality Incident (QI) Process
We also aimed to analyze the time required to address quality incidents (QIs) within the company. QIs are critical issues related to the quality of products and services, and in most cases, irregular or non-routine decision-making is required in order to effectively address these issues. A record of QIs covering the 5 years following the merger was investigated by measuring the time required to address each QI. By analyzing the relationship between the time required to address QIs and the progress of cultural assimilation, we attempted to reveal whether organizational decision-making after the merger was influenced by internal cultural inconsistency.
Level 3 (Basic Assumptions)
Accepted Quality Basis: unconscious assumptions upon which quality culture is based
Level 2 (Values)
Common Quality Value: operation norms and guidelines, incentive plans
Level 1 (Artifacts and Creations )
Quality System: organization, processes, specifications
Quality Culture
( Corporate Culture by Schein )
Level 3 (Basic Assumptions)
Accepted Quality Basis: unconscious assumptions upon which quality culture is based
Level 2 (Values)
Common Quality Value: operation norms and guidelines, incentive plans
Level 1 (Artifacts and Creations )
Quality System: organization, processes, specifications
Quality Culture
[image:2.595.49.289.127.235.2]( Corporate Culture by Schein )
V. CASE STUDY
The case discussed herein is a corporate consolidation of two traditional companies, one based in Japan (Company A, the purchasing company) and the other in the US (Company B, the selling company), to form a new company (Company C). Before the merger, both Companies A and B were compound enterprises engaged in a variety of business fields. Both companies had an electronic equipment business division, which was the object of this consolidation. Notable characteristics of this case are as follows. Company A purchased a division of Company B that had a similar product line but a larger business scale and a longer business history. Their corporate cultures seemed to be very different in addition to unlike countries where each company based in.
A. Establishment of a Quality System
Integrating the two divisions from Companies A and B to form Company C required the establishment of three levels of quality culture. A quality system, the top level of quality culture, was the first target in the integration phase. A team was formed to work on a post-merger integration (PMI) project in which the two organizations were integrated and combined into a single organization. After examining the differences in the roles and responsibilities of quality assurance (QA) in each company, the team found a crucial difference—QA was centralized in Company A but decentralized in Company B. The team determined that a consistent QA system covering all aspects of product development through production and customer support was necessary. Then, the team selected Company A’s model and endorsed a centralized QA system for the integration plan. As there were clear differences in the quality culture of Companies A and B at Level 1, it follows that there should also be differences in Levels 2 and 3. However, assimilation of Levels 2 and 3 of quality culture was not attempted until the second year after the merger, since the first priority was given to organizational integration (unification of the quality system, Level 1 of quality culture) to ensure a smooth business transition.
B. Quality Ratings given by Customers
Each quarter, customers gave quality ratings to Company C in a QBR; this rating included a quality ranking as a relative index and quality point score as an absolute index. However, because the rules used to assign the quality point score were often arbitrarily changed by customers, this score was not adequate for evaluating trends in quality ratings. Therefore, we used the quality ranking, a relative index of company C’s quality among various other competitors, together with an external index given by customers based on their assessments of the performance of Company C. The quality ranking decreased just after the merger from average rank 1.5 to 3.0 during the first year. In addition, the market share of a key product showed a similar decreasing trend. It may seem that this decrease in the quality ranking was the leading cause of the corresponding decline in market share decline; however, as analysis of market share is beyond the scope of this study, we focus only on quality rating. Since the
original product lines of Companies A and B were quite similar and many regular customers were shared between the two companies, the deterioration of quality ratings observed after the merger must be attributable to factors other than product mix or product portfolio.
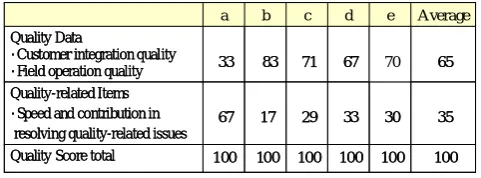
[image:3.595.307.548.416.505.2]The criteria on which the performance of Company C was evaluated varied from customer to customer. Although evaluation items were quite similar among customers, each customer weighted the evaluation items differently. Table 1 shows the weighting of quality evaluation items by five major customers (a-e) at that time. Quality rating was determined by the total score for each item multiplied by the corresponding weighting. Evaluation items for company performance included two measures: Quality Data and Quality-related Items. Here, Quality Data included customer integration quality* and field operation quality**, which were quantitative and objective measures. Quality-related Items, such as speed and efficiency in addressing quality incidents such as complaints, were non-quantitative measures based on the perceptions of customers. As shown in Table 1, it is evident that more than one third of the quality rating depended on items other than Quality Data, and the supplier management strategy for each customer is reflected in scoring rules and weighting for each item. It is also clear that customers evaluated the entirety of supplier’s quality culture (Levels 1 through 3). To identify the cause of the decrease in quality ratings, both Quality Data and Quality-related Items need to be examined.
C. Causes of Deterioration in Quality Rankings
During the initial period after the merger, quality evaluations for Company C were primarily for products originally developed or in progress of being developed by either Company A or Company B. The first product developed entirely by Company C became available about 2 years after the merger. The Quality Data of products carried over from Companies A and B did not deteriorate after the merger, and the difference between those was small. And there was no increase in the number of QIs. In addition, two of authors were in the position to know that there was no evidence that any competitors had preeminently improved the quality of their products. Thus, the factor that either the quality of Company C worsened or that of other suppliers improved was rejected.
*Customer integration quality: This is a measure of the number of failures detected in the customers’ products due to integration problems as products of Company C were eventually integrated into customers’ final products.
** Field operation quality: This is a measure of the number of failures in customers’ products during field operation.
100 29 71 c
100 33 67 d
35 30 17
67
Quality-related Items
・Speed and contribution in resolving quality-related issues
100 100 100
100
Quality Score total
65 70 83
33
Quality Data
・Customer integration quality
・Field operation quality
Average e
b a
100 29 71 c
100 33 67 d
35 30 17
67
Quality-related Items
・Speed and contribution in resolving quality-related issues
100 100 100
100
Quality Score total
65 70 83
33
Quality Data
・Customer integration quality
・Field operation quality
Average e
b a
Because evaluation of Quality-related Items was based on customers’ perception, analysis of this evaluation is difficult. However, we were able to extract valuable information from the opinions expressed by customers. At QBRs during the first and second year after the merger, customers made the following comments (collected by one of authors, who attended the meetings):
- Responses and actions were slow.
- Sales seem to have a higher priority than quality. - Organizations seem to be a silo-ed structure.
- Attitude seems to be like neither Company A nor Company B, and it became worsen.
These negative perceptions revealed conflicting cultural issues within Company C that directly affected the evaluation of Quality-related Items in the QBR criteria. Thus, it is reasonable to suppose that Quality-related Items, rather than Quality Data, contributed to the observed decline in quality rankings.
Based on the above examinations, the decrease in quality ranking observed after the merger can be considered to be a result of following factors:
1) The performance of Company C (as perceived by customers) worsened relative to other suppliers due to slowed responses to customer inquiries and an increase in the time required to address complaints and other quality-related issues. Although quantitative Quality Data remained stable, evaluations of Quality-related Items declined significantly.
2) Company C’s attitude towards quality, related to Levels 2 and 3 of quality culture, became inconsistent, which caused customers to distrust the company.
D. Actions for Assimilation of Quality Culture
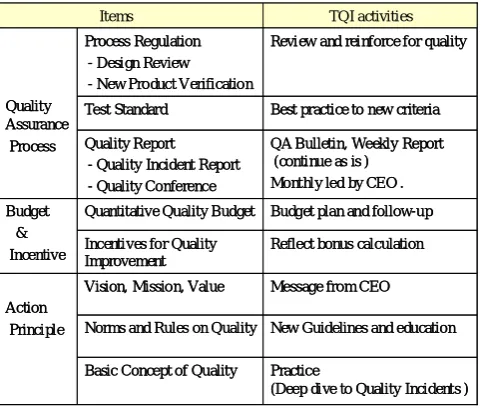
In response to the observed decrease in quality rankings, Company C introduced an initiative to address corporate culture and quality improvements in the second year after the merger. This initiative, called Total Quality Initiative (TQI), focused on optimizing corporate culture and the structure of all related organizations to achieve superior quality. Table 2 shows the activities of TQI.
Workgroups in each field of technology development, product development, manufacturing, customer support, and
cultural establishment were organized. In addition, a TQI office that reported directly to the CEO was formed to lead all TQI activities. Upper management urged all employees to contribute to the establishment of an integrated quality culture, particularly Levels 2 and 3, by sending the clear message that “the CEO has designated ‘Quality’ as a core pillar of our management strategy. We are moving to reshape this company as a quality-driven institution.” In addition to quality system-related items such as “Quality Assurance Process”, other action items such as “Budget & Incentive” and “Action Principle” were expected to accelerate the assimilation of Levels 2 and 3 of quality culture.
VI. RESULTS AND DISCUSSION
A. Transition of Quality Ranking, Testing of Hypothesis 1 Quality rankings of Company C began to show an increasing trend in Q2 of the second year and a large improvement in Q2 of the third year after the merger (Figure 2). Around the fourth year after the merger, Company C regained a level of quality ranking equal to that of Companies A and B before the merger. What was the dominant factor in improvement in quality ranking? Since QBR score was based on the company’s performance during the preceding quarter, the rise in Q2 of the third year is the result of performance during Q1 of the same year. The quality assurance process was strengthened not for products carried over from before the merger but for new products developed after consolidation. The volume shipments of new products were after Q3 of the third year. Therefore, the products evaluated at Q2 of the third year were products carried over from before the merger and there was no evidence of the large improvement in the Quality Data of those products. Since the quality ranking is a relative index, it is also possible that the failure of other suppliers in quality of their products resulted in the observed improvement in Company C’s quality rankings. However, to cause such a large jump (3.0 to 1.5 at Q2 of the third year), several suppliers would need to exhibit appreciable decreases in quality during the same period. No such situation was confirmed, even though two of the authors were capable of obtaining this information. Based on these considerations, the increasing in the quality ranking of Company C was likely caused primarily by improvements in the factors as described in the section V-C. Consequently, we suppose that this improvement was caused by the assimilation of quality culture, particularly Levels 2 and 3. That is, cultural assimilation allowed Company C to establish consistent quality attitudes, which in turn led to improved response to QIs such as critical failures and complaints, and subsequent recovery quality ranking. Further increase in quality ranking may be attributed to improvements in technology, product development, and quality assurance processes made possible by TQI activities. The point here is that the assimilation of Levels 2 and 3 of quality culture was associated with quality ranking and could possibly allow Company C to make further improvements in quality. Thus, Hypothesis 1 was accepted.
Message from CEO Vision, Mission, Value
Budget plan and follow-up Quantitative Quality Budget
Reflect bonus calculation Incentives for Quality
Improvement Budget
&
Incentive
New Guidelines and education Norms and Rules on Quality
Action
Principle
Practice
(Deep dive to Quality Incidents ) Basic Concept of Quality
Review and reinforce for quality Process Regulation
- Design Review - New Product Verification Quality
Assurance Process
Items TQI activities
QA Bulletin, Weekly Report (continue as is )
Monthly led by CEO . Quality Report
- Quality Incident Report - Quality Conference
Best practice to new criteria Test Standard
Message from CEO Vision, Mission, Value
Budget plan and follow-up Quantitative Quality Budget
Reflect bonus calculation Incentives for Quality
Improvement Budget
&
Incentive
New Guidelines and education Norms and Rules on Quality
Action
Principle
Practice
(Deep dive to Quality Incidents ) Basic Concept of Quality
Review and reinforce for quality Process Regulation
- Design Review - New Product Verification Quality
Assurance Process
Items TQI activities
QA Bulletin, Weekly Report (continue as is )
Monthly led by CEO . Quality Report
- Quality Incident Report - Quality Conference
[image:4.595.48.289.555.759.2]Best practice to new criteria Test Standard
B. Effects of Cultural Assimilation on Decision-making We have shown that quality culture assimilation might play a prominent role in the improvement in quality ranking. For this reason, an index of measurement of the extent of cultural assimilation would be valuable in the management of integration processes in the context of corporate consolidation.
What is the mechanism by which the cultural assimilation leads to improvement in quality ratings given by customers? We suppose that problems such as slow responses and actions are relieved by quicker decision-making during unexpected events. Here, we propose Hypothesis 2: cultural assimilation may hasten organizational decision-making. To verify this hypothesis, we analyzed the time required to address QIs in Company C during the 5 years after the merger. When QIs occur, irregular or non-routine decision-making is often required, and all relevant sections must be involved to resolve a QI. Therefore, it is reasonable to suppose that the total time required to resolve a QI represents the sum of the time required for decision-making in each relevant section.
C. Analysis of the Time Required to Address QIs, Testing of Hypothesis 2
The QA bulletin reports the status of each QI and the actions taken to address the incident. In Company C, one QA bulletin was issued to all relevant managers and executives for each QI. The QA bulletin may not be unique to Company C (similar reporting mechanisms are used in other companies that deploy ISO quality management system). The following items were included in the QA Bulletin: QI title, issue date, publisher / approver, severity rating, customer name, product name, occurrence date, problem summary, cause (if known), and action plan. As the QA bulletin is event-driven, it must be issued as promptly as possible. The action plan given in the QA bulletin must be tracked periodically until the QI is completely resolved. In Company C, the action plan was tracked until resolution of
the QI in a weekly report issued by QA. Therefore, the time required to address each QI can be measured by analyzing the QA bulletin and corresponding weekly reports. Figure 2 shows the number of QA bulletins (equal to No. of QIs) issued in the 5 years after the merger. It is clear that the total number of QIs maintained an increasing trend even after the quality ratings given by customers began to improve in the second through the third year after the merger. The number of QIs that occurred at customer site also showed a similar increasing trend. Thus, the number of QIs does not seem to negatively affect quality ratings.
The database of QA bulletins and weekly reports for Company C included a total of 301 QIs. The parameter, “Time required to resolve QI” was extracted and analyzed for each QI. This is the time elapsed from the occurrence of the QI to the final resolution of the QI. This depends on the efficiency of all relevant sections, including QA, engineering, manufacturing, shipping, customer support, and others that might be required to address an individual QI. The time required to resolve QIs is shown in Figure 2. The results of the present analysis were based on the following assumptions, which were derived from the situation of Company C:
a) The number and skill level of company employees involved the QI process did not change significantly after the merger. Thus, Company C’s ability to resolve QIs remained almost consistent.
b) Since engineers from both Companies A and B had experience addressing QIs, a learning curve theory for QIs is not applicable in this case.
c) Although QIs vary in difficulty and complexity, the statistical average time series shows the trends that allow us to interpret changes in decision-making time.
In order to resolve a QI, all related sections must contribute. Therefore, the time required to resolve QIs depends on the decision-making efficiency of all related sections.
In the first year after the merger, an increasing tendency in the time required to resolve QIs was observed (Figure 2). It is 0
20 40 60 80 100
Q4 Q1 Q2 Q3 Q4 Q1 Q2 Q3 Q4 Q1 Q2 Q3 Q4 Q1 Q2 Q3 Q4 Q1 Q2 Q3 Q4
[image:5.595.75.530.65.266.2]1st year 2nd year 3rd year 4th year 5th year
Figure 2. Quality ranking and QIs Q1:1stquarter,Q2:2nd qurter,Q3:3rd quarter,Q4:4t h quart er
N
o
.
o
f
Q
Is
,
T
im
e
r
e
q
u
ie
d
t
o
r
es
o
lv
e
Q
Is
(i
n
d
e
x
f
ig
u
re
)
1.0
1.5
2.0
2.5
3.0
3.5 Qu
a
li
ty
r
a
n
k
in
g
(
a
v
er
a
g
e
o
rd
e
r)
QIs that occurred at customer site QIs: others
Time required to resolve QIs
Quality ranking
No. of QIs
0 20 40 60 80 100
Q4 Q1 Q2 Q3 Q4 Q1 Q2 Q3 Q4 Q1 Q2 Q3 Q4 Q1 Q2 Q3 Q4 Q1 Q2 Q3 Q4
1st year 2nd year 3rd year 4th year 5th year
Figure 2. Quality ranking and QIs Q1:1stquarter,Q2:2nd qurter,Q3:3rd quarter,Q4:4t h quart er
N
o
.
o
f
Q
Is
,
T
im
e
r
e
q
u
ie
d
t
o
r
es
o
lv
e
Q
Is
(i
n
d
e
x
f
ig
u
re
)
1.0
1.5
2.0
2.5
3.0
3.5 Qu
a
li
ty
r
a
n
k
in
g
(
a
v
er
a
g
e
o
rd
e
r)
QIs that occurred at customer site QIs: others
Time required to resolve QIs
Quality ranking
likely that the distinct corporate cultures of Companies A and B had not yet been fully assimilated at that time, resulting in conflicts and a longer decision-making time, in turn prolonging the time required to resolve QIs. However, after a company-wide quality initiative (TQI) in Q2 of the second year after the merger, the time required to solve QIs decreased by 50% in one year. It is reasonable to presume that this decrease was caused by quicker decision-making in all relevant sections due to assimilation of quality culture facilitated TQI activities. In the latter half of the third year after the merger, Company C was able to reach the stable range in the time required to solve QIs that was almost same as the normal range of Company A before the merger. Presumably this was around the time when Company C achieved complete assimilation of quality culture.
Furthermore, a strong correlation was observed between the time required to resolve QIs and quality rankings given in QBRs (correlation coefficient, .77; Figure 3). All the data of quality ranking was shifted one term before to synchronize the data of the time required to resolve QIs upon the comparison.
A regression analysis shows that the correlation is statistically significant at the 1% significance level.
The time required to solve QIs reflects the time required for decision-making by all relevant sections and, by extension, the extent of assimilation of quality culture among these sections. Consequently, the extent of assimilation of quality culture was associated with the speed on the organizational decision-making. Thus, Hypothesis 2 was accepted; that is, by monitoring the time required to address quality-related incidents, the extent of quality culture assimilation can be estimated. This would be useful in the management of integration processes for a new company formed through the consolidation of companies with different cultural backgrounds.
VII. CONCLUSIONS
The present paper presented a specific case of corporate consolidation and examined the processes behind the progress of integration after the merger, focusing on quality culture. We drew the following conclusions from the gathered data:
1) The extent of assimilation of Levels 2 and 3 of quality culture is positively associated with quality ratings given by customers, as customers usually evaluate quality based not only on quantitative quality data but also on the speed of
company responses to customer inquiries and actions taken in addressing quality-related incidents. Higher assimilation is associated with higher quality ratings.
2) The extent of assimilation of Levels 2 and 3 of quality culture is negatively associated with organizational decision-making time in quality-related situations. Higher assimilation is associated with lower decision-making time.
3) The extent of assimilation of quality culture can be estimated by measuring the time required to resolve quality-related incidents.
4) Integration of Level 1 of quality culture is not sufficient to achieve complete assimilation—measures forassimilation of Levels 2 and 3 must be taken in the early stages (for example, PMI) of corporate consolidation.
In the management of a company established through the consolidation of separate companies with different corporate cultures, an action plan for smooth assimilation of corporate culture, including Levels 1 through 3 of quality culture, is crucial.
Since the present study is based on the analysis of one specific case, the objection might be raised that the conclusions are not be applicable to other cases. However, we believe that our practical approach and the conclusions obtained herein offer a new perspective on the topic of corporate culture assimilation. Directions for future research include questionnaire surveys of Company C that will enable us to enforce the conclusions obtained in the present study, as well as investigations of other cases as compared with the present case.
REFERENCES
[1] M. A. Hitt, J. S. Harrison, and R. D. Ireland, Mergers and Acquisitions:
A Guide to Creating Value for Stakeholders, New York: Oxford Univ.
Press, 2001.
[2] K. Shimizu, M. A. Hitt, D. Vaidyanath, and V. Pisano, “Theoretical foundations of cross-border mergers and acquisitions : A review of current research and recommendations for the future,” Journal of International
Management, vol. 10, 2004, pp. 307-353.
[3] G. H. Hofstede, Culture’s Consequences : International Differences in
Work-Related Values, Beverly Hills, CA : Sage, 1980.
[4] R. House, M. Javidan, P. Hanges, and P. Dorfman, “Understanding cultures and implicit leadership theories across the globe,” J.World Bus,
vol. 37, (5), 2002, pp. 57-63.
[5] J. Child, D. Faulkner, and R. Pitkethly, Management of International
Acquisitions, Oxford, UK : Oxford Univ. Press, 2001.
[6] R. A. Honore, and M. W. Maheia, “The Secret to a Successful RIM Merger or Acquisition,” The Information Management Journal, vol. 37, (5), 2003, pp. 57-63.
[7] P. Mallette, “The Acquisition Process Map : Blueprint for a Successful Deal,” Southern Business Review, vol. 28, (2), 2003, pp. 1-13. [8] D. De Camera, and P. Renjen, “The Secret of successful Merger :
Dispatches from the Front Lines,” The Journal of Business Strategy, vol. 25, (3), 2004, pp. 10-14.
[9] M. C. Bligh, “Surviving Post-Merger ‘Culture Clash’ : Can Cultural Leadership Lessen the Casualties?” Leadership, vol.2, (4), 2006, pp. 395-426.
[10] J. W. Fairfield-Sonn, Corporate Culture and the Quality Organization,
Westport, CT : Quorum Books, 2001.
[11] H. Osada, and et al., Self-evaluation of management system, Tokyo, Japan, Japan Standard Association, 2001. (in Japanese)
[12] E. H. Schein, Organizational Culture and Leadership, San Francisco, CA : Jossey-Bass Inc., 1985.
y = 0.0535x + 1.1056 R2 = 0.5891
1.0 1.5 2.0 2.5 3.0 3.5
[image:6.595.46.291.325.451.2]0.0 5.0 10.0 15.0 20.0 25.0 30.0 35.0 40.0
Figure 3. Time required to resolve QIs (x) and Quality ranking (y) y = 0.0535x + 1.1056
R2 = 0.5891
1.0 1.5 2.0 2.5 3.0 3.5
0.0 5.0 10.0 15.0 20.0 25.0 30.0 35.0 40.0