An exploratory
factor analysis of risk
management practices:
A study among small
and medium contractors
in Gauteng
Peer reviewed and revised
*The authors declared no conflict of interest for this article or title.
Abstract
Risk management (RM) is acknowledged as a key activity in project management in the pursuit to deliver successful construction projects. However, these projects are associated with various risks, which often jeopardise project performance, especially among small and medium construction enterprises (SMEs). Risk management practices (RMPs) have been developed, in order to curtail project risks. Nevertheless, there is no consensus on the practices that constitute RM for SME projects. Therefore, the main purpose of this research is to determine the RMPs that can be tailored for construction SMEs to manage risk in their projects, in order to achieve project success. An extensive review of relevant literature on RMPs was conducted and used to develop a structured questionnaire posted to construction SMEs who were conveniently sampled in the Gauteng province of South Africa. The empirical findings established nine RMPs that were reliable and valid for managing risk in projects undertaken by construction SMEs, namely organizational environment; defining project objectives; resource requirements; risk measurement; risk identification; risk assessment; communication approach and evaluation; risk response and action planning, as well as monitoring and review. It is important to note that the study was not conducted across South Africa; hence, the findings cannot be generalized. Despite the delimitation, the researchers recommend that these practices are for risk management in construction projects undertaken by SMEs in South Africa.
Bérenger Renault
Mr Bérenger Y. Renault, Department of Construction Management and Quantity Surveying, University of Johannesburg, Johannesburg, South Africa. Phone: +27 73 101 6707, email: <renault08@ yahoo.fr>
Justus Agumba
Dr Justus N. Agumba, Department of Construction Management and Quantity Surveying, Durban University of Technology, Durban, South Africa. Phone: +27 31 373 2466, email: <JustusA@ dut.ac.za>
Nazeem Ansary
Mr Nazeem Ansary, Department of Construction Management and Quantity Surveying, University of Johannesburg, Johannesburg, South Africa. Phone: +27 11 559 6056, email: <nansary@ uj.ac.za>
DOI: http://dx.doi. org/10.18820/24150487/ as25i1.1
ISSN: 1023-0564 e-ISSN: 2415-0487 Acta Structilia 2018 25(1): 1-39
Keywords: Factor analysis, risk management practices, small and medium enterprises, South Africa
Risikobestuur (RB) word erken as ’n sleutelaktiwiteit in projekbestuur in die strewe om suksesvolle konstruksieprojekte te lewer. Hierdie projekte word egter geassosieer met verskeie risiko’s wat projekprestasie dikwels in gevaar stel, veral onder klein en medium konstruksie-ondernemings (KMO’s). Risikobestuurspraktyke (RBP) is ontwikkel om projekrisiko’s te beperk. Tog is daar geen konsensus oor die praktyke wat RB vir KMO-projekte uitmaak nie. Die hoofdoel van hierdie navorsing is dus om die RBP te bepaal wat aangepas kan word vir konstruksie-KMO’s om risiko in hul projekte te bestuur ten einde projeksukses te behaal. ’n Uitgebreide literatuurstudie oor RBP is gedoen en gebruik om ’n gestruktureerde vraelys te ontwikkel wat aan konstruksie-KMO’s in die Gauteng provinsie van Suid-Afrika gepos is. Die empiriese bevindinge het nege RBP opgestel wat betroubaar en geldig was vir die bestuur van risikos in projekte wat deur konstruksie-KMO’s onderneem is, naamlik organisatoriese omgewing; definisie van projekdoelwitte; hulpbronvereistes; risiko-meting; risiko-identifikasie; risikobepaling; kommunikasiebenadering en evaluering; risikoreaksie en aksiebeplanning, sowel as monitering en hersiening. Dit is belangrik om daarop te let dat die studie nie oor die hele Suid-Afrika uitgevoer is nie; daarom kan die bevindings nie veralgemeen word nie. Ten spyte van die beperking, beveel die navorsers aan dat hierdie praktyke is wat vir risikobestuur in konstruksieprojekte deur KMO’s in Suid-Afrika onderneem moet word.
Sleutelwoorde: Faktoranalise, klein en medium ondernemings, risikobestuurs-praktyke, Suid-Afrika
1.
Introduction
and promoting economic growth (Leboea, 2017: 39). To buttress this statement, Mutezo (2013: 155) stated that SMEs are often regarded as the backbone of the economy and the main driver of economic growth in the country (Falkner & Hiebl, 2015: 131).
Regardless of the noted economic significance, it is estimated that many SMEs in South Africa fail to go past the end of their second year of business establishment (Marcelino, Pérez-Ezcurdia, Echeverría Lazcano & Villanueva, 2014: 332; Cant & Wiid, 2013: 710). Perera (2016) supported this statement by arguing that many SMEs do not survive beyond their first five years of business establishment and that eight out of ten SMEs fail every year. Studies have revealed that many SMEs fail, due to a number of factors, which include, but are not restricted to the lack of access to finance (Boone & Kurtz, 2006; Ramlee & Bernma, 2013; Brown & Lee, 2014) and lack of appropriate management skills (Olawale & Garwe, 2010: 731). However, Rostami, Sommerville, Wong & Lee’s (2015: 98) study revealed that 80% of SMEs failures are as a result of management failure. It was indicated that there is a necessity to improve corporate governance and the link to risk management (RM). In performing their activities, SMEs face many risks that are often similar to those of large enterprises. SMEs, however, tend to experience more risks than large enterprises, and the risk of not delivering the project within its set target is higher in SMEs than in large enterprises (Rostami et al., 2015: 98). As a result of high exposure to risk and failure, investors and banks have become hesitant about funding SMEs (Ellegaard, 2008: 429; Kraus, Rigtering, Hughes & Hosman, 2012: 161).
many risks, a factor that could be closely linked to the high failure rate (Nunes, Viveiros & Serrasqueiro, 2012: 453). According to Gao et al. (2013: 683), knowledge on the risk management strategies applied by SMEs remains scanty, especially in less developed economies. Furthermore, Gunasekaran, Rai & Griffin (2011: 5494) point out that the lack of adoption and implementation of mitigative strategies in SMEs projects have resulted in many projects not achieving set objectives. Chihuri & Pretorious (2010: 65) postulated that, in South Africa, risk management was also not widely used among both small and large firms and that there was a lack of actual adoption and implementation of RM practices. Yaacob (2015: 496) argues that scientific effort among researchers to investigate issues on RMPs is inadequate and emphasises that research on RMP of SMEs is minimal compared to SMEs’ critical contribution to the economy. In order to overcome project failures, Cooke-Davis (2002: 188) established that project success is highly dependent upon the implementation of RMPs. Rounds & Segner (2011: 104) described it as one of the most capable areas and critical procedures that help complete projects successfully. Furthermore, Imbeah & Guikama (2009: 778) argued that RMPs are closely aligned with overall project performance. The scarcity of scientific research on RMPs and poor project perfor-mance highlight, the need to determine RMPs that construction SMEs can use to improve their project performance. Furthermore, although many studies have been conducted on RM among SMEs, the plethora of studies lack consensus of the RMPs to be used by construction SMEs. The purpose of this study is, therefore, to determine the reliable and valid RM practices tailored for construction SMEs projects, using exploratory factor analysis.
2.
Risk management in SMEs
Contrarily, Corvellec (2009: 288) argued that organizations might implicitly implement RM. RM is embedded in daily management activities and business processes. Organizations do not openly state that they are addressing risks and implementing RM. Nevertheless, they are addressing risks encountered by their organizations in an effective manner. Poba-Nzaou, Raymond & Fabi (2014: 488) concurred with the study. They revealed that SMEs’ RM practices are informal, unstructured, and instinctive. However, they still effectively address management risks. Poba-Nzaou, Raymond & Fabi (2014: 488) interpret this as SMEs demonstrating RM capability.
Establishing risk initiatives for construction SMEs is critical to the success of their projects. SMEs’ failure is often due to high levels of non-application of RM processes, unmanaged risks and worst-case scenarios, and the inability to manage risks. However, Ekwere (2016: 32) notes that the objective of RM is not to prevent risk-taking, but to ascertain that risk is taken with a clear understanding and knowledge to enable its measurement and mitigation with an organization. SMEs are also found to have backward-looking perspectives as opposed to a transformed and forward-looking approach that promotes continuous improvement (Ching & Colombo, 2014: 77). According to Watt (2007: 26), SME senior managers should consider the following steps in their RM processes: establish the SMEs’ risk strategy; determine the risk appetite; identify and assess the risk, and prioritize and manage the risk.
managed effectively and efficiently, it can help businesses become more cost effective.
2.1 Identified risk management practices
There was no particular study with similar factors and the measures that deemed to influence project outcome. The extensive literature review suggested nine theoretical RM practices that SMEs could use to manage their projects in order to achieve successful project delivery. These practices are discussed in detail in this section.
2.1.1 Organizational environment
According to the Institute of Risk Management (IRM, 2002), the internal environment influences an organization in adopting a comprehensive and collaborative approach to risk and, therefore, impacts positively on the outcome of the project. In addition, it influences management decision-making to achieve the right balance of risk and opportunity. Likewise, the external environment evaluates the strategic alignment of an organization’s RM and its external operating environment (IRM, 2002). Smit (2012: 67) indicated that understanding the organizational environment of risk ensures that all organizational stakeholders understand their responsibilities and accountabilities, as well as identify possible weak areas that may influence the project from achieving its objectives. As stakeholders play a crucial role in the success of any project, scholars studying the construction sector (Olander & Landin, 2005: 323; El-Gohary, Osman & Ei-Diraby, 2006: 597; Bosher, Dainty, Carrillo, Glass & Price, 2007: 165; Momeni, Hamidizade & Nouraei, 2015: 416) established that stakeholder involvement has undeniable impacts on project outcomes. Furthermore, in exploring the effect of organizational environment, top management involvement, and stakeholder’s involvement on the success of a project, Basu, Hartono, Lederer & Sethi (2002: 516) observed that these factors were considerably related to project success. From the discussion, it can be suggested that understanding the organizational environment is an important practice of RM and project success.
2.1.2 Defining project objectives
are aligned (Boubala, 2010: 14). In support of this statement, Goetz (2010) and Beleiu, Crisan & Nistor (2015: 64) added that keeping project objectives in the vanguard of every project assures that the project and the team are in sync during the course of the project’s life cycle. They deduced that clearly defined objectives will enable the project’s successful result. It can thus be suggested that defining project objectives is imperative practice for RM.
2.1.3 Resource requirements
RM resources are important in a project, as they enable RM perfor-mance of the project to be achieved (Oztas & Okmen, 2005: 1246; El-Sayeh, 2008: 435). Muthuramalingam (2008: 5) established that availability of resources was a good predictor of RM performance, thus contributing to a successful completion of the project. Haughey (2014: 2-3) concluded that RM resources influenced project success. Scheid (2011) stated that a project’s resources need to be considered, in order to keep on track with successful outcomes. Manfredi & Auletta (2013) concurred with Scheid (2011) who indicated that the availability of resources had an impact on the decrease of cost overruns in projects.
2.1.4 Risk measurement
2.1.5 Risk identification
The results of Al-Shibly, Louzi & Hiassat (2013: 22) indicated that risk identification influenced project success. Similarly, Ewer & Mustafa (2008: 1-6) observed that some authors (Martins, 2006: 56; De Bakker, Boonstra & Wortmann, 2011: 78; Grote & Moss, 2008: 88-89) inferred that, when management involvement increases in risk identification, the risk of unclear or misunderstood scope seems to lessen and improve project performance and, hence, influence positively a project’s outcome. A study conducted by De Bakker et al. (2011: 78) stipulates that risk identification contributes to project success. They also inferred that the interaction through discussion between project members during risk identification has a positive impact on the perceived success of the project.
2.1.6 Risk assessment
Roque & De Carvalho (2013: 102) established that risk assessment activity makes a greater significant impact on the success of the project. The results indicated that adopting risk assessment has a substantial positive impact on the project success, as project staff are able to take actions to mitigate the occurrence of risks to a greater extent. Al-Shibly et al. (2013: 34) tested the relationship between risk assessment and planned budget. The authors established that there was an impact of risk assessment on project planned budget. Furthermore, Smit (2012: 83), Zeng & Smith (2007: 594), El-Sayegh (2008: 433) and Abu Mousa (2005: 18-19) affirmed the influence of risk assessment on the successful completion of a project. They reported that assessing uncertainties during the project, making use of the RM strategies, and understanding the business environment, significantly impact on project outcome.
By assessing risk, managers can distinguish between acceptable and unacceptable risk events, thus enabling them to capture and process information to assist them in the development of a risk management strategy (Oztas & Okmen, 2005: 1248; Nieto-Morote & Ruz, 2011: 226; Karimi et al., 2010: 9107). Likewise, Naidoo (2012: 24), indicated that risk assessment once performed, improved project objectives, accurate schedule, improved communication between relevant parties, and hence increased the likelihood of project success.
2.1.7 Risk response and action planning
there were no risks and problems, but because appropriate responses were developed which led to successful completion of the project. Kutsch & Hall’s (2005: 596) studies established that project performance can be improved by developing mitigating measures that positively influence risk response for project success. Gajewska & Ropel (2011: 32) and Alberto & Timur (2013: 72) stated that risk response and action planning influence project success. The latter authors established that, when conducted, risk response will change the risk profile through the project life cycle, and risk exposure will diminish. Omphile (2011: 52) and Aimable (2015: 9-10) established that risk response activities are strongly linked to the success of construction projects. Omphile (2011: 52) further indicated that the impact of responding to a risk may make sense in the short term by saving design costs, allowing the team to meet schedule. Moreover, Baccarini, Salm & Love (2004: 288) indicated that one of the documented keys to project success is mitigating the influence of potential project risks to improve the chance of project success.
2.1.8 Communication
Aulich (2013: 96) indicated that communication between project head and management is crucial to the success of construction projects. This is generally influenced by the principal agent relationship between the parties and the contract type chosen (Kelkar, 2011: 112). Naidoo (2012: 29) showed that a balance between formal and informal communication between project manager and other stakeholders reduces mistrust and conflict of interest. Likewise, Zulch (2012: 54) opined that communication influenced project success. The author further established that managers spend approximately 90% of their working time engaged in some form of communication, be it meetings, writing emails, reading reports, or talking to project stakeholders. Therefore, communication in construction provides a positive contribution to projects, by improving the motivation of project members and the effectiveness of the performance (Aulich, 2013: 96). De Bakker et al. (2011: 83) stipulated that, in situations where risks are not shared openly, the positively communicative effect may not occur, hence, stifling the success of a project.
2.1.9 Monitoring, review and continuous improvement
In addition, Hwang & Lim (2013: 209) and Kamau & Mohamed (2015: 84) established that project monitoring and review allow management to verify that the control actions that were applied are efficacious in order to achieve project success. If control actions are found to be ineffective, these should be revised, or new control actions be implemented, thus enabling continuous improvement in future projects (DEAT, 2006: 8). Rezakhani (2012: 19) indicated that project monitoring and continuous improvement is even more critical than planning in achieving project success. Likewise, many researchers (Spikin, 2013: 104-105; Chin, 2012: 42 indicated that one of the elements of the project management methodology whose main aim is to achieve project success is monitoring project progress.
3.
Research
The purpose of this research was to determine the RMPs that can be tailored for construction SMEs to manage risk in their projects, in order to achieve project success. A quantitative research design was adopted. This type of design allows for the use of structured questionnaire surveys, enabling researchers to generalise their findings from a sample of a population (Creswell, 1994). In the questionnaire, nine risk management practices (constructs), consis-ting of 42 measures, were extracted and set as the variables of risk management practices SMEs should follow (Netemeyer, Bearden & Sharma, 2003). Exploratory factor analysis (EFA) was used to assess these measured variables in terms of their validity and reliability. EFA is a type of technique that analyses the unidimensionality (characteristics) of each of the defined risk management practices (original variables), in order to reduce it to a common score (smaller number of factors) by examining relationships among these quantitative factors (Pallant, 2013: 192; Rossoni, Engelbert & Bellegard, 2016: 200). Several factor analysis methods are available, but principle component analysis (PCA) was used, because the Eigenvalues could be extracted, which explains whether the factors tested had or had not a noticeable effect on people’s responses to the variables in the original test (analysed construct) (Rossoni et al., 2016: 201; Yang, Shen & Ho, 2009: 163-164; Pallant, 2013: 192).
3.1 Sampling method and size
Metropolitan Municipality, Ekurhuleni Metropolitan Municipality, and the West Rand District Municipality, was conveniently sampled from this list, because they were easiest to access (Etikan, Musa & Alkassim, 2016: 2). The sample size used the general Rule of Thumb method. Van Voorhis & Morgan (2007: 34) recommend 10 participants per measurement; 20 participants should be added for each independent variable. With nine factors (constructs), the sample size was 9 x 20 = 180, but 45 additional participants were added, resulting in a total sample of 180 + 45 = 225. The sample size table by Krejcie & Morgan (1970: 608) recommends a sample size for a population of 500 as 217. This recommendation validates the sample size of 225 as efficient for the population of 548.
3.2 Response rate
From the 225 original questionnaires, 181 completed ones were returned, resulting in a high response rate of 96%. According to Moyo & Crafford (2010: 68), contemporary built-environment survey response rates range from 7% to 40%, in general.
3.3 Data collection
3.4 Data analysis and interpretation of findings
The Statistical Package for Social Science (SPSS) version 23 was used to determine the factor analysability of the risk management practices, using inferential statistics (Pallant, 2013).
To rank which of the nine risk management practices consisting of 42 measures were practice, the measures were rated on a five-point Likert scale. Likert-type or frequency scales use fixed choice response formats and are designed to measure attitudes or opinions (Bowling, 1997). The following scale measurement was used regarding mean scores, where 1 = Strongly disagree (≥ 1.00 ≤ and <1.80), 2 = Disagree (≥ 1.81 and ≤ 2.60), 3 = Neutral (≥ 2.61 and ≤ 3.40), 4 = Agree (≥3.41 and ≤ 4.20), and 5 = Strongly agree (≥4.21 and ≤ 5.00).
For analysis of the internal reliability of the factors in the questions on risk management practices, Cronbach’s alpha values were tested (Kolbehdori & Sobhiyah, 2014: 347; Wahab, Ayodele & Moody, 2010: 67). Tavakol & Dennick (2011: 54-55) and Yount (2006) suggested that the acceptable values of Cronbach’s alpha would range from 0.70 to 0.95. In the current study, a cut-off value of 0.70 was adopted. Furthermore, the optimal inter-item correlations mean (factor loadings) should range from 0.2 to 0.4, in order for the factor to be reliable (Pallant, 2013: 134). However, in this study, a value of 0.3 and above was adopted.
To confirm whether the data from the measurements was sufficient for factor analysis (test the validity), the Kaiser-Meyer-Olkin (KMO) test (Lorenzo-Seva, Timmerman & Kiers, 2011) and the Bartlett’s sphericity test (Hair, Black, Babin, Andersen & Taham, 2006: 110) were performed. In the KMO test, as the values of the test vary from 0 to 1, values above 0.7 are recommended as being desirable for applying EFA (Hair et al., 2006) and a statistically significant Bartlett test (p < 0.05) indicates that sufficient correlations exist between the variables to continue with the analysis (Hair et al., 2006: 110; Pallant, 2013: 190).
data, which are retained to form a set of few new variables (less than the original variables started with in the analysis).
3.5 Limitation(s) of the study
It is important to note that the study was not conducted across South Africa; hence, the findings cannot be generalised.
4.
Results
4.1 Respondents’ profile
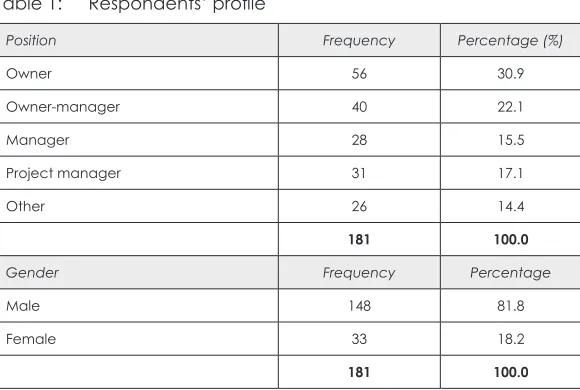
The first part of the questionnaire comprised questions relative to the demographic profile of the respondents, the people in the best position to indicate their level of agreement in practice with the measures defining the risk management practices. Table 1 shows the professions of the respondents. These include owner, owner-manager, owner-manager, and project manager. It is obvious that the majority (87.6%) of the respondents were either owners or managers of their enterprise, male (81.8%), and had either Matriculation (22.7%) or a Certificate (20.4%); 43.1% of respondents had 10 years’ or less experience in construction.
Table 1: Respondents’ profile
Position Frequency Percentage (%)
Owner 56 30.9
Owner-manager 40 22.1
Manager 28 15.5
Project manager 31 17.1
Other 26 14.4
181 100.0
Gender Frequency Percentage
Male 148 81.8
Female 33 18.2
[image:13.421.74.364.305.500.2]Risk management responsibility Frequency Percentage (%)
Top management 108 59.6
Operation manager 15 8.3
Organization collective effort 11 6.1
Project manager 13 7.2
Owner 29 16.0
The risk task team 5 2.8
181 100.0
Highest education qualification Frequency Percentage (%)
Doctorate degree 3 1.7
Master’s degree 11 6.1
Honours/BTech/BSc 27 14.9
HND/Diploma 29 16.0
Certificate 37 20.4
Matriculation 41 22.7
Basic schooling 26 14.4
No qualification 5 2.8
179 100.0
Years of experience in construction Frequency Percentage (%)
1-5 years 30 16.6
6-10 years 48 26.5
11-15 years 29 16.0
16-20 years 22 12.2
21-25 years 7 3.9
26-30 years 14 7.7
31-35 years 7 3.9
Over 36 years 9 5.0
4.2 SMEs’ profile
Table 2 shows the emerging contractors’ distribution according to the nature of their business. It further shows the frequency results of the municipality, in which their business was based. It is evident that the majority of SMEs were either subcontractors (37.6%) or general contractors (31.5%), and operated mostly in Johannesburg (41.4%) and Tshwane (30.9%) Metropolitan Municipalities.
Table 2: SMCEs’ profile
Type of contractor Frequency Percentage (%)
General contractor 57 31.5
Subcontractor 68 37.6
Civil contractor 12 6.6
Specialist contractor 32 17.7
Home building contractor 9 5.0
178 100.0
Municipality Frequency Percentage (%)
City of Johannesburg MM 75 41.4
City of Tshwane MM 56 30.9
Ekurhuleni MM 19 10.5
West Rand DM 30 16.6
180 100.0
4.3 Risk management practices
Table 3 ranks the mean scores to show which of the nine risk management factors were applied in practice in SMEs.
Table 3: Ranking of risk management factors
Risk management factor (N=181) (1 = strongly disagree …..
5 = strongly agree) MS Rank
Risk response and action planning 4.00 1
Communication 3.94 2
Risk assessment 3.38 3
Monitoring, review, and continuous improvement 3.29 4
Risk identification 3.27 5
Resource requirement 3.23 6
Risk measurement 3.04 7
Defining project objectives 2.98 8
[image:15.421.71.365.152.352.2] [image:15.421.69.365.414.548.2]Organizational environment with a MS of 2.68 is the least practised factor within SMEs. Risk response and action planning with the highest score of MS of 4.00 was perceived to be commonly practised by SMEs.
4.4 Exploratory factor analysis results
The nine risk management factors were subjected to EFA to assess their validity and reliability. The results report the suitability of the data to be analysed, factor extraction and rotation, and interpretation.
4.4.1 Exploratory factor analysis for organizational environment
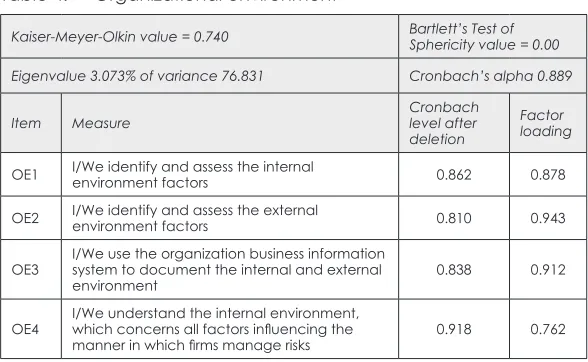
In Table 4, four measures defined organizational environment practice. The result posited that Cronbach’s alpha was greater than 0.70 at 0.889, indicating acceptable internal reliability, as recommended by Hair et al. (2006: 102). The Kaiser-Meyer-Olkin (KMO) of 0.740 with Bartlett’s Test of Sphericity of p<0.000, indicating consistency with the recommended KMO cut off value of 0.60 and Bartlett’s Test of Sphericity of p<0.05, as suggested by Pallant (2013:190). These results suggest that factor analysis could be conducted with the data. Table 4: Organizational environment
Kaiser-Meyer-Olkin value = 0.740 Bartlett’s Test of Sphericity value = 0.00
Eigenvalue 3.073% of variance 76.831 Cronbach’s alpha 0.889
Item Measure Cronbach level after
deletion
Factor
loading
OE1 I/We identify and assess the internal environment factors 0.862 0.878
OE2 I/We identify and assess the external environment factors 0.810 0.943
OE3 I/We use the organization business information system to document the internal and external
environment 0.838 0.912
OE4 I/We understand the internal environment, which concerns all factors influencing the
manner in which firms manage risks 0.918 0.762
[image:16.421.57.351.296.477.2]was established in this factor; this explained 76.831% of the variance in the data. Therefore, sufficient evidence of convergent validity was provided for this construct. It can, therefore, be indicated that this risk management practice is reliable and valid to measure the risk management practices in construction SMEs’ projects.
4.4.2 Exploratory factor analysis for defining project objectives
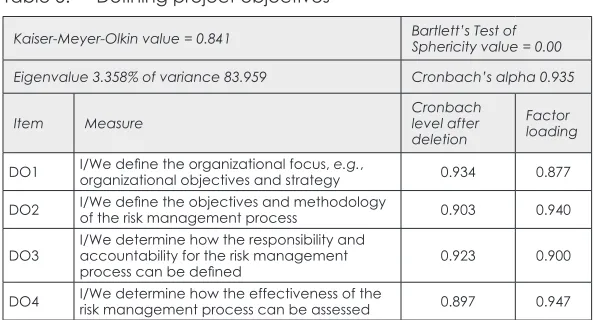
In Table 5, four measures (DO1, DO2, DO3, DO4) defined the risk management construct of defining project objectives. The findings indicate that the Cronbach’s alpha was greater than 0.70 at 0.842, indicating acceptable internal reliability, as recommended by Hair et al. (2006: 102). The Kaiser-Meyer-Olkin (KMO) of 0.819 with Bartlett’s Test of Sphericity of p<0.000, indicating consistency with the recommended KMO cut off value of 0.60 and Bartlett’s Test of Sphericity of p<0.05, as suggested by Pallant (2013: 190). These results suggest that factor analysis could be conducted with the data. Table 5: Defining project objectives
Kaiser-Meyer-Olkin value = 0.841 Bartlett’s Test of Sphericity value = 0.00
Eigenvalue 3.358% of variance 83.959 Cronbach’s alpha 0.935
Item Measure Cronbach level after
deletion
Factor
loading
DO1 I/We define the organizational focus, organizational objectives and strategye.g., 0.934 0.877
DO2 I/We define the objectives and methodology of the risk management process 0.903 0.940
DO3 I/We determine how the responsibility and accountability for the risk management
process can be defined 0.923 0.900
DO4 I/We determine how the effectiveness of the risk management process can be assessed 0.897 0.947
[image:17.421.70.367.256.416.2]4.4.3 Exploratory factor analysis for resource requirement
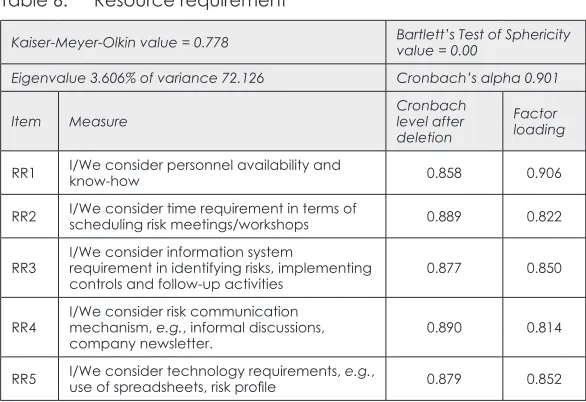
In Table 6, it is evident that there were five measures defining resource requirement. The result indicates that the Cronbach’s alpha was greater than 0.70 at 0.901, indicating acceptable internal reliability, as indicated by Hair et al. (2006: 102). The Kaiser-Meyer-Olkin (KMO) of 0.778 with Bartlett’s Test of Sphericity of p<0.000, indicating consistency with the recommended KMO cut off value of 0.60 and Bartlett’s Test of Sphericity of p<0.05, as suggested by Pallant (2013: 190). These results suggest that factor analysis could be conducted with the data.
Table 6: Resource requirement
Kaiser-Meyer-Olkin value = 0.778 Bartlett’s Test of Sphericity value = 0.00
Eigenvalue 3.606% of variance 72.126 Cronbach’s alpha 0.901
Item Measure Cronbach level after
deletion
Factor
loading
RR1 I/We consider personnel availability and know-how 0.858 0.906
RR2 I/We consider time requirement in terms of scheduling risk meetings/workshops 0.889 0.822
RR3 I/We consider information system requirement in identifying risks, implementing
controls and follow-up activities 0.877 0.850
RR4 I/We consider risk communication mechanism, e.g., informal discussions,
company newsletter. 0.890 0.814
RR5 I/We consider technology requirements, use of spreadsheets, risk profile e.g., 0.879 0.852
[image:18.421.57.350.187.388.2]4.4.4 Exploratory factor analysis for risk measurement
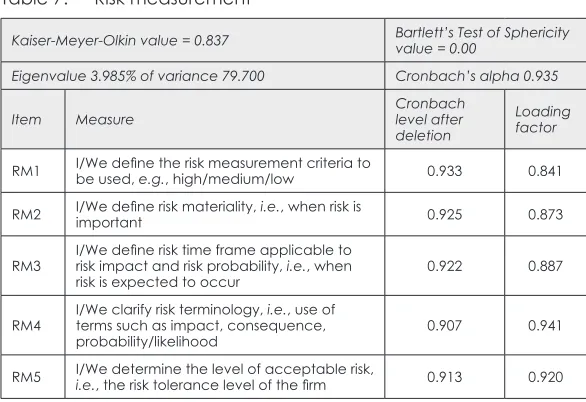
Table 7 shows the five measures defining risk measurement. The result indicates that the Cronbach’s alpha was greater than 0.70 at 0.935, indicating acceptable internal reliability (Hair et al., 2006: 102). The Kaiser-Meyer-Olkin (KMO) of 0.837 with Bartlett’s Test of Sphericity of p<0.000, indicating consistency with the recommended KMO cut off value of 0.60 and Bartlett’s Test of Sphericity of p<0.05, as suggested by Pallant (2013: 190). These results suggest that factor analysis could be conducted with the data.
Table 7: Risk measurement
Kaiser-Meyer-Olkin value = 0.837 Bartlett’s Test of Sphericity value = 0.00
Eigenvalue 3.985% of variance 79.700 Cronbach’s alpha 0.935
Item Measure Cronbach level after
deletion
Loading factor
RM1 I/We define the risk measurement criteria to be used, e.g., high/medium/low 0.933 0.841
RM2 I/We define risk materiality, important i.e., when risk is 0.925 0.873
RM3 I/We define risk time frame applicable to risk impact and risk probability, i.e., when
risk is expected to occur 0.922 0.887
RM4 I/We clarify risk terminology, terms such as impact, consequence, i.e., use of
probability/likelihood 0.907 0.941
RM5 I/We determine the level of acceptable risk, i.e., the risk tolerance level of the firm 0.913 0.920
[image:19.421.71.364.177.378.2]4.4.5 Exploratory factor analysis for risk identification
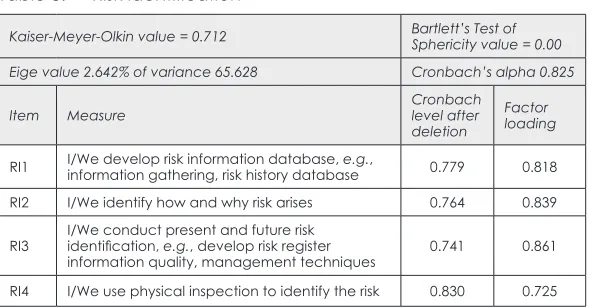
Table 8 indicates that there were four measures of risk identification. The Cronbach’s alpha for risk identification was greater than 0.70 at 0.825, indicating acceptable internal reliability, as suggested by Hair et al. (2006: 102). The Kaiser-Meyer-Olkin (KMO) of 0.712 with Bartlett’s Test of Sphericity of p<0.000, indicating consistency with the recommended KMO cut off value of 0.60 and Bartlett’s Test of Sphericity of p<0.05, as recommended by Pallant (2013: 190). These results suggest that factor analysis could be conducted with the data.
Table 8: Risk identification
Kaiser-Meyer-Olkin value = 0.712 Bartlett’s Test of Sphericity value = 0.00
Eige value 2.642% of variance 65.628 Cronbach’s alpha 0.825
Item Measure Cronbach level after
deletion
Factor
loading
RI1 I/We develop risk information database, information gathering, risk history databasee.g., 0.779 0.818
RI2 I/We identify how and why risk arises 0.764 0.839
RI3 I/We conduct present and future risk identification, e.g., develop risk register
information quality, management techniques 0.741 0.861 RI4 I/We use physical inspection to identify the risk 0.830 0.725
All four measures (RI1, RI2, RI3, RI4) expected to define risk iden-tification loaded together on this factor. The factor loadings for all practices were greater than 0.741, as reported in Table 8. These were greater than the recommended value of 0.40, as suggested by Hair et al. (2006: 128). An Eigenvalue greater than 2.642 was established in this factor, which explained 66.057% of the variance in the data. Therefore, sufficient evidence of convergent validity was provided for this construct. The reliability values were also above the recommended value of 0.70, as considered by Hair et al. (2006: 102). The results infer that risk identification is a reliable and valid RM practice for construction SMEs’ projects.
4.4.6 Exploratory factor analysis for risk assessment
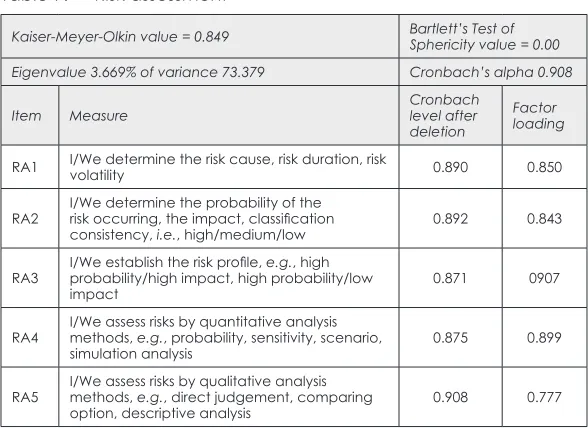
[image:20.421.58.353.190.344.2]102). The Kaiser-Meyer-Olkin (KMO) of 0.849 with Bartlett’s Test of Sphericity of p<0.000, indicating consistency with the recommended KMO cut off value of 0.60 and Bartlett’s Test of Sphericity of p<0.05, as suggested by Pallant (2013: 190). These results suggest that factor analysis could be conducted with the data.
Table 9: Risk assessment
Kaiser-Meyer-Olkin value = 0.849 Bartlett’s Test of Sphericity value = 0.00
Eigenvalue 3.669% of variance 73.379 Cronbach’s alpha 0.908
Item Measure Cronbach level after
deletion
Factor
loading
RA1 I/We determine the risk cause, risk duration, risk volatility 0.890 0.850
RA2 I/We determine the probability of the risk occurring, the impact, classification
consistency, i.e., high/medium/low 0.892 0.843
RA3 I/We establish the risk profile, probability/high impact, high probability/low e.g., high
impact 0.871 0907
RA4 I/We assess risks by quantitative analysis methods, e.g., probability, sensitivity, scenario,
simulation analysis 0.875 0.899
RA5 I/We assess risks by qualitative analysis methods, e.g., direct judgement, comparing
option, descriptive analysis 0.908 0.777
All five variables (RA1, RA2, RA3, RA4, RA5) expected to measure risk measurement loaded together on this component. The factor loadings for all variables were greater than 0.777, as indicated in Table 9. These were greater than the recommended value of 0.40, as suggested by Hair et al. (2006: 128). An Eigenvalue greater than 3.669 was established in this factor, which explains 73.379% of the variance in the data. Therefore, sufficient evidence of convergent validity was provided for this construct. The reliability values were also above the recommended value of 0.70, as considered by Hair et al. (2006: 102). It can be postulated that risk assessment is a reliable and valid RM practice for construction SMEs’ projects.
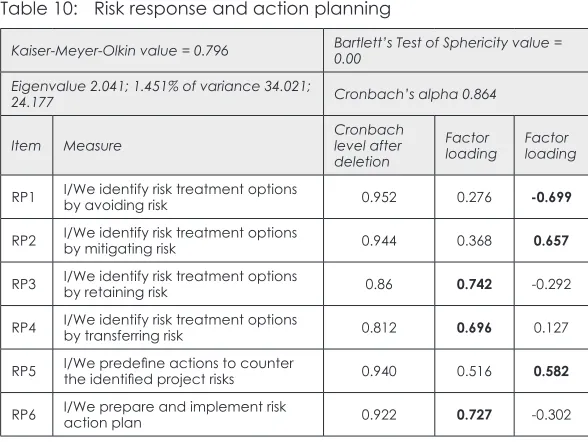
[image:21.421.71.365.130.344.2]recommended by Hair et al. (2006: 102). The Kaiser-Meyer-Olkin (KMO) of 0.796 with Bartlett’s Test of Sphericity of p<0.000 were also obtained, indicating consistency with the recommended KMO cut off value of 0.60 and Bartlett’s Test of Sphericity of p<0.05, as suggested by Pallant (2013: 190). These results suggest that exploratory factor analysis could be conducted with the data.
Table 10: Risk response and action planning
Kaiser-Meyer-Olkin value = 0.796 Bartlett’s Test of Sphericity value = 0.00
Eigenvalue 2.041; 1.451% of variance 34.021;
24.177 Cronbach’s alpha 0.864
Item Measure Cronbach level after
deletion
Factor
loading Factor loading
RP1 I/We identify risk treatment options by avoiding risk 0.952 0.276 -0.699
RP2 I/We identify risk treatment options by mitigating risk 0.944 0.368 0.657
RP3 I/We identify risk treatment options by retaining risk 0.86 0.742 -0.292
RP4 I/We identify risk treatment options by transferring risk 0.812 0.696 0.127
RP5 I/We predefine actions to counter the identified project risks 0.940 0.516 0.582
RP6 I/We prepare and implement risk action plan 0.922 0.727 -0.302
[image:22.421.57.351.134.355.2]4.4.8 Exploratory factor analysis for communication
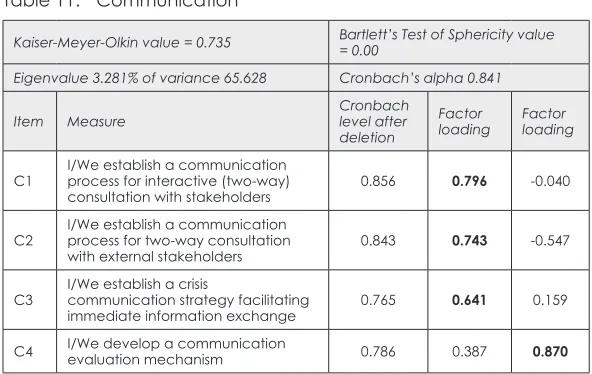
Table 11 indicates the four measures of communication. The Cronbach’s alpha of the construct was greater than 0.70 at 0.841, indicating acceptable internal reliability, as recommended by Hair et al. (2006: 102). The Kaiser-Meyer-Olkin (KMO) of 0.735 with Bartlett’s Test of Sphericity of p<0.000, indicating consistency with the recommended KMO cut off value of 0.60 and Bartlett’s Test of Sphericity of p<0.05, as suggested by Pallant (2013: 190). These results suggest that exploratory factor analysis could be conducted with the data.
Table 11: Communication
Kaiser-Meyer-Olkin value = 0.735 Bartlett’s Test of Sphericity value = 0.00
Eigenvalue 3.281% of variance 65.628 Cronbach’s alpha 0.841
Item Measure Cronbach level after
deletion
Factor
loading Factor loading
C1 I/We establish a communication process for interactive (two-way)
consultation with stakeholders 0.856 0.796 -0.040
C2 I/We establish a communication process for two-way consultation
with external stakeholders 0.843 0.743 -0.547
C3 I/We establish a crisis communication strategy facilitating
immediate information exchange 0.765 0.641 0.159
C4 I/We develop a communication evaluation mechanism 0.786 0.387 0.870
The exploratory factor analysis using principal component analysis extracted two components. The results revealed that three of the measures (C1, C2, C3) strongly loaded on the first component renamed “communication approach” and only one measure (C4) loaded on the second component renamed “communication evaluation”. The factor loadings were greater than 0.40, as reported in Table 11, therefore acceptable measures of the factors (Hair et al. 2006: 128; Pallant, 2013: 200). However, the rule of thumb suggests that a factor cannot be measured by one variable. Therefore, based on this suggestion, the two components were combined and the communication practice was renamed “communication
[image:23.421.70.366.187.374.2]component named “communication evaluation” attained an Eigenvalue of 1.083 and explained 27.0635 of the variance in the data. The renaming of the RM practice suggests that sufficient evidence of convergent validity was provided for this construct. It can, therefore, be indicated that this risk management practice is reliable and valid to measure the risk management practices in construction SMEs’ projects.
4.4.9 Exploratory factor analysis for monitoring, review, and continuous improvement
From Table 12, it is evident that the five measures of monitoring, review and continuous improvement attained acceptable internal reliability. The Cronbach’s alpha was greater than 0.70 at 0.892, as recommended by Hair et al. (2006: 102). The Kaiser-Meyer-Olkin (KMO) of 0.802 with Bartlett’s Test of Sphericity of p<0.000, indicating consistency with the recommended KMO cut off value of 0.60 and Bartlett’s Test of Sphericity of p<0.05, as suggested by Pallant (2013: 190). These results indicate that factor analysis could be conducted with the data.
Table 12: Monitoring, review, and continuous improvement
Kaiser-Meyer-Olkin value = 0.802 Bartlett’s Test of Sphericity value = 0.00
Eigenvalue 3.540% of variance 70.796 Cronbach’s alpha 0.892
Item Measure Cronbach level after
deletion
Factor
loading
MR1 I/We assign responsibility for monitoring and review actions 0.876 0.830
MR2 I/We identify and select monitoring and review techniques 0.850 0.912
MR3 I/We assess control effectiveness, measured in terms of meeting departmental/organizational
objectives 0.890 0.777
MR4 I/We do control enhancement by revising ineffective controls identified 0.877 0.826
MR5 I/We report the new results from monitoring and review activities 0.868 0.856
[image:24.421.56.352.295.481.2]of 0.40, as suggested by Hair et al. (2006: 128) and Pallant (2013: 200). An Eigenvalue greater than 3.540 was established in this factor, which explains 70.796% of the variance in the data. Therefore, sufficient evidence of convergent validity was provided for this construct. It can, therefore, be indicated that this risk management practice is reliable and valid to measure the risk management practices in construction SMEs’ projects.
5.
Discussion of the results
5.1 Organizational environment
The results found that four measures defined organizational environment practice of RM. This suggests that the four measures, empirically tested, strongly congregated on this practice. Hence, the result supported its theoretical conceptualization. In order for the organizational environment practice of RM to be demonstrated, four activities must be evinced, namely identify and assess the internal environment factors; identify and assess the external environment factors; use the organization business information system to document the internal and external environment, and understand the internal environment, which concerns all factors influencing the manner in which firms manage risks. These measures strongly congregated in defining organizational environment practice. Furthermore, the empirical finding inferred that the organizational environment practice of RM was reliable and valid. Previous studies by Smit (2012: 62), Olander & Landin (2005: 324), El-Gohary et al. (2006: 596), Bosher et al. (2007: 167), and Momeni et al. (2015: 418) are in line with this finding. It can be suggested that understanding the organizational environment is an important practice of RM and project success.
5.2 Defining project objectives
without objectives, leads the project into overruns, personality clashes, missed milestones, and unhappy clients. Furthermore, defining project objectives helps align the organization, whereby the project objectives are clear and understood. In addition, the positive and negative risks in achieving the objectives are identified and understood, and risk responses are aligned (Boubala, 2010: 88).
5.3 Resource requirements
The resource requirement practice of RM was reliable and valid. Therefore, it can be used to manage the risks of projects involving construction SMEs. The measures of this RM practice congregated strongly on this practice; hence, construct validity was achieved. These measures were: personnel availability and their knowledge base; consider time requirement in terms of scheduling risk meetings/ workshops; consider information system requirements in identifying risks; implement controls and follow-up activities; consider risk communication mechanism (e.g., informal discussions, company newsletter), and consider technology requirements (e.g., use of spreadsheets, and risk profile). Haughey (2014: 2-3), Manfredi & Auletta (2013), Scheid (2011), and Muthuramalingam (2008: 4) support this finding, as the availability of resources was a good predictor of RM performance, thus contributing to successful completion of the project.
5.4 Risk measurement
time frame applicable to risk impact and risk probability (i.e., when risk is expected to occur: next month, next year, and so on). Karimi et al. (2010: 9108) indicated that, when risk measurement is used, it reduces risk impact on the project regarding schedule, budget, and quality. Goossens & Van-Gelder (2002) demonstrated that risk measurement, being one of the activities of RM, influenced project success and project performance.
5.5 Risk identification
The risk identification practice of RM was reliable and valid. Therefore, it can be used to manage the risks of projects involving construction SMEs. The results are supported by Al-shibly et al. (2013: 26) and De Bakker et al. (2011: 82) who inferred that, when management involvement increases in risk identification, the risk of unclear or misunderstood scope seems to lessen and improve project performance and, hence, influence positively project outcome. Further, the four measures of RM practice identified in the literature review congregated strongly on this practice; hence, construct validity was achieved. In order to ensure that risk identification is practised in the SMEs’ construction projects, the following four activities must manifest as per the empirical findings: develop risk information database (e.g., information gathering, risk history database); identify how and why risks arise; conduct present and future risk identification (e.g., develop risk register information quality, management techniques), and physical inspection to identify the risk.
5.6 Risk assessment
(2007: 593), El-Sayegh (2008: 433), and Abu Mousa (2005: 20) as a RM practice to influence the successful delivery of construction projects.
5.7 Risk action plan
The findings stipulated that risk response and planning of RM practice was empirically represented by two practices. This result did not support the theoretical conceptualized risk response and planning
practice. The results revealed that the renamed first practice (i.e., risk action plan) was defined by three of the measures i.e., risk treatment options by retaining risk, identify risk treatment options by transferring risk, and prepare and implement risk action plan, congregated strongly on the renamed practice of risk action plan. It can further be inferred that risk action plan is a reliable and valid RM practice for managing construction SMEs’ projects.
5.8 Risk response
The findings on risk response and planning of RM practice were empirically represented by two practices. As discussed earlier, this result did not support the theoretical conceptualized practice. The results revealed that the other three measures i.e. identify risk treatment options by avoiding risk, risk treatment options by mitigating risk, and predefine actions to counter the identified project risks, congregated strongly on the renamed RM practice of risk response. It can be inferred that this RM practice was valid and reliable. This finding is supported by the findings of Omphile (2011: 54) and Aimable (2015: 9-10) who established that risk response activities are strongly linked to the success of construction projects as an individual RM practice. However, Gajewska & Ropel (2011: 32) contrast this finding, as their RM practice combined risk response and action planning.
5.9 Communication approach and evaluation
The findings stipulated that communication as a RM practice was empirically represented by two practices. This was not in line with its theoretical conceptualization despite the evidence of two empirical practices manifesting. The first practice was renamed “communication approach” and was measured by three activities. The second practice was renamed “communication evaluation” and was measured by one variable. However, the rule of thumb suggests that a factor cannot be measured by one variable. Therefore, based on this rule of thumb, the two components were combined, and the communication practice was renamed
retaining the measures was informed by the sufficient evidence of convergent validity in each of the two renamed constructs. It can, therefore, be indicated that this RM practice is reliable and valid to measure the RM practices in construction SMEs’ projects. Partially, the finding and argument are supported in the studies of Aulich (2013: 97), Kelkar (2011: 102), and Zulch (2012: 51-52). De Bakker et al. (2011: 83) stipulated that, in situations where risks are not shared openly, the positively communicative effect may not occur, thus stifling the success of a project.
5.10 Monitoring, review and continuous improvement
Monitoring, review and continuous improvement practice of RM empirically supported its conceptual theory. This practice was valid and reliable as a practice of RM. This finding corroborates with the studies of Prabhakar (2008: 7), Papke-Shields et al. (2010: 658), Hwang & Lim (2013: 206), and Kamau & Mohamed (2015: 90). Rezakhani (2012: 19) indicated that project monitoring and conti-nuous improvement are crucial to planning in achieving project success. In addition, the following five theoretical activities that were deemed to evince this practice empirically converged strongly on this RM practice: assign responsibility for monitoring and review actions; identify and select monitoring and review techniques; assess control effectiveness, measured in terms of meeting departmental/ organizational objectives; undertake control enhancement by revising ineffective controls identified, and report the new results from monitoring and review activities.
6.
Conclusion
7.
Further areas of research
The researchers recommend that these reliable and valid RM practices can be used to successfully manage risks in construction projects undertaken by SMEs in South Africa. However, to justify these statements, these RM practices should be validated in a national study to ensure that they positively influence the successful delivery of construction projects. Furthermore, further research can be undertaken to justify the manifestation of two RM practices on each of the risk response and planning practice, and communication practice.
References
Abor, J. & Quartey, P. 2010. Issues in SME development in Ghana and South Africa. International Research Journal of Finance and Economics, 39, pp. 218-228.
Abu Mousa, E.J.H. 2005. Risk management in construction projects from contractors and owners’ perspectives. Master’s thesis, Islamic University of Gaza.
Aimable, S. 2015. Effects of risk management methods on project performance in Rwandan construction industry: A case study of the multi-storey buildings construction project of RSSB. Master’s thesis, University of Agriculture and Technology (Kigali Campus), Rwanda. Akintoye, A. & Main, J. 2007. Collaborative relationships in construction: The UK contractor’s perception. Engineering, Construction and Architectural Management, 14(6), pp. 597-617. http://dx.doi.org/10.1108/09699980710829049
Alberto, M. & Timur, N. 2013. Earned value-based performance monitoring of facility construction projects. Journal of Facilities Management, 11(1), pp. 69-80. https://doi.org/10.1108/14725961311301475
Al-Rousan, T., Sulaiman, S. & Salam, R.A. 2010. WPRiMA tool: Managing risks in Web projects. (Web Project Risk Management Assessment). International Journal of Business, Economics, Finance, and Management Science, 8(8), pp. 1-8.
Al-Shibly, H.H., Louzi, B.M. & Hiassat, M.A. 2013. The impact of risk management on construction projects’ success from the employees’ perspective. Interdisciplinary Journal of Contemporary Research in
Aroloye, B. 2017. ‘SMEs contribute about 48% to GDP’. [online]. Available at: <http://thenationonlineng.net/smes-contribute-48-gdp/> [Accessed: 25 August 2017].
Aulich, T. 2013. The role of effective communication in the construction industry: A guide for educational and health clients. Australasian
Journal of Construction Economics and Building, 13(4), pp. 92-101. https://doi.org/10.5130/ajceb.v13i4.3740
Baccarini, D., Salm, G. & Love, P.E.D. 2004. Management of risks in information technology projects. Industrial Management & Data Systems, 104(4), pp. 286-295. https://doi.org/10.1108/02635570410530702
Basu, V., Hartono, E., Lederer, A.L. & Sethi, V. 2002. The impact of organizational commitment, senior management involvement, and team involvement in strategic information systems planning.
Information and Management, 39(6), pp. 513-524. https://doi. org/10.1016/S0378-7206(01)00115-X
Beleiu, I., Crisan, E. & Nistor, R. 2015. Main factors influencing project success. Interdisciplinary Management Research, 11, pp. 59-72. Blanc-Alquier, A.M. & Lagasse-Tignol, M.H. 2006. Risk management in small- and medium-sized enterprises. Production Planning & Control, 17(3), pp. 273-282. https://doi.org/10.1080/09537280500285334 Boone, L.E. & Kurtz, D.L. 2006. Contemporary business. Mason, Ohio: South-Western Educational Publishing.
Bosher, L., Dainty, A., Carrillo, P., Glass, J. & Price, A. 2007. Integrating disaster risk management into construction: A U perspective. Journal
of Building Research and Information, 35(2), pp. 163-177. https://doi. org/10.1080/09613210600979848
Boubala, H.G.O. 2010. Risk management of SMMEs. Master’s thesis. Cape Peninsula University of Technology, Cape Town, South Africa. Bowling, A. 1997. Research methods in health. Buckingham: Open University Press.
Brown, R. & Lee, N. 2014. Funding issues confronting high growth SMEs
in the UK. Edinburgh: ICAS.
Cant, M. & Wiid, J. 2013. Establishing the challenges affecting South African SMEs. International Business & Economics Research Journal, 12(6), pp. 707-716. https://doi.org/10.19030/iber.v12i6.7869 Chihuri, S. & Pretorious, L. 2010. Managing risks for success in a South African engineering and construction project environment.
Chin, C.M.M. 2012. Development of a project management methodology for use in a university-industry collaborative research environment. PhD thesis, University of Nottingham, Semenyih Selangor Darul Ehsan, Malaysia.
Ching, H.Y. & Colombo, T.M. 2014. Enterprise risk management good practices and proposal of conceptual framework. Journal of Management Research, 6(3), pp. 69-85. https://doi.org/10.5296/jmr. v6i3.5404
Cooke-Davis, T. 2002. The real success factors on projects.
International Journal of Project Management, 20(3), pp. 185-190. https://doi.org/10.1016/S0263-7863(01)00067-9
Corvellec, H. 2009. The practice of risk management: Silence is not absence. Risk Management, 11(3-4), pp. 285-304. https://doi. org/10.1057/rm.2009.12
Creswell, J.W. 1994. Research design, qualitative and quantitative
approaches. London: Sage.
DEAT (Department of Environmental Affairs and Tourism). 2006. Risk Management, Integrated Environmental Management Information Series 23. Pretoria. [online]. Available at: <http://www.deat.gov.za> [Accessed: 12 June 2015].
De Bakker, K., Boonstra, A. & Wortmann, H. 2011. Risk management affecting IS/IT project success through communicative action. Project Management Journal, 42(3), pp. 75-90. https://doi.org/10.1002/ pmj.20242
Ekwere, N. 2016. Framework of effective risk management in small and medium enterprises (SMEs): A literature review. Bina Ekonomi,
20(1), pp. 23-46.
El-Gohary, N.M., Osman, H. & Ei-Diraby, T.E. 2006. Stakeholder management for public-private partnerships. International Journal
of Project Management, 24(7), pp. 595-604. https://doi.org/10.1016/j. ijproman.2006.07.009
Etikan, I., Musa, S.A. & Alkassim, R.S. 2016. Comparison of convenience sampling and purposive sampling. American Journal of Theoretical
and Applied Statistics, 5(1), pp. 1-4. https://doi.org/10.11648/j. ajtas.20160501.11
Ewer, Y. & Mustafa, M.M. 2008. The impact of risk management on IS projects success in Syria. In: Proceedings of the International Conference on Telecommunication Technology and Applications, 7-11 April, Damascus, Syria: IEEE, pp. 1-6. https://doi.org/10.1109/ ICTTA.2008.4530328
Falkner, E.M. & Hiebl, M.R. 2015. Risk management in SMEs: A systematic review of available evidence. Journal of Risk Finance, 16(2), pp. 122-144. https://doi.org/10.1108/JRF-06-2014-0079
Gajewska, E. & Repel, M. 2011. Risk management practices in construction project: A case study. Master of Science thesis, Chalmers of Technology, Goteborg, Sweden.
Gao, S.S., Sung, M.C. & Zhang, J. 2013. Risk management capability building in SMEs: A social capital perspective. International Small Business Journal, 31(6), pp. 677-700. https://doi. org/10.1177/0266242611431094
Goetz, R. 2010. Defining project goals and objectives. [online]. Available at: <https://www.projectsmart.co.uk/defining-project-goals-andobjectives.php> [Accessed: 7 January 2016].
Goossens, L.H.J. & Van-Gelder, P.H.A.J.M. 2002. Fundamentals of the framework for risk criteria of critical infrastructures in The Netherlands. [online]. Available at: <http://www.citg.tudelft.nl/fileadmin/Faculteit/ CiTG/Over_de_faculteit/Afdelingen/Afdeling_Waterbouwkunde/ sectie_waterbouwkunde/people/personal/gelder/publications/ papers/doc/paper121-18F_1.pdf> [Accessed: 8 December 2015]. Grote, B.K. & Moss, M. 2008. How to measure the effectiveness of risk management in engineering design projects? Presentation of RMPASS: A new method for assessing risk management performance and the impact of knowledge management – including a few results. Research in Engineering Design, 19(2/3), pp. 71-100. https:// doi.org/10.1007/s00163-008-0049-y
Hair, J.F., Black, W.C., Babin, J.B., Andersen, R.E. & Taham, R.I. 2006. Multivariate data analysis. 6th edition. Upper Saddle River, New
Jersey: Pearson/Prentice Hall.
Haughey, D. 2014. Eight key factors to ensuring project success. [online]. Available at: <https://www.projectsmart.co.uk/white-papers/eight-key-factors-to-ensuring-project-success.pdf> [Accessed: 12 March 2016].
Hillson, D. 2009. Managing risk in projects. London: Routledge. Hsu, C., Lien, Y. & Chen, H. 2013. International ambidexterity and firm performance in small emerging economies. Journal of World Business, 48(1), pp. 58-67. https://doi.org/10.1016/j.jwb.2012.06.007 Hwang, B. & Lim, E. 2013. Critical success factors for key project players and objectives: Case study of Singapore. Journal of Construction, Engineering Management, 139(2), pp. 204-215. https:// doi.org/10.1061/(ASCE)CO.1943-7862.0000597
Imbeah, W. & Guikema, S. 2009. Managing construction projects using the advance programmatic risk analysis and management model.
Journal of Construction Engineering and Management, 135(8), pp. 772-781. https://doi.org/10.1061/(ASCE)0733-9364(2009)135:8(772) IRM (Institute of Risk Management). 2002. A risk management standard. London: The Institute of Risk Management.
Johnson, R.A. & Wichern, D.W. 2007. Applied multivariate statistical analysis. 6th ed. Upper Saddle River, New Jersey: Pearson.
Jurgensen, K., Duijm, N.J. & Troen, H. 2010. Accident prevention in SME using ORM. Safety Science, 48(8), pp. 1036-1043. https://doi. org/10.1016/j.ssci.2010.02.008
Kalane, L. 2015. Reasons for failure of SMEs in the Free State. PhD thesis, University of the Free State, Bloemfontein, South Africa. Kamau, C.G. & Mohamed, H.G. 2015. The efficacy of monitoring and evaluation function in achieving project success in Kenya. Science
Journal of Business and Management, 3(3), pp. 82-94. https://doi. org/10.11648/j.sjbm.20150303.14
Karimi A., Mousavi N., Mousavi S. & Hosseini S. 2010. Risk assessment model selection in construction industry. Expert Systems with
Applications, 38(2), pp. 9105-9111.
Kolbehdori, S. & Sobhiyah, M.H. 2014. Effect of negotiations about the formation of construction consortium on consortium successful performance in Iran’s construction industry. International Journal of Management, Accounting and Economy, 1(5), pp. 346-349.
Kraus, S., Rigtering, C., Hughes, M. & Hosman, V. 2012. Entrepreneurial orientation and the business performance of SMEs: A quantitative study from The Netherlands. Review of Managerial Science, 6(2), pp. 161-182. https://doi.org/10.1007/s11846-011-0062-9
Krejcie, R.V. & Morgan, D.W. 1970. Determining sample size for research activities. Educational and Psychological Measurement, 30(3), pp. 607-610. https://doi.org/10.1177/001316447003000308 Kutsch, E. & Hall, M. 2005. Intervening conditions on the management of project risk: Dealing with uncertainty in information technology projects. International Journal of ProjectManagement, 23(8), pp.591-599. https://doi.org/10.1016/j.ijproman.2005.06.009
Leboea, S.T. 2017. The factors influencing SME failure in South Africa. Unpublished Master’s thesis. Cape Town: University of Cape Town, Graduate School of Business.
Lorenzo-Seva, U., Timmerman, M.E. & Kiers, H.A. 2011. The Hull method for selecting the number of common factors. Multivariate Behavioral Research, 46(2), pp. 340-364. https://doi.org/10.1080/00273171.2011. 564527
Manfredi, R. & Auletta, J. 2013. The importance of resource management for any successful project plan. [online]. Available at: <http://community.bamboosolutions.com/media/p/58056.aspx.> [Accessed 10 January 2016].
Marcelino-Sádaba, S., Pérez-Ezcurdia, A., Echeverría Lazcano, A.M. & Villanueva, P. 2014. Project risk management methodology for small firms. International Journal of Project Management, 32(2), pp. 327-340. https://doi.org/10.1016/j.ijproman.2013.05.009
Martins, C.G. 2006. Aplicação das Técnicas de Identificação de Risco em Projetos de E and P. 2006. 93f. Monografia (Pós-Graduação-MBA em Engenharia Econômica e Financeira)-Universidade Federal Fluminense -UFF. Niterói.
Moyo, A. & Crafford, G.J. 2010. The impact of hyperinflation on Zimbabwean construction industry. Acta Structilia, 17(2), pp. 53-83. Mutezo, A. 2013. Credit rationing and risk management for SMEs: The way forward for South Africa. Corporate Ownership & Control, 10(2), pp. 153-163. https://doi.org/10.22495/cocv10i2c1art1
Muthuramalingam, J. 2008. Effective resources management in construction industries for success. Modern Applied Science, 2(6), pp. 1-8. https://doi.org/10.5539/mas.v2n6p41
Naidoo, P.K. 2012. The effect of risk management on the success of a project. Master’s thesis. Faculty of Engineering and the Built Environment, University of Johannesburg, Johannesburg, South Africa.
Napp, A.K. 2011. Financial risk management in SME – The use of financial analysis for identifying, analyzing and monitoring internal financial risks. Master’s thesis. Aarhus School of Business, Aarhus University, Aarhus, Denmark.
Netemeyer, R.G., Bearden, W.O.E. & Sharma, S. 2003. Scaling procedures: Issues and applications. Thousand Oaks, California: Sage. https://doi.org/10.4135/9781412985772
Nieto-Morote A., & Ruz-Vila, F. 2011. A fuzzy approach to construction project risk assessment. International Journal of Project Management,
29(2), pp. 220-231. https://doi.org/10.1016/j.ijproman.2010.02.002 Nieuwenkamp, R. 2016. The Global Construction Sector Needs a Big Push on Corporate Responsibility. OECD Insights Debates and Issues. [online]. Availble at: <http://oecdinsights.org/2016/08/22/ global-construction-sector-corporate-responsibility/> [Accessed: 22 Maart 2017].
Nunes, P.M., Viveiros, A. & Serrasqueiro, Z. 2012. Are the determinants of young SME profitability different? Empirical evidence using dynamic estimators. Journal of Business Economics and Management, 13(3), pp. 443-470. https://doi.org/10.3846/16111699.2011.620148
Olander, S. & Landin, A. 2005. Evaluation of stakeholder influence in the implementation of construction projects. International Journal
of Project Management, 23(4), pp. 321-328. https://doi.org/10.1016/j. ijproman.2005.02.002
Omphile, W. 2011. The implication of project risk management maturity on information technology project success. Master’s thesis, University of Johannesburg, Johannesburg, South Africa.
Oztas, A. & Okmen, O. 2005. Judgmental risk analysis process development in construction projects. Building and Environment, 40(9), pp. 1244-1254. https://doi.org/10.1016/j.buildenv.2004.10.013 Pallant, J. 2013. SPSS survival manual: A step by step guide to data analysis using IBM SPSS. 5th ed. Allen and Unwin, Australia.
Papke-Shields, K.E., Beise, C. & Quan, J. 2010. Do project managers practice what they preach, and does it matter to project success?
International Journal of Project Management, 28(7), pp. 650-662. https://doi.org/10.1016/j.ijproman.2009.11.002
Perera, V. 2016. Five deadly sins of small business failure. Malaymail Online.
Phoya, S. 2012. Health and safety risk management in building construction sites in Tanzania: The practice of risk assessment and control. Master’s thesis. Chalmers University of Technology, Gothenburg, Sweden.
Poba-Nzaou, P., Raymond, L. & Fabi, B. 2014. Risk of adopting mission-critical OSS applications: An interpretive case study. International
Journal of Operations & Production Management, 34(4), pp. 477-512. https://doi.org/10.1108/IJOPM-03-2012-0117
Prabhakar, G.P. 2008. What is project success? A literature review.
International Journal of Business and Management, 3(9), pp. 1-10. Ramlee, S. & Berma, B. 2013. Financial gap in Malaysian small-medium enterprises: A supply-side perspective. South African Journal of Economic and Management Sciences, 16(5), pp. 115-126. https:// doi.org/10.4102/sajems.v16i5.641
Rezakhani, P. 2012. The current state of existing project risk modeling and analysis methods with a focus on fuzzy risk assessment. Frattura
ed Integrita Strutturale, 20, pp. 17-21.
Roque, R. & De Carvalho, Y. 2013. The impact of project risk management, assessment of risks on project performance in Brazillian vendor companies. International Journal of Project Management,
21(2), pp. 97-105.