Original article
Neural networks for automatic scoring
of arthritis disease activity on
ultrasound images
Jakob Kristian Holm Andersen,1 Jannik Skyttegaard Pedersen,1
Martin Sundahl Laursen,1 Kathrine Holtz,1 Jakob Grauslund,2
Thiusius Rajeeth Savarimuthu,1 Søren Andreas Just 3
To cite: andersen JKH, Pedersen JS, laursen MS, et al. neural networks for automatic scoring of arthritis disease activity on ultrasound images. RMD Open 2019;5:e000891. doi:10.1136/ rmdopen-2018-000891
►Prepublication history and additional material for this paper are available online. to view these files, please visit the journal online (http:// dx. doi. org/ 10. 1136/ rmdopen- 2018- 000891).
received 28 December 2018 revised 18 February 2019 accepted 24 February 2019
1the Maersk Mc-Kinney Moller
institute, Syddansk Universitet, Odense, Denmark
2research Unit of
Ophthalmology, Department of Opthalmology, Odense Universitetshospital, Odense, Denmark
3Department of rheumatology,
Odense Universitetshospital, Odense, Denmark
Correspondence to
Dr Søren andreas Just; soeren. andreas. just@ rsyd. dk © author(s) (or their employer(s)) 2019. re-use permitted under cc BY-nc. no commercial re-use. See rights and permissions. Published by BMJ.
Key messages
What is already known about this subject? ► this is the first study using convolutional neural
net-work (cnn) technology to classify disease activity using the OMeract-eUlar Synovitis Scoring (OeSS) system on Doppler US (DUS) images from patients with rheumatoid arthritis (ra).
What does this study add?
► the cnn architectures tested can be used for eval-uating joint DUS images, both for healthy/disease classification and more complex classification using the full-scale OeSS system.
How might this impact on clinical practice? ► this technology could possibly be used as a more
unbiased method for scoring US arthritis activity in both daily clinical practice and clinical trials in the future.
AbstrAct
Background the development of standardised methods for ultrasound (US) scanning and evaluation of synovitis activity by the OMeract-eUlar Synovitis Scoring (OeSS) system is a major step forward in the use of US in the diagnosis and monitoring of patients with inflammatory arthritis. the variation in interpretation of disease activity on US images can affect diagnosis, treatment and outcomes in clinical trials. We, therefore, set out to investigate if we could utilise neural network architecture for the interpretation of disease activity on Doppler US images, using the OeSS scoring system.
Methods two state-of-the-art neural networks were used to extract information from 1342 Doppler US images from patients with rheumatoid arthritis (ra). One neural network divided images as either healthy (Doppler OeSS score 0 or 1) or diseased (Doppler OeSS score 2 or 3). the other to score images across all four of the OeSS systems Doppler US scores (0–3). the neural networks were hereafter tested on a new set of ra Doppler US images (n=176). agreement between rheumatologist’s scores and network scores was measured with the kappa statistic.
Results For the neural network assessing healthy/ diseased score, the highest accuracies compared with an expert rheumatologist were 86.4% and 86.9% with a sensitivity of 0.864 and 0.875 and specificity of 0.864 and 0.864, respectively. the other neural network developed to four class Doppler OeSS scoring achieved an average per class accuracy of 75.0% and a quadratically weighted kappa score of 0.84.
Conclusion this study is the first to show that neural network technology can be used in the scoring of disease activity on Doppler US images according to the OeSS system.
BaCkgRound
To have an early disease detection and to follow a treat to target strategy in disease moni-toring are key elements in the management of rheumatoid arthritis (RA).1 Colour or Power Doppler modes in ultrasound (US) imaging can be used for detection of subclinical disease, prediction of radiographic progres-sion and early detection of disease flare.2 3
Operator dependence and lack of interob-server agreement have been longstanding issues in the use of US in diagnosis and disease management.4 The OMERACT-EULAR Syno-vitis Scoring (OESS) system introduces a more standardised approach to performing and interpreting disease activity when using US of joints in patients with inflammatory arthritis.2 5 The OESS system utilises both the grey scale (GS) mode and Doppler US (DUS) mode and both are scored semiquantitatively on a scale from 0 to 3, which hereafter can be used to determine a combined score (0–3). In this study, we focus on DUS imaging as it has been shown to be very sensitive for detecting disease activity and predict erosive disease.6 Although more standardised, disease activity evaluated by the OESS system on US data is still subject to interobserver variability due to biases inherent to human expert evalua-tors.2 7 8 This could affect patient diagnosis, treatment selection and possibly outcomes in
on May 7, 2020 by guest. Protected by copyright.
http://rmdopen.bmj.com/
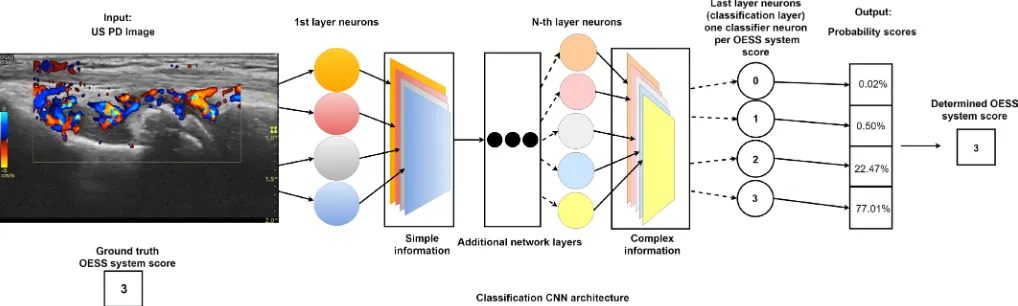
Figure 1 Illustration of convolutional neural network (CNN) automatically scoring Outcome Measures in Rheumatology (OMERACT)-EULAR disease activity on an ultrasound (US) image. Neural network scoring rheumatoid arthritis (RA) disease activity, according to the OMERACT-EULAR Synovitis Scoring (OESS) system, on an US Colour Doppler image of the wrist. An US expert has given the OESS score of 3. The US image is passed through the network where specialised neurons extract increasingly complex information. Each neuron constructs an information map that represents how much of each information at different levels of complexity is present in the image. At the end of the network, classifier neurons map the information to probability scores for each class (OESS system scores). The class with the highest probability represents the RA disease activity score given by the network.
clinical trials. To avoid this bias, all US data from an, for example, multicentre clinical trial could be evaluated by the same convolutional neural network (CNN), in order to classify disease activity on all images.
In recent years, CNNs have been established as the state-of-the art approach for automatic image recogni-tion and analysis.9 Today, CNNs are the gold standard for automatic image classification.9 The power of CNNs stems from their ability to extract increasingly complex features from data through a series of transformation layers called convolutional layers (see figure 1).10 The parameters of the CNN layers are learnt from exposure to ground truth annotated data, that is, images where an expert has clas-sified the disease activity score by the OESS system. Using a learning algorithm, the CNN iteratively adjusts its func-tional parameters in order to optimise its performance.10 CNNs extract information from the US images in a hier-archical manner from simple to complex (figure 1). This information is used as input to a linear classifica-tion algorithm, which enables the CNN to distinguish between images belonging to different categories, for example, OESS system scores.10 Information is extracted by applying convolutional filters across an image. Hierar-chical information extraction describes the principle that the information extracted early in CNN architectures is simple and generic, or general to most types of data. In the deeper parts of the network, the information is more complex. We, therefore, also examined how information extracted from the US images in the different convolu-tional layers with varying degrees of complexity affect the performance of classification algorithms.
In this study, we aimed to investigate if an artificial intel-ligence deep learning method in the form of CNNs could be used for automatic scoring of disease activity on DUS images from patients with RA patients and classify them by the OESS system, in order to increase the objectivity of
disease activity scoring on US images, in both daily clin-ical care and clinclin-ical trials.
MeTHods Materials
Data in this study came from an RA study ( ClinicalTrials. gov: NCT02652299), where 40 patients with RA were followed for 6 months with repeat synovial biopsies from the wrist at baseline and 6 months. The hand where syno-vial biopsies were taken from was US scanned at baseline, 3 and 6 months. The RA group consists of 20 patients with longstanding disease (>5 years) and 20 with early untreated disease. The joints scanned according to OESS guidelines were: the wrist divided into two positions (the radiocarpal–intercarpal joint and the radioulnar joint), the proximal interphalangeal and the metacar-pophalangeal joints. A total of 1694 DUS images were used in this study. Images were captured using a General Electric Logic 9 US machine and a linear array ML6-15 transducer with adjusted Colour Doppler for noise elim-ination. Colour Doppler, and not Power Doppler, was used as it can be substituted in the OESS when working with machines given that the former has a better sensi-tivity.2 11 All images were anonymised. A rheumatologist with approximately 9 years of experience with US scan-ning in patients with RA scored the anonymised images according to the four-point DUS OESS system scale.
data structure
Data was split into separate training, validation and test sets prior to training of the classification algorithms. The validation set was used to tune parameters of the learning algorithm during training, while the test set was used to evaluate final performance of the networks. Table 1
on May 7, 2020 by guest. Protected by copyright.
http://rmdopen.bmj.com/
Table 1 How Doppler ultrasound images with OESS scores were divided into a training, validation and test set Binary scores Healthy Diseased
Total
OESS scores 0 1 2 3
Training set 654 337 219 132 1342
Validation set 44 44 44 44 176
Test set 44 44 44 44 176
Total 742 425 307 220 1694
1167 527
[image:3.595.41.290.671.728.2]OESS, Outcome Measures in Rheumatology (OMERACT)-EULAR Synovitis Scoring.
Table 2 The US images with Doppler US OESS scores in the final training set
Binary scores Healthy Diseased Total OESS scores (0–3) 0 1 2 3
Training set (n images) 654 674 657 660 2645 Total images (n) 1328 1317
OESS, OMERACT-EULAR Synovitis Scoring; US, ultrasound. shows the distribution of images in the data set across the four OESS system scores.
Table 1 also shows the subdivision of images into the healthy and diseased category. Forty-four randomly selected images from each OESS system score were allo-cated to the test and validation sets. This yielded 176 images in each set with an equal distribution across the OESS system scores. The remaining images (n=1342) were kept in the training set. The distribution of images in the training set was unequal across the four OESS system scores. Since training classification algorithms on data where one class is over-represented can bias the classifier towards this class. To avoid this, an unbiased training set was created by oversampling the under-rep-resented OESS scores. The resulting unbiased training set distribution is shown in table 2.
The extraction of information and training of classi-fiers on the final training set (table 2) was performed using the high-level neural network application program-ming interface Keras with the TensorFlow numerical computation library back end.12 13 CNN architectures were imported in Keras and loaded with parameters pretrained on the ImageNet data set.9
neural network designs
Two CNNs with different basic architectures were designed and tested.
the neural network classifying as either healthy or diseased
The VGG-16 architecture was used for extraction and subsequent classification of RA joint disease activity defined as either healthy (DUS OESS scores 0 and 1) or diseased (DUS OESS scores 2 and 3).6 14 Informa-tion extracted from the last convoluInforma-tional layer of the
network was used as input to a logistic regression classi-fier. The classifier was trained using a learning algorithm that iteratively adjusted the parameters of the classifier to improve classification performance. At fixed intervals during training, validation set images were classified to get an indication of the true performance on images not contained in the training set. Once performance stopped improving, the training was terminated. The trained clas-sifier was subsequently evaluated on test set images.
the neural network classifying across all DUS OeSS scores
The Inception-v3 architecture was used for extraction and subsequent classification of RA joint disease activity across all DUS OESS scores (0–3).15 The Inception-v3 architecture has a modular architecture consisting of the so-called Inception modules. Each module extracts information at different resolutions of the input. After each Inception module, the information is combined in a layer referred to as a mixed layer. The Inception-v3 architecture consists of 11 of these mixed layers (0–10). The hierarchical nature of CNNs also applies to the mixed layers, meaning that the information contained in mixed layer 0 is more generic than that contained in mixed layer 10. We took advantage of this modular architecture in order to investigate how information from different depths of the network affected classifica-tion performance. Informaclassifica-tion was extracted from each mixed layer (0–10) and used to train custom classifiers. The classifiers were trained using a learning algorithm that iteratively adjusted the parameters to improve clas-sification performance. The performance was evaluated on validation set images during training. We identified the best performing classifier of the 11 mixed layers (one classifier per mixed layer) which yielded the highest four class OESS classification accuracy. Information from this mixed layer was used in an ensemble classification method, where 10 classifiers were trained using slightly different training parameter settings. This ensemble was used to classify images from the test set by combining the scores from each classifier in a single score given by the ensemble.
statistics
Images in the test set were used to determine the per OESS score accuracy of the classifiers. Agreement was measured using Cohen’s kappa statistic for DUS OESS system scores assigned by the trained classifiers and an expert rheumatologist.
ResulTs
neural network classifying as either no or low level, or high level
Comparison of the scores assigned by the no or low level/ high level CNN were compared with the scores assigned by an expert rheumatologist (table 3). The CNN achieved a test accuracy of 86.4% with sensitivity and specificity of 0.864 and an area under the receiver operator character-istic curve of 0.93.
on May 7, 2020 by guest. Protected by copyright.
http://rmdopen.bmj.com/
Table 5 Comparison between the binary scores of the improved neural network and the expert rheumatologist
Convolutional neural network scores Healthy Diseased Rheumatologist score Healthy 76 (86.4%) 12 (12.5%)
Diseased 12 (13.6%) 7 (87.5%) Binary classification performance (healthy/diseased) on the test set images for mixed layer 4. Percentages in parenthesis show from top left to bottom right: true negative, false positive, false negative and true positive classified images.
Table 3 Comparison between healthy/diseased scores of the CNN and the expert rheumatologist
CNN
Healthy Diseased
Rheumatologist Healthy, n (%) 76 (86.4%) 12 (13.6%)
Diseased, n (%) 12 (13.6%) 76 (86.4%)
Binary classification performance (healthy/diseased) on the test set. Percentages in the parenthesis show from top left to bottom right: true negative, false positive, false negative and true positive classified images.
[image:4.595.41.556.622.728.2]CNN, convolutional neural network.
Table 4 Classification results for CNN developed for all Doppler US OESS scores CNN across all Doppler US OESS score
Total
0 1 2 3
Rheumatologist 0 39 4 1 0 44
1 5 28 11 0 44
2 0 11 29 4 44
3 0 0 8 36 44
Accuracy 88.6% 63.6% 65.9% 81.8% 75.0%
CNN, convolutional neural network; OESS, OMERACT-EULAR Synovitis Scoring; US, ultrasound. neural network classifying across all dus oess scores
The mixed layer yielding the highest average accuracy with 70.5% for classification across all four DUS OESS system scores was mixed with layer 4. For this layer, the per class accuracies for DUS OESS scores 0–3 were 79.5%, 59.1%, 68.2% and 75.0%, respectively. Different mixed layers yielded different accuracies for each of the four OESS scores. The highest accuracy achieved for DUS OESS score 0 was 84.1% using mixed layer 3. For score 1, an accuracy of 75.0% was achieved using mixed layer 6. Mixed layer 7 yielded the highest accuracy for OESS score 2 with 75.0% and for score 3, the highest accuracy of 88.6% was achieved using mixed layer 1. Data that summarises the per class and average accuracies achieved by training a classifier on infor-mation extracted from each mixed layer of the Inception-v3 architecture can be seen in the online supplementary mate-rial table 1. Table 4 summarises the classification results for the ensemble classification method using the 10 classifiers trained on mixed layer 4. The ensemble method coupled with a more thorough search for the best training param-eter settings resulted in an increase in the average accuracy of 4.5 percentage points from 70.5% on the validation set to 75.0%. Table 4 illustrates the distribution of correctly and incorrectly classified images across the four OESS system scores. Only a single incorrectly classified image was wrong by more than a single score compared with the ground truth scores assigned by the expert rheumatologist. Using Cohen’s kappa as a measure of agreement, we found values of 0.61, 0.74 and 0.84 for unweighted, linear weighted and quadratically weighted kappa scores, respectively.
Table 5 shows the binary classification accuracy achieved by adapting the ensemble method classifiers trained on
mixed layer 4 features to binary classification (healthy/ diseased). Binary RA scores were determined by majority vote healthy (OESS scores 0 and 1) and diseased (OESS scores 2 and 3) among the 10 classifiers in the ensemble. The ensemble yielded a binary classification accuracy of 86.9% with a sensitivity of 0.875 and specificity of 0.864. The agreement found using the kappa statistic for the binary ensemble classifier was 0.78.
disCussion
We herein present the first study evaluating if CNN tech-nology can be used to classify disease activity according to the OESS system using 1694 DUS images from the wrist and hand of patients with RA with early or longstanding disease. Our results demonstrate a number of important findings. First, both CNN architectures tested (VGG-16 and Inception-v3) can be used for evaluating joint DUS images. Second, both CNN designs achieve high accuracies for no or low level/high level classification of, respectively, 86.4% and 86.9%. Third, our result suggests that CNNs can do more complex classification of DUS images, for example, using the full-scale OESS system with an accuracy of 75% and a quadratically weighted kappa score of 0.84.
To our knowledge, this is the first study using CNN technology to classify disease activity on DUS images from patients with RA. The evaluation is important as the interpretation of disease activity on imaging modal-ities has a both intraindividual and interindividual vari-ation. This bias can affect the timely diagnosis for a patient, estimation of disease activity and thereby risk of long-term joint damage, correct treatment selection or
on May 7, 2020 by guest. Protected by copyright.
http://rmdopen.bmj.com/
outcome of a multicentre clinical study. That images are evaluated by the same CNN, without human bias, could potentially make US results more comparable between centres/countries and different clinical trials. Another important aspect is that in several countries, there is a lack of resources for the musculoskeletal imaging experts to perform standardised descriptions of X-ray, US or MRI images.16 17 Here, CNN technology could be an essen-tial help, delivering fast, timely and standardised results to the rheumatologist. Another important aspect is the acquisition of the US images for automated scoring, where using standardised methods for securing high-quality images for evaluation should be a priority.
We are working on several aspects of optimising the CNN designs for better US imaging interpretation. One optimisation could be to combine classifiers trained on information extracted from different mixed layers into an ensemble of classifiers which could potentially yield a higher classification accuracy. In this study, we analysed DUS images, but we are also working on algorithms for the US images taken in GS mode, also to be classified according to the OESS system.
A strength in this study is that patients with RA from all different stages of disease are included and that all images are from the wrist and hand. We are currently working on collecting more scored US images and including other joints described in the OESS system, for example, knee and feet which are also often affected in RA. More data would most likely increase the performance of the auto-mated scoring algorithms. A potential limitation in the study is that all DUS OESS scores were evaluated by a single expert; multiple expert annotations might have improved the outcome.
The ability to have a CNN that scores disease activity on all US images from, for example, a multicentre RA trial, would remove the interobserver and intraobserver variability seen in human scoring. This would ensure that all images are scored in the same way. The same approach could be made for the development of CNNs for the disease activity scoring on MRI data or degree of erosions on joint X-rays. Further CNN designs could combine data from several specialised CNNs (eg, US, MRI or pathology analysis) and search for disease markers or patterns, we humans have not spotted due to the large amount of data.
In conclusion, this study is the first to show that neural network technology can be used for the scoring of disease activity on DUS images, by OESS system. This technology could possibly be used as a more unbiased method for scoring US arthritis activity in both daily clinical practice and trials in the future.
acknowledgements We would like to thank all the participants in the Synra study.
Contributors JKHa, SaJ and trS contributed to the design and conception of the study. SaJ and JKHa contributed to the collection of data. JSP, MSl, Jg and KH contributed equally in the analysis of data and production of results. all authors
were involved in the drafting and revising of the manuscript. all authors gave approval of the final version to be published and agreed to be accountable for all aspects of the work.
Funding the authors have not declared a specific grant for this research from any funding agency in the public, commercial or not-for-profit sectors.
Competing interests none declared.
Patient consent for publication not required.
ethics approval the Synra study, where US images are from, is approved by the regional ethics review board (S-20140062) and the Danish data protection agency (2008-58-0035). all participants gave oral and written consent to participate.
Provenance and peer review not commissioned; externally peer reviewed.
data sharing statement no additional data are available.
open access this is an open access article distributed in accordance with the creative commons attribution non commercial (cc BY-nc 4.0) license, which permits others to distribute, remix, adapt, build upon this work non-commercially, and license their derivative works on different terms, provided the original work is properly cited, appropriate credit is given, any changes made indicated, and the use is non-commercial. See: http:// creativecommons. org/ licenses/ by- nc/ 4. 0/.
RefeRences
1. McInnes IB, Schett G. Pathogenetic insights from the treatment of rheumatoid arthritis. Lancet 2017;389:2328–37.
2. Terslev L, Naredo E, Aegerter P, et al. Scoring ultrasound synovitis in rheumatoid arthritis: a EULAR-OMERACT ultrasound taskforce-Part 2: reliability and application to multiple joints of a standardised consensus-based scoring system. RMD Open 2017;3:e000427. 3. Paulshus Sundlisæter N, Aga A-B, Olsen IC, et al. Clinical and
ultrasound remission after 6 months of treat-to-target therapy in early rheumatoid arthritis: associations to future good radiographic and physical outcomes. Ann Rheum Dis 2018;77:1421–25. 4. Scheel AK, Schmidt WA, Hermann K-GA, et al. Interobserver
reliability of rheumatologists performing musculoskeletal ultrasonography: results from a EULAR "Train the trainers" course.
Ann Rheum Dis 2005;64:1043–9.
5. D'Agostino M-A, Terslev L, Aegerter P, et al. Scoring ultrasound synovitis in rheumatoid arthritis: a EULAR-OMERACT ultrasound taskforce-Part 1: definition and development of a standardised, consensus-based scoring system. RMD Open 2017;3:e000428. 6. Hammer HB, Kvien TK, Terslev L. Ultrasound of the Hand is
sufficient to detect subclinical inflammation in rheumatoid arthritis remission: a post hoc longitudinal study. Arthritis Res Ther 2017;19. 7. Terslev L, Naredo E, Aegerter P, et al. Scoring ultrasound synovitis
in rheumatoid arthritis: a EULAR-OMERACT ultrasound taskforce-Part 2: reliability and application to multiple joints of a standardised consensus-based scoring system. RMD Open 2017;3.
8. Hammer HB, Bolton-King P, Bakkeheim V, et al. Examination of intra and interrater reliability with a new ultrasonographic reference atlas for scoring of synovitis in patients with rheumatoid arthritis. Ann
Rheum Dis 2011;70:1995–8.
9. Russakovsky O, Deng J, Su H, et al. ImageNet large scale visual recognition challenge. Int J Comput Vis 2015;115:211–52. 10. LeCun Y, Bengio Y, Hinton G. Deep learning. Nature
2015;521:436–44.
11. Torp-Pedersen S, Christensen R, Szkudlarek M, et al. Power and color Doppler ultrasound settings for inflammatory flow: impact on scoring of disease activity in patients with rheumatoid arthritis.
Arthritis Rheumatol 2015;67:386–95.
12. Chollet F. Keras, 2015. Available: https:// keras. io
13. OSDI. TensorFlow: a system for large-scale machine learning, 2016. 14. Simonyan K, Zisserman A. Very deep convolutional networks for
large-scale image recognition. arXiv preprint arXiv 2014;14091556. 15. Rethinking the inception architecture for computer vision.
Proceedings of the IEEE conference on computer vision and pattern recognition, 2016.
16. Al Maini M, Adelowo F, Al Saleh J, et al. The global challenges and opportunities in the practice of rheumatology: white paper by the world Forum on rheumatic and musculoskeletal diseases. Clin
Rheumatol 2015;34:819–29.
17. Deal CL, Hooker R, Harrington T, et al. The United States rheumatology workforce: supply and demand, 2005-2025. Arthritis
Rheum 2007;56:722–9.
on May 7, 2020 by guest. Protected by copyright.
http://rmdopen.bmj.com/