Abstract
—
Adsorption characteristics of reactive orange dye using dead cells of brewery yeast obtained from a beer brewery was studied. The adsorption equilibrium capacity of reactive orange dye onto the biomass increased with decreasing initial pH and with increasing temperature of the solution. Adsorption equilibrium of the reactive orange dye onto the biomass could be represented by the Langmuir equation. The internal diffusion coefficients were determined by comparing the experimental concentration curves with those predicted from the surface diffusion model and the pore diffusion model. And the experimental data can be described using the pore diffusion model.Index Terms— adsorption, biomass, brewery yeast, dye,
reactive orange
I. INTRODUCTION
Dye pollutants from the textile industry are important source of environment contamination. They pose serious environmental problems because of their color, low biochemical oxygen demand (BOD) and high chemical oxygen demand (COD). Vinyl sulfone and chlorotriazine dyes constitute the largest and most important class of commercial dyes in wastewater. These dyes can be used for cotton, silk, wool, rayon, paper and wood but not for synthetic fibers. They are mostly non-biodegradable and resistant to destruction by conventional wastewater treatments [1]. Recent studies indicated that toxic and refractory organic compounds including dyes in wastewater can be destroyedby the most advanced biosorption processes (AOPs) [2]–[5].
Manuscript received July 17, 2008.
The authors wish to acknowledge a grant-in-aid for research from BK 21 team for the Environmentally Friendly Core Material and Process Development and CPMD at CNU.
T. Y. Kim, Dr., is with the Environmental Engineering Department, Chonnam National University, Gwangju, 500-757, Korea (e-mail : [email protected])
B. J. Min, M. S., is with the Environmental Engineering Department, Chonnam National University, Gwangju, 500-757, Korea (e-mail : [email protected])
S. S. Park, Professor, is with the Environmental Engineering Department, Chonnam National University, Gwangju, 500-757, Korea (e-mail : [email protected])
S. Y. Cho, Professor, is with the Environmental Engineering Department, Chonnam National University, Gwangju, 500-757, Korea (e-mail : [email protected])
S. J. Kim, Professor, is with the Environmental Engineering Department, Chonnam National University, Gwangju, 500-757, Korea (e-mail : [email protected])
Biosorption is a process that utilizes biological materials as adsorbents, and this method has been studied by several researchers as an alternative technique to conventional methods for heavy metals and dyes removal from wastewater [6]-[9].
The binding mechanisms of dyes by biosorption could be explained by the physical and chemical interactions between cell wall ligands and adsorbates by ion exchange, complexation, coordination and microprecipitation. The diffusion of the dye from the bulk solution to active sites of biosorbents occurs predominantly by passive transport mechanisms [10] and various functional groups such as carboxyl, hydroxyl, amino and phosphate existing on the cell wall of biosorbents can bind the dyes [11]. Living or dead biomass can be used to remove dyes but maintaining a living biomass during dye biosorption is difficult because it requires a continuous supply of nutrients and toxicity of metal for microorganism might take place. On the other hand, the use of dead biomass can avoid these problems and the used cells can be easily regenerated [12].
In this work, the waste brewery yeast was obtained from a fermentation process of a brewery plant, and the biosorption of reactive orange (RO 16) was studied in terms of initial pH, and temperature. Biosorption equilibria and kinetics over the temperature range of 288 K – 308 K were studied experimentally and theoretically.
II. MATERIALS AND METHODS
A. Preparation of biosorbent and test solution
The biomass, collected from a brewery plant, was washed several times with distilled water, and then dried in a vacuum drying oven at 353 K for 48 h. The dried biomass was grounded with a mortar and pestle. The particles were separated using the US standard testing sieve (No. 100 No. 200) and stored in a sealed bottle with a silica gel to prevent readsorption of moisture.
One well-known dye classification system of internationally used is the Colour Index, devised by the Society of Dyes and Colourists in 1924. This classifies dyes by assigning a generic name, firstly, determined from its application characteristics, and then assigning a CI constitution number based on its chemical structure if known. Dyes can be classified by their chemical structure or application method. In this study, the dye investigated is Polazol Orange and whose CI number is reactive orange 16 (RO 16).
Separation Characteristics of Reactive Orange
Dye from Aqueous Solution Using Biosorbent
B. Biosorption equilibrium
The reactive orange (RO 16, Aldrich Chemical Co.) was dissolved in deionized water to the required concentration. The pH of dye solutions were adjusted to 3, 7 and 10 using HCl or NaOH, respectively. For adsorption equilibrium experiments, the biosorbent (0 - 0.7 g) and the dye solution (200 cm3) were placed in a 300 cm3 flask and then shaken for 2 days in a shaking incubator. The dye concentration of the solutions was analyzed using UV-VIS spectrometer (UV-1601, Shimadzu) at wavelength of 598 nm. The amount of adsorption at equilibrium,
q
e(mol/kg), was obtained as follows:(1) Here qe is the equilibrium amount adsorbed on the biomass
(mol/kg), and are the initial and equilibrium solution concentrations (mol/m3), respectively, V is the volume of the solutions (m3) and W is the weight of the biomass used (kg)
C. Biosorption kinetics
Batch adsorption experiments were conducted in a Carberry-type batch adsorber. The effect of biomass concentration on the biosorption was studied experimentally by contacting various amounts of biosorbent with 1 L of the solution. The temperature of the mixture was kept at 298 K and the experiments were carried out at approximately 400 rpm, since the film mass transfer coefficient, kf, is practically
constant at this condition. The samples were withdrawn at pre-determined time intervals, centrifuged and then analyzed for residual reactive dye concentration.
III. RESULTS AND DISCUSSION
A. Characterization of biomass
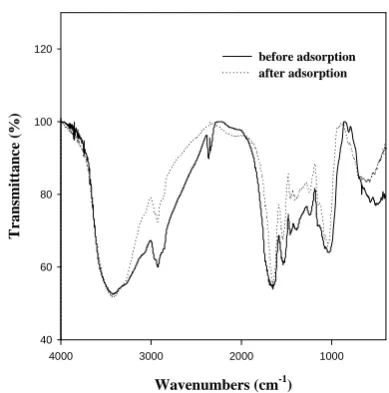
The functional groups on the surface of the biomass were analyzed using FT-IR spectrophotometer (300E, JASCO, Japan) and Bohem method. Infrared spectroscopy was used to analyze the functional groups in the biomass, and Fig. 1 shows the main frequency and functional groups of the biomass. Volesky and Niu [13] reported that the involvement of amino groups in Bacillus subtilis and Penicillium chrysogenum cell walls by for the gold-cyanide binding. Tobin and Roux [14] suggested the possible contribution of amine groups of Mucor cell wall in removal of chromium from tanning effluent. Ashkenazy et al. [15] reported the involvement of nagatively charged -COOH groups of the yeast biomass in Pb biosorption through FT-IR spectroscopic analysis. The role of carboxyl groups of cell wall of alginate in Sargassum fluitans and the involvement of complexation mechanism were reported for the biosorption of heavy metal [16]. Amide 1~3 were observed by Guibal et al. for fungi Aspergillus, Penicillium and Mucor [17].
The FT-IR spectra were obtained for the biomass particles of this study before and after adsorption
Wavenumbers (cm-1) 1000 2000
3000 4000
Tran
smi
tt
a
nce (%
)
40 60 80 100 120
[image:2.595.328.523.69.266.2]before adsorption after adsorption
Fig. 1. FT-IR spectra of the biomass before and after adsorption of reactive dye.
experiments. As shown in Fig. 1, the peak observed at 3418 cm-1 result from the NH2 asymmetric stretch mode of amines.
The peak observed at 3418 cm-1 is slightly broad and seems to be indicative of both amine and bonded OH groups. The peak observed at 2924 cm-1 is indicative of the C-H groups. The peak present at 1646 cm-1 is from CO stretching mode conjugated to a NH deformation mode and is indicative of amine 1 band. The peak present at 1558 cm-1 indicates the presence of amide 2 and results from NH deformation mode conjugated to C=N deformation mode. The peak at 1377 cm-1 indicates the presence of an amide 3 or sulfamide band. The presence of a phosphate groups is indicated by the presence of a weak band in the range 950~990 cm-1.
Fig. 1 also shows the peaks of IR spectra of the biosorbent which is saturated with reactive orange dye. The peaks were substantially lower than those in the raw biosorbent. This change of peaks can be interpreted as the result of weakened bond structure of the biomass due to the reaction between reactive dye and functional groups. From these results, the functional groups which might be involved in the biosorption of reactive dye metals include phosphate, carboxyl, amine and amide groups.
a) Table 1. Physical properties of the biomass.
Properties Values Particle size(mm) 0.075 ~ 0.150
BET surface area(m2/g) 13.15
Average pore radius(Å) 30.32
Total pore volume(cm3/g) 0.0098
Particle density(kg/m3) 418.61
[image:2.595.306.546.605.758.2]The physical properties of biosorbent used in this study are measured (Autosorb-1, Quantachrome Co., USA) and listed in Table 1. The particle size is 0.075 ~ 0.150 mm in diameter, and the specific surface area of the biosorbent (13.15 m2/g) is much smaller than the activated carbon (696 ~ 1,950 m2/g), but it is larger than that of a biosorbent, A. niger (0.23 m2/g) [18]. The average pore radius was 30.32 Å,
B. Adsorption Equilibrium
Adsorption isotherms are very important for the design of an adsorption-based process design. Isotherm models of the Langmuir and the Freundlich [19],[20] were fitted to describe the equilibrium adsorption. These equations of isotherms were given below:
Langmuir isotherm, (2) where Ce is the supernatant concentration at the equilibrium
state of the system (mol/m3), kL is the Langmuir affinity
constant (m3/mol), and qm is the maximum adsorption
capacity of the material (mol/kg) assuming a monolayer of adsorbate uptaken by the adsorbent.
Freundlich isotherm, (3) where kF is the Freundlich constant related with adsorption
capacity (mol/kg)(mol/m3)-1/n and n is the Freundlich exponent (dimensionless).
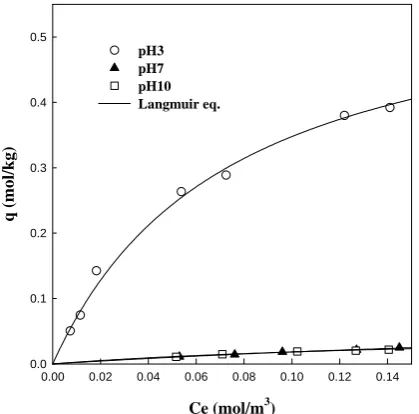
The effect of pH may be an important factor on the dye-binding capacity of the biomass. The biosorption capacities of the reactive dye on various pH values at 100 mg/l of initial dye concentration and the results are presented in Fig. 2. As can be seen in this figure, the biosorption capacity increased with decreasing pH. At low pH, the function groups in the biomass are much easier to be cationized and they adsorb the dye anions strongly by electrostatic attraction.
Ce (mol/m3)
0.00 0.02 0.04 0.06 0.08 0.10 0.12 0.14
q (mol/kg)
0.0 0.1 0.2 0.3 0.4 0.5
[image:3.595.54.264.544.751.2]pH3 pH7 pH10 Langmuir eq.
Fig. 2. Adsorption equilibrium isotherm of RO 16 onto biomass at different initial pHs (298K)
At lower pH values the biomass will have a net positive charge. It is expected that nitrogen containing functional groups such as amines or imadazoles in the biomass will also be protonated at acidic pH values. Higher uptakes obtained at lower pH values may be due to the electrostatic attractions between these negatively charged dye anions and positively charged cell surface. Hydrogen ion also acts as a bridging ligand between the alga cell wall and the dye molecule. The reduction in adsorption capacity of dyes on alga with increasing pH can be attributed to change in surface characteristics and charge. As the pH of the system increases, the number of negatively charged sites increases and the number of positively charged sites decreases. A negatively charged surface site on the sorbent does not favour the adsorption of dye anions due to the electrostatic repulsion. It seems very difficult to explain the adsorption mechanisms with respect to pH due to a large number of variables involved in the sorption of dye anions by the biomass and the complexity of the surface and water chemistry.
In this study, two isotherm models, the Langmuir and Freundlich were used to correlate our experimental equilibrium data. The Langmuir and Freundlich equations have two parameters. To find the parameters for each adsorption isotherm, the linear least square method and the pattern search algorithm (NMEAD) were used. The value of the mean percentage error has been used as a test criterion for the fit of the correlations. The mean percent deviation between experimental and predicted values was obtained using equation 4.
( 4 )
where qcal, k is each value of q predicted by the fitted model
and qexp, k is each value of q measured experimentally, and N
is the number of experiments performed.
The parameters and the average percent differences between measured and calculated values for RO 16 onto the biomass are given in Table 2. As shown in the Table, the Langmuir equation gives the best fit of our data.
Table 2. Adsorption equilibrium constants of RO 16 onto the biomass at different pHs (298.15 K)
pH Isotherm
type Parameters 3 7 10
qm 0.87 0.02 0.02
b 6.17 12.63 23.84
Langmuir
error(%) 2.98 2.61 2.10
k 2.60 0.04 0.03
n
1.18 2.14 3.09
Freundlich
[image:3.595.303.547.582.752.2]Ce (mol/m3)
0.00 0.02 0.04 0.06 0.08 0.10
q (mol
/kg
)
0.0 0.1 0.2 0.3 0.4 0.5
[image:4.595.50.258.71.277.2] [image:4.595.45.289.498.670.2]288 K 298 K 308 K Langmuir eq.
Fig. 3. Adsorption equilibrium isotherm of RO 16 onto biomass at different temperature (pH : 3)
Fig. 3 shows the adsorption capacity of the RO 16 onto the biomass at different temperature. The adsorption amounts of RO 16 onto the biomass decreased with increasing temperature of the solution. Compared to Figs. 1 and 2, the pH effect on the adsorption capacity of the RO 16 onto the biomass was greater than that of temperature. This suggests that the effective separation could be achieved by the adjustment of pH rather than temperature. Adsorption equilibrium constants of RO 16 onto the biomass at different temperature are given in Table 3. From Tables 2 and 3, we believe that the Langmuir equation is suitable for predicting single-component adsorption of the RO 16 onto the biomass. Table 3. Adsorption equilibrium constants of RO 16 onto the
biomass at different temperature (pH : 3) Temperature Isotherm
type Parameters 288 K 298 K 308 K
qm 0.60 0.87 0.16
b
13.52 6.17 8.72
Langmuir
error(%)
2.92 2.98 1.84
k 2.39 2.60 0.54
n 1.31 1.18 1.25
Freundlich
error(%)
3.31 3.11 2.52
C. Batch Adsorption
For the modeling of the adsorption kinetics, one has to pay attention to two problems : ( ) the pore structure of adsorbents and ( ) the mass transfer resistance involved in the adsorption. The adsorption on a solid surface takes place in several steps, such as external diffusion, internal diffusion, and actual adsorption. In general, actual adsorption process is relatively fast compared to the previous two steps.
Intraparticle diffusion has been usually considered as the rate-controlling step in liquid-phase adsorption. However, it is important to estimate the order of magnitude of the mass transfer coefficient. There are several correlations for estimating the film mass transfer coefficient, kf, in a batch
system. In this work, we estimated kf from the initiation
concentration decay curve when the diffusion resistance does not prevail. The transfer rate of any species to the external surface of the adsorbent,
N
A, can be expressed by(5) where is rate of mass transfer of adsobate to the external surface of the biomass (mol/s). is film mass transfer coefficient (m/sec). is surface area of the adsorbent particles, ( m2)
By rearrangement and approximation for a batch system with adsorption time of less than 300 seconds [21].
(6)
where Vs is the volume of solution (m3) and AS is the effective
external surface area of adsorbent particles,
(7) where is total mass of sorbent particle (kg). are particle density (kg/m3) and particle radius (m), respectively.
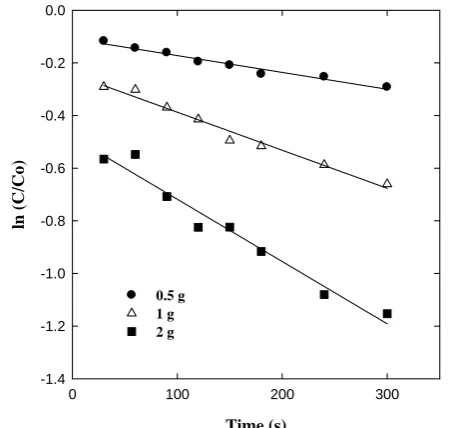
The values of kf for RO 16 onto the biomass obtained
from the slope in Fig. 4 are 1.05 × 10⁻⁴ m/s (for 0.5 g), 0.15 × 10⁻⁴ m/s (for 1.0 g), and 0.11 × 10⁻⁴ m/s (for 2.0 g), respectively.
Time (s)
0 100 200 300
ln
(
C
/C
o
)
-1.4 -1.2 -1.0 -0.8 -0.6 -0.4 -0.2 0.0
0.5 g 1 g 2 g
[image:4.595.315.540.525.739.2]The coefficients of determination between measurement and calculation from the slope are 0.97, 0.98, and 0.96, respectively.
Time (hr)
0.0 0.5 1.0 1.5 2.0 2.5
C/Co
0.0 0.2 0.4 0.6 0.8 1.0 1.2
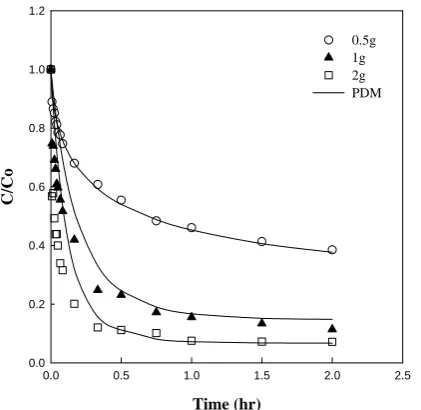
[image:5.595.50.261.108.313.2]0.5g 1g 2g PDM
Fig. 5. Concentration decay corves of RO 16 onto biomass at different dosage (pH : 3, 298 K) Fig. 5 shows the experimental data and model prediction for the adsorption of the RO 16 onto the biomass in a batch adsorber. The initial adsorption rate of RO 16 onto the biomass increased with increasing dosage of the biosorbent. In this study, the pore diffusion coefficient, Dp,
and surface diffusion coefficient, Ds, are estimated by pore
diffusion model (PDM) and surface diffusion model (SDM) [22], [23]. And pore diffusion model is well predicted of our experimental data. The estimated values of
k
f, Dp, and Dsfor the RO 16 onto the biomass in a batch adsorber are listed in Table 4.
Table 4. Kinetic parameters of the RO 16 in a batch reactor ( pH : 3, 298 K)
.
Adsorbate Dosage [g]
x 10-5 [m/s]
x 10-10 [m2/s]
x 10-13 [m2/s]
0.5 4.91 2.91 3.14
1 0.39 6.36 0.29
RO 16
2 1.27 5.73 0.02
IV. CONCLUSION
(1) The Freundlich and Langmuir isotherm models are used for the mathematical description of the biosorption equilibrium of the dye. The adsorption equilibrium data was well described by Langmuir model.
(2) The adsorption capacity of RO 16 onto the biomass increased with decreasing initial pH and temperature. pH effect was greater than that of temperature on the adsorption capacity of reaction dye onto biomass.
(3) The mass transfer resistances of reactive dye were investigated by employing pore diffusion model (PDM) and surface diffusion model (SDM). The experimental data can be described using the pore diffusion model.
(4) The peaks of FT-IR spectra for the biosorbent used for reactive orange adsorption were substantially lower than that for the raw biosorbent. This change of peaks can be interpreted as the result of weakened bond structure of the biomass due to the reaction between reactive dye and functional groups of biomass.
REFERENCES
[1] U. Pagga, D. Brown, “The degradation of dyestuffs part II: behaviorof dyestuffs in aerobic biodegradation tests”, Chemosphere, 15, 1986, pp. 479–491.
[2] E. Kusvuran, O. Gulnaz, S. Irmak, O.M. Atanur, H.I. Yavuz, O.Erbatur, “Comparison of several advanced oxidation processes for the decolorization of Reactive Red 120 azo dye in aqueous solution”, J. Hazard. Mater., B109, 2004, pp. 85–93.
[3] K. Tanaka, K. Padermpole, T. Hisanaga, “Photocatalytic degradation of commercial azo dyes”, Water Res. 34, 2000, pp. 327–333.
[4] I. Arslan, I.A. Balcioglu, D.W. Bahnemann, “Advanced chemical oxidation of reactive dyes in simulated dye house effluents by ferrioxalate-Fenton/UV-A and TiO2/UV-A processes”, Dyes Pigments, 47, 2000, pp. 207–218.
[5] B. Gozmen, M.A. Oturan, N. Oturan, O. Erbatur, “Indirect electrochemical treatment of bisfenol A in water via electrochemically generated Fenton’s reagent”, Environ. Sci. Technol. 37, 2003, pp. 3716–3723.
[6] Jeon, C., Park, J. Y. and Yoo, Y. J., “Removal of Heavy Metals in Plating Wastewater Using Carboxylated Alginic Acid,” Korean J. Chem.Eng., 18, 2001, pp. 955-960.
[7] Sa , Y. and Kutsal, T., “Recent Trends in the Biosorption of Heavy Metals: A Review,” Biotechnol. Bioprocess Eng., 6, 2001, pp. 376-381.
[8] Volesky, B., “Detoxification of Metal-bearing Effluents: Biosorption for the Next Century,” Hydrometallurgy, 59, 2001, pp. 203-216.
[9] Yu, Q., Kaewsarn, P., Yu, Q. and Kaewsarn, P., “A Model for pH Dependent Equilibrium of Heavy Metal Biosorption,” Korean J. Chem. Eng., 16, 1999, pp. 753-757.
[10] Veglio, F. and Beolchini, F., “Removal of Metals by Biosorption: A Review,”Hydrometallurgy, 44, 1997, pp. 301-316.
[11] Avery, S.V. and Tobin, J.M., “Mechanisms of Strontium Uptake by Laboratory and Brewing Strains of Saccharomyces cerevisiae,” Appl. Environ. Microbiol., 58, 1992, pp. 3883-3894 .
[12] Sudha, S. R. and Abraham, T. E., “Biosorption of Cr(VI) from Aqueous Solution by Rhizopus nigrican,” Bioresource Technology, 79, 2001, pp.73-81.
[14] J. M. Tobin and J. C. Roux, “Mucor biosorbent for chromium removal from tanning effluent”, Wat. Res., 32, 1998, pp. 1407-1416.
[15] R. Ashkenazy, L. Gottlieb and S. Yannai, “Characteristics of acetone-washed yeast biomass functional groups involved in lead biosorption”, Biotechnol. Bioeng., 55, 1997, PP. 1-10.
[16] E. Fourest and B. Volesky, “Contribution of sulfonate groups and alginate to heavy metal biosorption by the dry biomass of sargassum fluitans”, Environ. Sci. Technol., 30, 1996, pp. 277-282.
[17] E. Guibal, C. Roulph and P. L. Cloiree, Enfraed spectroscopic study of uranyl biosorption by fungal biomass and materials of biological origin, Environ. Sci. Technol., 29, 1996, pp. 2496-2503.
[18] S. A. Churchill, J. V. Walter and P. F. Churchill, Sorption of heavy metals by prepared bacterial cell surfaces, J. Environ. Eng., 1995, 706-711.
[19] I. Langmuir, The sorption of gases on plane surfaces of glass, mica and platinum, J. Am. Chem. Soc. 40, 1918, 1361-1403.
[20] H. Freundlich, “Uber die adsorption in loseungen”, J. Phys. Chem. 57, 1907, pp. 385-470.
[21] D. M. Misic, Y. Sudo, M. Suzuki, and K. Kawazeo, "Liqiid to Particle Mass Transfer in a Stirred Batch Adsorptiom Tank with Nonlinear Isotherm", J. Chem, Eng. Japan., 15, 1982, pp. 490-497.
[22] Y. H. Ma, and T. Y. Lee, “Transient Diffusion in Solids with a Bipore Distribution”, AICHE. J, 22, 1976, pp. 147-152.