Original Article
Osteoporosis screening based on body mass
index, years since menopause and age among
postmenopausal women in South Central China
Dandan Xie1,2,3,4, Yinghui Zhou1,2,3, Yan Zhang1,2,3, Shanjiang Fu1,2,3, Sang Fu1,2,3, Xiyu Wu1,2,3, Yulin Ma5,
Zhifeng Sheng1,2,3
1Department of Metabolism & Endocrinology, The 2nd Xiangya Hospital, Central South University, Changsha 410011, Hunan, China; 2National Clinical Research Center for Metabolic Diseases, The 2nd Xiangya Hospital, Central South University, Changsha 410011, Hunan, China; 3Institute of Metabolism and Endocrinology of Central South University, The 2nd Xiangya Hospital, Central South University, Changsha 410011, Hunan, China; 4Department of Clinical Nutrition, The First Affiliated Hospital of Hainan Medical College, Haikou 570102, Hainan, China; 5Department of Endocrinology, The Affiliated Xiaolan Hospital of Southern Medical University, Zhongshan 528415, China
Received June 8, 2017; Accepted December 5, 2017; Epub March 15, 2018; Published March 30, 2018
Abstract: We aimed to screen for high risk factors for osteoporosis and provide appropriate criteria for bone mineral testing for osteoporosis screening in healthy postmenopausal women. This cross-sectional study surveyed 782 healthy postmenopausal women aged 50-77 years from South Central China by using a questionnaire. Bone min-eral density was measured by dual X-ray absorptiometry. Subjects were divided into two groups according to their T-scores: osteoporosis group and non-osteoporosis group. The χ2 test was used to compare categorical variables
between the two groups, while logistic regression models were used to identify osteoporosis-related risk factors. Receiver operating characteristic (ROC) curve analysis was applied to evaluate the prognostic performance of age, years since menopause, and body mass index (BMI) in predicting osteoporosis in postmenopausal women in China. We found that age, years since menopause, BMI, history of fragility fractures, and fall history significantly differed
between the two groups (P < 0.05). However, only BMI (β = -0.479), years since menopause (β = 0.318), and age (β = 0.298) were significantly correlated with osteoporosis after logistic regression analysis (P < 0.05). The optimal cutoffs for BMI, years since menopause, and age were 22.81 kg/m2 (area under the ROC curve [AUC]: 0.624; 95%
CI: 0.584-0.664), 10.05 years (AUC: 0.658; 95% CI: 0.619-0.697), and 62.45 years (AUC: 0.644; 95% CI: 0.604-0.684), respectively. The present study demonstrates that older age, longer menopause duration, lower BMI, history of fragility fractures, and fall history are risk factors for osteoporosis. Bone mineral density testing for osteoporosis screening is indicated in healthy postmenopausal women from South Central China who are aged > 62 years, went through menopause > 10 years ago, or have a BMI of < 23 kg/m2.
Keywords: Osteoporosis, postmenopausal, screening, risk factors, cutoff point
Introduction
Osteoporosis is a systemic metabolic skeletal disease characterized by low bone mineral den-sity (BMD), increased bone fragility and a high-er incidence of fractures [1]. The prevalence rate of osteoporosis increases with age, and thus, the aging of the population makes osteo-porosis a major public health problem world-wide [2]. Postmenopausal osteoporosis (PMOP) commonly occurs within 5-10 years of meno-pause, and is increasingly becoming an impor-tant health care challenge in women [3]. The
fracture risk associated with osteoporosis severely affects the quality of life and even mor-tality of old people, especially, women [4]. Therefore, the early recognition and manage-ment of those at a high risk for osteoporosis will be greatly beneficial for individuals and the society.
internation-ally recognized gold standard for the diagnosis of osteoporosis [5]. According to the diagnostic criteria recommended by the World Health Organization (WHO), osteoporosis is defined as a BMD value ≥2.5 standard deviations (SD) below the normal peak bone mass (PBM) for adults of the same gender and race (T-score ≤-2.5) [6]. Several studies have indicated that factors such as age, years since menopause, body mass index (BMI) and a history of fragility fracture are independent contributors to oste-oporotic fracture risk and improve the sensitiv-ity of BMD measurement for the identification of high-risk populations [7-9]. However, few studies have focused on the relationship be- tween clinical risk factors and osteoporosis risk in Chinese postmenopausal women. Therefore, in an attempt to determine the risk factors associated with PMOP among Chinese women, we examined 782 healthy postmenopausal women by means of BMD measurements and questionnaires in South Central China. The aim of the present cross-sectional study is to pro-vide a research basis for the selection of the primary method for osteoporosis screening among postmenopausal women in China. Material and methods
Subjects
The study population comprised 782 healthy postmenopausal women from South Central China aged 50-77 years. The study subjects were recruited from community centres. Meno- pause was defined clinically as the absence of menstrual cycles for at least 1 year. All of the subjects were non-institutionalized women in
spondylitis, malabsorption syndromes, malig-nant tumours, haematological diseases.Wom- en taking oral anticoagulants were also exclud-ed, but those taking drugs for hypertension or coronary diseases were not excluded [11]. All participants provided informed consent. The study was approved by the ethics committee of the Second Xiangya Hospital of the Central South University (Changsha, China).
Methods
[image:2.612.93.337.98.244.2]Body weight and height were measured in all subjects, without shoes and in light indoor clothing, to the closest 0.1 kg and 0.1 cm, respectively. BMI was calculated as the weight in kilograms divided by the square of the height in metres [1]. Total body BMD, lumbar1-4 spine BMD and left femoral BMD were measured using a DXA fan-beam bone densitometer (Lunar Prodigy Advance, GE Healthcare, Madi- son, WI, USA). According to the information pro-vided by the manufacturer, this is a standard-ized commercial machine which provides total, anterior-posterior spinal and femoral BMD measurements that are precise to 1%. The con-trol spine phantom scan performed each day demonstrated long-term (> 2 years) coefficients of variation of < 0.7% [12]. Osteoporosis was defined according to the WHO definition and the BMD reference databases established by our group [10]. All participants were interviewed using a standard questionnaire to obtain clini-cal data, such as history of fractures, use of calcium and family history of osteoporosis [1, 10].
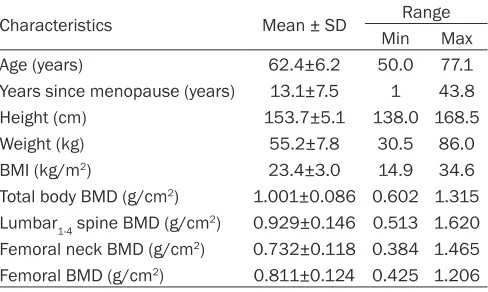
Table 1. Densitometric, anthropometric and clinical data of the 782 women studied
Characteristics Mean ± SD Range
Min Max
Age (years) 62.4±6.2 50.0 77.1
Years since menopause (years) 13.1±7.5 1 43.8
Height (cm) 153.7±5.1 138.0 168.5
Weight (kg) 55.2±7.8 30.5 86.0
BMI (kg/m2) 23.4±3.0 14.9 34.6
Total body BMD (g/cm2) 1.001±0.086 0.602 1.315
Lumbar1-4 spine BMD (g/cm2) 0.929±0.146 0.513 1.620
Femoral neck BMD (g/cm2) 0.732±0.118 0.384 1.465
Femoral BMD (g/cm2) 0.811±0.124 0.425 1.206
BMI, body mass index; BMD, bone mineral density.
Statistical analysis
All statistical analyses were performed using SPSS for Windows (SPSS version 20.0; Chicago,
IL, USA). All variables were distributed normally and met the criteria for normality for basic sta-tistical analyses and for inspection of histo-grams and normality plots. Data were present-Table 2. Hierarchical assignment of risk factors for osteoporosis
Risk factor for osteoporosis Hierarchical assignment
Age (years) ≤4.99 = 1 55~59.99 = 2 60~64.99 = 3 65~69.99 = 4 ≥70 = 5
Years since menopause (years) ≤4.99 = 1 5~9.99 = 2 ≥10.00 = 3
BMI (kg/m2) ≤18.99 = 1 19~20.99 = 2 21~24.99 = 3 25~27.99 = 4 ≥28 = 5
History of fragility fractures No = 0 Fall fracture = 1 Violent fracture = 2
Fall history No = 0 Yes = 1
Calcium supplementation No = 0 Yes = 1
Vitamin D supplementation No = 0 Yes = 1
Outdoor activity time (min/d) < 30 = 1 30~60 = 2 > 60 = 3
More than 1 year of amenorrhea before 40 years old No = 0 Yes = 1
Family history of osteoporosis No = 0 Yes = 1
[image:3.612.90.526.84.219.2]BMI, body mass index.
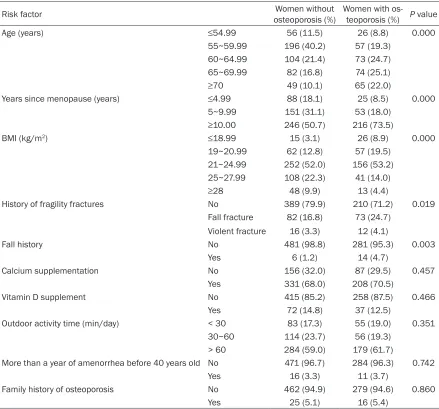
Table 3. Comparison of risk factors between women with and without osteoporosis
Risk factor osteoporosis (%)Women without Women with os-teoporosis (%) P value
Age (years) ≤54.99 56 (11.5) 26 (8.8) 0.000
55~59.99 196 (40.2) 57 (19.3)
60~64.99 104 (21.4) 73 (24.7)
65~69.99 82 (16.8) 74 (25.1)
≥70 49 (10.1) 65 (22.0)
Years since menopause (years) ≤4.99 88 (18.1) 25 (8.5) 0.000
5~9.99 151 (31.1) 53 (18.0)
≥10.00 246 (50.7) 216 (73.5)
BMI (kg/m2) ≤18.99 15 (3.1) 26 (8.9) 0.000
19~20.99 62 (12.8) 57 (19.5)
21~24.99 252 (52.0) 156 (53.2)
25~27.99 108 (22.3) 41 (14.0)
≥28 48 (9.9) 13 (4.4)
History of fragility fractures No 389 (79.9) 210 (71.2) 0.019
Fall fracture 82 (16.8) 73 (24.7)
Violent fracture 16 (3.3) 12 (4.1)
Fall history No 481 (98.8) 281 (95.3) 0.003
Yes 6 (1.2) 14 (4.7)
Calcium supplementation No 156 (32.0) 87 (29.5) 0.457
Yes 331 (68.0) 208 (70.5)
Vitamin D supplement No 415 (85.2) 258 (87.5) 0.466
Yes 72 (14.8) 37 (12.5)
Outdoor activity time (min/day) < 30 83 (17.3) 55 (19.0) 0.351
30~60 114 (23.7) 56 (19.3)
> 60 284 (59.0) 179 (61.7)
More than a year of amenorrhea before 40 years old No 471 (96.7) 284 (96.3) 0.742
Yes 16 (3.3) 11 (3.7)
Family history of osteoporosis No 462 (94.9) 279 (94.6) 0.860
[image:3.612.88.527.257.666.2]ed as mean ± standard deviation. According to the WHO definition and the BMD reference databases established by our group [11], post-menopausal women with T-scores of ≤2.5 SD on BMD were determined to have osteoporosis. These scores were used to divide the subjects into two groups: the osteoporosis group and the non-osteoporosis group. The χ2 test was
used to compare categorical variables between the two groups. Binary logistic regression anal-ysis was used to determine the association of osteoporosis with age, years since menopause, BMI, history of fragility fractures, fall history, calcium supplementation, vitamin D supple-mentation, outdoor activity time, more than 1 year of amenorrhea before age 40 years and family history of osteoporosis. The inclusion and exclusion criteria were P < 0.10 and P > 0.15, respectively. Significant variables were entered into the regression equation. ROC curve analysis was performed to evaluate the prognostic performance of the significant vari -ables such as age, years since menopause, and BMI in osteoporosis [13]. All significance levels were set at P < 0.05.
Results
The basic clinical data of the 782 women stud-ied are shown in Table 1. The average age of the participants was 62.4±6.2 years (range, 50-77 years). On average, the participants had reached menopause 13.1±7.5 years ago (range, 1-43.8 years). Their BMI was 23.4±3.0 kg/m2 (range, 14.9-34.6 kg/m2).
The hierarchical assignment of the experimen-tal variables (risk factors for osteoporosis) is shown in Table 2. The comparison of the risk factors between women with and without oste-oporosis is presented in Table 3. The incidence
cium supplementation, vitamin D supplementa-tion, outdoor activity time, more than a year of amenorrhea before the age of 40 years and family history of osteoporosis.
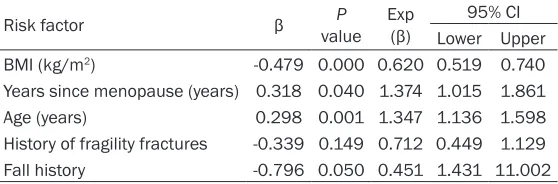
The results of binary logistic regression analy-sis of the risk factors for osteoporoanaly-sis are pre-sented in Table 4. The results showed that BMI, years since menopause, age, history of fragility fractures and fall history entered the regres-sion equation. However, only BMI, years since menopause and age were significantly corre -lated with the occurrence of osteoporosis (P < 0.05).
We plotted the ROC curves of BMI, years since menopause and age for predicting osteoporo-sis risk (Figure 1A-C). The AUCs of BMI, years since menopause and age were 0.624 (95% CI: 0.584-0.664, P < 0.001, sensitivity = 0.585, specificity = 0.606), 0.658 (95% CI: 0.619-0.697, P < 0.001, sensitivity = 0.755, specificity = 0.478) and 0.644 (95% CI: 0.604-0.684, P < 0.001, sensitivity = 0.593, specificity = 0.655), respectively. The optimal cutoff points for these parameters were 22.81 kg/m2, 10.05 years
and 62.45 years, respectively. Discussion
Osteoporosis is considered a silent disease, and fragility fractures are a serious conse-quence of this condition. Early detection is the only available means of preventing osteoporo-sis. The purpose of our study is to screen high-risk populations for osteoporosis, and thereby, enable the early diagnosis of PMOP and reduce the occurrence of osteoporosis fractures. The main clinical manifestation of osteoporosis is low BMD, which is a dynamic parameter. Bone loss occurs with increase in age, and is espe-Table 4. Binary logistic regression analysis evaluating risk factors
for osteoporosis
Risk factor β valueP Exp (β) 95% CI
Lower Upper
BMI (kg/m2) -0.479 0.000 0.620 0.519 0.740
Years since menopause (years) 0.318 0.040 1.374 1.015 1.861
Age (years) 0.298 0.001 1.347 1.136 1.598
History of fragility fractures -0.339 0.149 0.712 0.449 1.129
Fall history -0.796 0.050 0.451 1.431 11.002
Continuous variables: BMI, Years since menopause and age; Categorical variable: History of fragility fractures and Fall history. BMI: body mass index.
[image:4.612.91.370.98.190.2]cal-cially prevalent in elderly women [14, 15]. It has been estimated that 30%-40% of the PBM is lost over a woman’s lifespan [16], and the annual rate of BMD decrease can be up to 3%-5% in the early stage of PMOP [11]. Some researchers have showed that the rate of this bone loss, which significantly increases the risk of osteoporosis and fractures, can be as high as 5%-10% of the total bone mass/decade [17]. Consistent with this, our study showed that age was directly proportional to the occur-rence of osteoporosis. In addition to age, years since menopause, a history of fragility fracture and fall history were positively correlated with osteoporosis in postmenopausal women, whereas BMI was negatively correlated with osteoporosis. These results are basically con-sistent with previous findings [18-20].
Our study also showed that there was no sig- nificant difference between postmenopausal women with and without osteoporosis with regard to calcium supplementation and family history of osteoporosis. However, many studies have indicated that calcium supplementation can increase BMD or reduce bone loss and reduce the incidence of osteoporosis [21-23]. This difference might be attributable to the fact that our questionnaire did not distinguish between calcium preparations or specify the dosage of calcium. According to the National Osteoporosis Foundation (NOF), the recom-mended daily intake of calcium for women aged 50 years and above is 1200 mg; this dos-age is expected to maximize PBM and minimize the risk of osteoporosis in adulthood [24-26]. The calcium intake in most Asian countries falls far below this recommendation. One
sur-vey has revealed that average dietary calcium intake in Asian adults is approximately 450 mg/day [27].
The incidence of osteoporosis is related to many factors, including genetic factors. Twin studies have shown that hereditary variation accounts for 60%-80% of BMD [28-30]. A major determinant of osteoporosis is BMD, which has a heritability of 0.6%-0.85% [31]. Osteoporosis is an age-related disease. The subjects in most research studies on osteoporosis tended to be elderly people; therefore, it was difficult to clar -ify whether their parents had osteoporosis or not [32]. Thus far, relatively few studies have reported on a family history of osteoporosis [33]. In the present study, most of the subjects were not sure if their parents had been diag-nosed with osteoporosis. This may be due to a lack of awareness of osteoporosis among the elderly in China.
[image:5.612.92.520.71.218.2]based on the results of research on non-Chi-nese populations, and have their own limita-tions [35-38]. The effects of these tools in clini-cal practice in China is worthy of research. In our study, we used ROC curve analysis to assess three risk factors for osteoporosis: BMI, years since menopause and age. The analyses indicated that the optimal diagnostic cutoff points for these three factors were 23 kg/m2,
10 years and 62 years, respectively.
Few studies have examined the association between clinical risk factors and the risk of PMOP in China. To our knowledge, our study is the first such study conducted in South Central China, and it serves to screen high-risk populations (Chinese postmenopausal women) for osteoporosis through BMI, years since men-opause and age. Some guidelines, such as those of the NOF, US Preventive Services Task Force, American Association of Clinical Endocrinologists and American College of Preventive Medicine, recommend that women aged 65 years and older should be screened for osteoporosis [24, 39-41]. However, there is plenty of evidence that suggests that genetic factors, including racial differences, influence variations in bone mass and the occurrence of osteoporosis [28, 29, 31]. In our study, the opti-mal cutoff age for predicting the risk of osteo-porosis was 62 years. Johnell et al. have report-ed that a BMI < 25 kg/m2 predicts the risk of
osteoporotic fracture [42]. In our study, the optimal BMI cutoff was 23 kg/m2, with an
accu-racy of prediction of PMOP of 60.9%. Many studies have confirmed that the duration of menopause is an important factor related to bone loss and osteoporosis [43, 44], but none have provided a specific threshold. We deter -mined that the menopause duration threshold was 10 years, with a sensitivity of 75.5% and a specificity of 47.8% in predicting osteoporosis. The above conclusions show that guidelines based on studies of European and American populations may not be applicable to the Chinese population. Further studies based on a large sample of the Chinese population are warranted to develop screening criteria for osteoporosis among high-risk populations in China.
This study has some limitations. First, our data-base was built using a sample from an urban population, and it might be inappropriate to extrapolate the results to rural populations.
Second, the information in the questionnaire survey, for example, age at menopause and family history of osteoporosis, was provided by the respondents via recall, and their answers could not be verified. Finally, our subjects were relatively healthy postmenopausal women, and none of them had a history of smoking, alcohol or caffeine consumption, treatment with gluco-corticoid drugs, etc. Women with any one of these factors are likely to have a higher risk of osteoporosis, and may require screening for osteoporosis at an earlier age. Therefore, fur-ther large-scale studies are needed in similar populations.
In conclusion, we found that older age, longer menopause duration, lower BMI, history of fra-gility fractures and fall history are risk factors for osteoporosis. Bone mineral testing is indi-cated in postmenopausal women in South Central China who are aged > 62 years, have gone through menopause > 10 years ago or have a BMI of < 23 kg/m2. Further studies may
be needed in larger populations and other urban or rural groups to confirm that the results of the present study are generally applicable. Acknowledgements
This work was supported by grants from the National Nature Science Foundation of China [grant numbers 81000361, 81471091], the Chinese Postdoctoral Foundation [grant num-bers 20090461010, 201003512], the Science Foundation of Central Higher School Found- ation of China [grant number 20101220044], and the Science and Technology Project of Guangdong Province, China [grant number 2013B021800111].
Address correspondence to: Zhifeng Sheng, De- partment of Metabolism & Endocrinology, The 2nd Xiangya Hospital, Central South University, Renmin Road 139#, Changsha 410011, Hunan, China. Tel: +86-0731-85295245; Fax: +86-0731-85369412; E-mail: shengzhifeng@csu.edu.cn
References
[2] Mazziotti G, Bilezikian J, Canalis E, Cocchi D and Giustina A. New understanding and treat-ments for osteoporosis. Endocrine 2012; 41: 58-69.
[3] Pinheiro MM, Reis Neto ET, Machado FS, Omura F, Yang JH, Szejnfeld J and Szejnfeld VL. Risk factors for osteoporotic fractures and low bone density in pre and postmenopausal wom-en. Rev Saude Publica 2010; 44: 479-485. [4] Bliuc D, Nguyen ND, Milch VE, Nguyen TV,
Eisman JA and Center JR. Mortality risk associ-ated with low-trauma osteoporotic fracture and subsequent fracture in men and women. Jama 2009; 301: 513-521.
[5] Santos L, Romeu JC, Canhao H, Fonseca JE and Fernandes PR. A quantitative comparison of a bone remodeling model with dual-energy X-ray absorptiometry and analysis of the inter-individual biological variability of femoral neck T-score. J Biomech 2010; 43: 3150-3155. [6] NIH consensus development panel on
osteo-porosis prevention, diagnosis, and therapy. os-teoporosis prevention, diagnosis, and therapy. JAMA 2001; 285: 785-795.
[7] Kanis JA. Diagnosis of osteoporosis and as-sessment of fracture risk. Lancet 2002; 359: 1929-1936.
[8] Kanis JA, Oden A, Johnell O, Johansson H, De Laet C, Brown J, Burckhardt P, Cooper C, Christiansen C, Cummings S, Eisman JA, Fujiwara S, Gluer C, Goltzman D, Hans D, Krieg MA, La Croix A, McCloskey E, Mellstrom D, Melton LJ 3rd, Pols H, Reeve J, Sanders K, Schott AM, Silman A, Torgerson D, van Staa T, Watts NB and Yoshimura N. The use of clinical risk factors enhances the performance of BMD in the prediction of hip and osteoporotic frac-tures in men and women. Osteoporos Int 2007; 18: 1033-1046.
[9] Filner JJ, Krohn KD, Lapidus JA and Becker TM. Risk factors for osteoporosis in Alaska native women: a cross-sectional survey. Alaska Med 2002; 44: 8-13, 21.
[10] Zhang Z, Shen X, Zhang H, Li S, Zhou H, Wu X, Sheng Z and Liao E. The relationship between body composition and fracture risk using the FRAX model in central south Chinese post-menopausal women. Clin Endocrinol (Oxf) 2012; 77: 524-530.
[11] Zhang H, Chai X, Li S, Zhang Z, Yuan L, Xie H, Zhou H, Wu X, Sheng Z and Liao E. Age-related changes in body composition and their rela-tionship with bone mineral density decreasing rates in central south Chinese postmenopaus-al women. Endocrine 2013; 43: 643-650. [12] Blain H, Rolland Y, Beauchet O, Annweiler C,
Benhamou CL, Benetos A, Berrut G, Audran M, Bendavid S, Bousson V, Briot K, Brazier M, Breuil V, Chapuis L, Chapurlat R, Cohen-Solal
M, Cortet B, Dargent P, Fardellone P, Feron JM, Gauvain JB, Guggenbuhl P, Hanon O, Laroche M, Kolta S, Lespessailles E, Letombe B, Mallet E, Marcelli C, Orcel P, Puisieux F, Seret P, Souberbielle JC, Sutter B, Tremollieres F, Weryha G, Roux C and Thomas T. Usefulness of bone density measurement in fallers. Joint Bone Spine 2014; 81: 403-408.
[13] Chang SF and Yang RS. Determining the cut-off point of osteoporosis based on the osteoporo-sis self-assessment tool, body mass index and weight in Taiwanese young adult women. J Clin Nurs 2014; 23: 2628-2635.
[14] Nguyen ND, Center JR, Eisman JA and Nguyen
TV. Bone loss, weight loss, and weight fluctua -tion predict mortality risk in elderly men and women. J Bone Miner Res 2007; 22: 1147-1154.
[15] Gouveia E, Blimkie CJ, Maia JA, Lopes C, Gouveia BR and Freitas DL. Multivariate analy-sis of lifestyle, constitutive and body
composi-tion factors influencing bone health in commu -nity-dwelling older adults from Madeira, Portugal. Arch Gerontol Geriatr 2014; 59: 83-90.
[16] Consensus development conference: diagno-sis, prophylaxis, and treatment of osteoporo-sis. Am J Med 1993; 94: 646-650.
[17] Anderson JJ, Roggenkamp KJ and Suchindran CM. Calcium intakes and femoral and lumbar bone density of elderly U.S. men and women: National Health and Nutrition Examination Survey 2005-2006 analysis. J Clin Endocrinol Metab 2012; 97: 4531-4539.
[18] Sheng ZZY and You L. Risk factors for osteopo-rosis in postmenopausal Shanghai women. Bone 2009; 44: S410.
[19] Scholtissen S, Guillemin F, Bruyere O, Collette J, Dousset B, Kemmer C, Culot S, Cremer D, Dejardin H, Hubermont G, Lefebvre D, Pascal-Vigneron V, Weryha G and Reginster JY. Assessment of determinants for osteoporosis in elderly men. Osteoporos Int 2009; 20: 1157-1166.
[20] Papaioannou A, Morin S, Cheung AM, Atkinson S, Brown JP, Feldman S, Hanley DA, Hodsman A, Jamal SA, Kaiser SM, Kvern B, Siminoski K
and Leslie WD; Scientific Advisory Council of
Osteoporosis Canada. 2010 clinical practice guidelines for the diagnosis and management of osteoporosis in Canada: summary. CMAJ 2010; 182: 1864-1873.
[21] Zhu K and Prince RL. Calcium and bone. Clin Biochem 2012; 45: 936-942.
[22] Cleghorn DB, O’Loughlin PD, Schroeder BJ and Nordin BE. An open, crossover trial of
[23] Lau EM, Woo J, Lam V and Hong A. Milk supple-mentation of the diet of postmenopausal Chinese women on a low calcium intake re-tards bone loss. J Bone Miner Res 2001; 16: 1704-1709.
[24] Cosman F, de Beur SJ, LeBoff MS, Lewiecki EM, Tanner B, Randall S and Lindsay R. Clinician’s guide to prevention and treatment of osteoporosis. Osteoporos Int 2014; 25: 2359-2381.
[25] Sandler RB, Slemenda CW, LaPorte RE, Cauley JA, Schramm MM, Barresi ML and Kriska AM. Postmenopausal bone density and milk con-sumption in childhood and adolescence. Am J Clin Nutr 1985; 42: 270-274.
[26] Compston J. The use of combination therapy in the treatment of postmenopausal osteoporo-sis. Endocrine 2012; 41: 11-18.
[27] Mithal A, Bansal B, Kyer CS and Ebeling P. The
Asia-Pacific regional audit-epidemiology, costs,
and burden of osteoporosis in India 2013: a report of international osteoporosis founda-tion. Indian J Endocrinol Metab 2014; 18: 449-454.
[28] Harris M, Nguyen TV, Howard GM, Kelly PJ and Eisman JA. Genetic and environmental correla-tions between bone formation and bone min-eral density: a twin study. Bone 1998; 22: 141-145.
[29] Seeman E, Hopper JL, Young NR, Formica C, Goss P and Tsalamandris C. Do genetic factors explain associations between muscle strength, lean mass, and bone density? A twin study. Am J Physiol 1996; 270: E320-327.
[30] Feng Y, Hsu YH, Terwedow H, Chen C, Xu X, Niu T, Zang T, Wu D, Tang G, Li Z, Hong X, Wang B, Brain JD, Cummings SR, Rosen C, Bouxsein ML and Xu X. Familial aggregation of bone mineral density and bone mineral content in a Chinese population. Osteoporos Int 2005; 16: 1917-1923.
[31] Ng MY, Sham PC, Paterson AD, Chan V and Kung AW. Effect of environmental factors and gender on the heritability of bone mineral den-sity and bone size. Ann Hum Genet 2006; 70: 428-438.
[32] Liu YJ, Shen H, Xiao P, Xiong DH, Li LH, Recker RR and Deng HW. Molecular genetic studies of
gene identification for osteoporosis: a 2004
update. J Bone Miner Res 2006; 21: 1511-1535.
[33] Kanis JA, Burlet N, Cooper C, Delmas PD, Reginster JY, Borgstrom F and Rizzoli R. European guidance for the diagnosis and man-agement of osteoporosis in postmenopausal women. Osteoporos Int 2008; 19: 399-428. [34] Kutsal YG, Atalay A, Arslan S, Basaran A,
Canturk F, Cindas A, Eryavuz M, Irdesel J, Karadavut KI, Kirazli Y, Sindel D, Senel K, Guler-Uysal F and Yildirim K. Awareness of
os-teoporotic patients. Osteoporos Int 2005; 16: 128-133.
[35] Koh LK, Sedrine WB, Torralba TP, Kung A, Fujiwara S, Chan SP, Huang QR, Rajatanavin R, Tsai KS, Park HM and Reginster JY. A simple tool to identify asian women at increased risk of osteoporosis. Osteoporos Int 2001; 12: 699-705.
[36] Kanis JA, Hans D, Cooper C, Baim S, Bilezikian JP, Binkley N, Cauley JA, Compston JE, Dawson-Hughes B, El-Hajj Fuleihan G, Johansson H, Leslie WD, Lewiecki EM, Luckey M, Oden A, Papapoulos SE, Poiana C, Rizzoli R, Wahl DA and McCloskey EV. Interpretation and use of FRAX in clinical practice. Osteoporos Int 2011; 22: 2395-2411.
[37] Cook RB, Collins D, Tucker J and Zioupos P. Comparison of questionnaire and quantitative ultrasound techniques as screening tools for DXA. Osteoporos Int 2005; 16: 1565-1575. [38] Cooper C, Reginster JY, Cortet B, Diaz-Curiel M,
Lorenc RS, Kanis JA and Rizzoli R. Long-term treatment of osteoporosis in postmenopausal women: a review from the European society for clinical and economic aspects of osteoporosis and osteoarthritis (ESCEO) and the interna-tional osteoporosis foundation (IOF). Curr Med Res Opin 2012; 28: 475-491.
[39] U.S. Preventive Services Task Force. Screening for osteoporosis: U.S. preventive services task force recommendation statement. Ann Intern Med 2011; 154: 356-364.
[40] Lim LS, Hoeksema LJ and Sherin K. Screening for osteoporosis in the adult U.S. population: ACPM position statement on preventive prac-tice. Am J Prev Med 2009; 36: 366-375. [41] Watts NB, Bilezikian JP, Camacho PM, Green-
span SL, Harris ST, Hodgson SF, Kleerekoper M, Luckey MM, McClung MR, Pollack RP and Petak SM. American association of clinical en-docrinologists medical guidelines for clinical practice for the diagnosis and treatment of postmenopausal osteoporosis: executive sum-mary of recommendations. Endocr Pract 2010; 16: 1016-1019.
[42] Johnell O, Kanis JA, Oden A, Johansson H, De Laet C, Delmas P, Eisman JA, Fujiwara S, Kroger H, Mellstrom D, Meunier PJ, Melton LJ 3rd, O’Neill T, Pols H, Reeve J, Silman A and Tenenhouse A. Predictive value of BMD for hip and other fractures. J Bone Miner Res 2005; 20: 1185-1194.
[43] Demir B, Haberal A, Geyik P, Baskan B, Oztur-
koglu E, Karacay O and Deveci S. Identification
of the risk factors for osteoporosis among postmenopausal women. Maturitas 2008; 60: 253-256.