. . . .
. . . .
Mayer wave activity in vasodepressor carotid
sinus hypersensitivity
Ciara´n Finucane
1*
, Gerard Boyle
1, Chie Wei Fan
2, Dymphna Hade
3, Lisa Byrne
3,
and Rose Anne Kenny
41
Department of Medical Physics and Bioengineering, St James’s Hospital, Dublin 8, Ireland;2
Department of Medical Gerontology, Trinity College Dublin, Falls and Blackout Unit, St
James’s Hospital, Dublin 8, Ireland;3
Clinical Nurse Specialist, Falls and Blackout Unit, St James’s Hospital, Dublin 8, Ireland; and4
Department of Medical Gerontology, Trinity College, Dublin 2, Ireland
Received 10 June 2009; accepted after revision 9 November 2009
Aims Mayer waves are low frequency blood pressure waves, whose modulation involves central/peripheral baroreflex pathways. Although vasodepressor carotid sinus hypersensitivity (VDCSH) is a common hypotensive disorder in ageing, the mechanism of VDCSH is unknown. We hypothesize that VDCSH is due to impaired baroreflex function and that Mayer wave amplitude and oscillation frequency are therefore altered.
Methods and results
Ten minutes ECG and continuous beat-to-beat blood pressure (TNO Finapres
&
) recordings were taken in supine position. Blood pressure variance, spectral power (0.04 – 0.15 Hz) and centre of frequency was examined across a number of frequency bands. Vasodepressor carotid sinus hypersensitivity was defined as 50 mmHg drop in systolic blood pressure (SBP) during carotid sinus massage. Syncope facility was used in this study. Twelve patients with VDCSH median age 72 range (50 – 92) were compared with 36 case – controls median age 78 range (48 – 88). Dias-tolic blood pressure variability (median SD) was significantly higher in the VDCSH 6.6 (1.9 – 12.9) mmHg compared with controls 4.0 (1.7 – 9.5) mmHg;P,0.05. Mean arterial blood pressure (MAP) variability (median SD) was signifi-cantly higher in the VDCSH 6.6 (2.9 – 10.1) mmHg compared with controls 4.6 (2.5 – 9.1) mmHg;P,0.05. Low fre-quency Mayer wave activity in MAP in VDCSH compared with controls was increased at 0.06 Hz [controls 221.7 mmHg2/Hz (IQR: 30.8); VDCSH 231.5 mmHg2/Hz (IQR: 72.0) P,0.05] and at 0.1 Hz [controls 24.9 mmHg2/Hz (IQR: 9.4); VDCSH211.5 mmHg2/Hz (IQR: 12.9)P,0.1]. High frequency blood pressure fluctu-ations were significantly increased at 0.3 Hz in VDCSH group in SBP [controls24.1 mmHg2/Hz (IQR: 10.4); VDCSH 217.4 mmHg2/Hz (IQR: 47.9) P,0.05] and MAP records [controls 232.5 mmHg2/Hz (IQR: 76.9); VDCSH 264.6 mmHg2/Hz (IQR: 59.8)P,0.01].Conclusion Blood pressure variability in particular activity at Mayer wave frequencies was higher in VDCSH. Future work will investigate this approach as a basis for diagnosis of VDCSH, with implications for syncope and falls management.
-Keywords Mayer waves † Vasodepressor carotid sinus hypersensitivity † Syncope † Falls management † Blood pressure variability
Introduction
Carotid sinus hypersensitivity (CSH) is an age-related autonomic disorder1 – 3 characterized by exaggerated cardiac slowing (CICSH, cardioinhibitory carotid sinus hypersensitivity) and/or profound drops in blood pressure (VDCSH, vasodepressor carotid sinus hypersensitivity) following unilateral carotid sinus massage (CSM).4 – 5 First described by Roskam,6 CSH is now a
well-established modifiable risk factor for syncope and falls in the elderly,7responsible for symptoms in up to 30% of older patients.8 Cardiac pacing reduces symptoms in those with CICSH;9however in VDCSH, a successful treatment option remains elusive, which is further exacerbated by an incomplete understanding of its pathophysiology.
On the basis of experimental evidence, it has been postulated that CSH occurs secondary to up-regulation ofa2 adrenoreceptor
*Corresponding author. Tel:þ353 1 416 2375, Fax:þ353 1 410 3454, Email: [email protected]
induced deafferentation of the baroreflex resulting from atherosclerosis and a reduction in carotid sinus compliance.10 Neuropathological evidence reports a small but significant increase in neurodegenerative hyperphosphorylated Tau proteins in brainstem nuclei that regulate cardiovascular activity.11 Polvikoski
et al.12found markeda-synuclein pathology in the stellate ganglia of an elderly lady with CICSH. Growing evidence thus suggests that CSH affects the baroreflex arc in central areas; however, the manner in which this dysfunction leads to a hypersensitive response remains obscure.
In an attempt to further understand the mechanisms contribut-ing to VDCSH, we examine Mayer wave activity as a non-invasive marker reflective of the state of the blood pressure regulation system. Mayer waves are low frequency (slower than respiration) arterial pressure oscillations, which exhibit a significant coherence with oscillations of sympathetic nerve activity.13They are believed to result from oscillations induced in sympathetic nerve activation of peripheral resistance vessels. Mayer waves are strongly attenu-ated after acute a-adrenoceptor blockade14,15 and sino-aortic baroreceptor denervation.16,17 These oscillations are variable in amplitude but have relatively stable intra-species frequency. In humans, this frequency is age, gender, and posture independent, centred typically0.1 Hz.18
A number of authors have suggested that measurement of these oscillations may be used as a non-invasive tool for investigating underlying alterations in peripheral resistance regulatory mechan-isms.19 – 21Studies, which simulate Mayer wave generation,19,22,23 predict that Mayer wave amplitude increases with the gain and range of the baroreflex. Oscillation frequency decreases as affer-ent, efferaffer-ent, and vascular response delays increase. This associ-ation between Mayer wave activity and baroreflex physiology provides an opportunity to study differences in baroreflex function in health and disease using non-invasive methods. Furthermore, the direction of Mayer activity alterations may provide insight into the manner in which the baroreflex gain and/or range is affected.
As the generation and modulation of Mayer waves involve central baroreflex pathways common to those implicated in the pathogenesis of VDCSH, we hypothesize that Mayer wave activity is altered in VDCSH. The purpose of this study was to compare Mayer wave amplitude and Mayer wave frequency in VDCSH and case – controls.
Methods
Participants
Participants were recruited prospectively from a dedicated Falls and Blackout facility in a large teaching hospital. All subjects attended for a single visit between 09.00 and 13.00 h in a temperature (238C), com-fortably lit, low-noise environment.24Consecutive patients (aged more
than 50) with a history of recurrent syncope or unexplained falls in the previous year were recruited. All patients had full clinical assessment including CSM as part of routine cardiovascular assessment. The study had ethical approval from the local Ethics Committee.
Carotid sinus massage
Prior to CSM all subjects underwent a 10 min baseline surface electrocardiogram (ECG) and continuous beat-to-beat blood pressure
(TNO Finapres
&
) recording. Subjects were instructed to lie supineand directed to breathe normally while measurements were taken. Following an initial 5 min cardiovascular stabilization period Physiocal
&
was switched off, and data were recorded for a further 5 min. Signals were sampled at 200 Hz, filtered between 0.01 – 100 Hz, and stored digitally on a PC for further analysis. This allowed standard baseline cardiovascular variables including heart rate (HR), systolic blood pressure (SBP), diastolic blood pressure (DBP), and mean arter-ial blood pressure (MAP) to be recorded. Mayer activity was derived from last 5 min of this rest period.
Following this CSM was performed. Firm longitudinal massage was applied for 5 s at the point of maximal pulsation over the carotid (usually located at the level of the upper border of the cricoid carti-lage) on the right and then left sides allowing a 30 s interval between stimuli. Carotid sinus massage was performed in both supine and upright positions (head-up tilt to 708foot plate assisted table).5Thus participants underwent a maximum of four episodes of CSM.
Definition of carotid sinus hypersensitivity
Vasodepressor carotid sinus hypersensitivity was defined as a drop of 50 mmHg or more in SBP and ,3 s of asystole. Cardioinhibitory carotid sinus hypersensitivity was defined as asystole of 3 s or more asystole and ,50 mmHg SBP vasodepressor response; mixed CSH was a combination of CCSH and VCSH.
Data analysis
All initial data processing was performed with custom written analysis software using MATLAB 6.5
&
(Mathworks, Inc., Natick, MA, USA).Subject data were separated into four groups according to their cardi-ovascular response to CSM: (i) Controls (no CSH), (ii) CICSH, (iii) VDCSH, and (iv) Mixed. Only those individuals with Normal or VDCSH responses to CSM were considered for further analysis. Data records were scored for significant noise and artefact, and excluded if noise was above an empirically derived threshold. The ECG data were screened for abnormal rhythms, and the presence of ectopic beats (data were excluded if the number of ectopics .5% total number of beats). Data records of DBP, SBP, MAP, and R – R interval were linearly detrended prior to subsequent spectral analysis. To derive interval frequency spectra, 5-min R – R interval, SBP, DBP, and MAP recordings were analysed according to the technique described by DeBoeret al.25To account for differences in intervals on the frequency axis (arising from inter-individual differences in mean pulse interval), cubic spline interpolation was applied to resam-ple spectra from 0 to 0.5 Hz in steps of 0.0025 Hz. Standard time domain indices of cardiovascular variability were extracted from BP and R – R series including standard deviation and interquartile range. Frequency domain variables were calculated by integration of spectral estimates within a number of standard pre-defined frequency bands.24 Standard blood pressure variability frequency bands VLF (0.003 – 0.04 Hz), LF (Mayer wave band 0.04 – 0.15 Hz), HF (Traube – Herring band 0.15 – 0.4 Hz) were examined for differences between VDCSH and controls. A number of sub-bands were further examined in the LF band including LF1(0.04 – 0.07 Hz), LF2(0.08 – 0.1 Hz), LF3(0.1 –
0.012 Hz). This selection was achieved via statistical procedure whereby independent t-tests were applied to group ensemble aver-aged spectra to identify those bands, which differentiate controls and VDCSH groups. The peak power spectral density (Pi) and frequency at which this peak (fpi) occurs were found, within bands VLF, LF1,
Statistical analysis
SPSS
&
version 14 (SPSS Inc., Chicago, IL, USA) was used to processstudy data. All features derived in the previous sections were assessed for normality using data histograms, Normal Q – Q, detrended Normal Q – Q plots, and calculating distribution skewness, kurtosis, and Kol-mogorov – Smirnov test statistics. Initial group age matching was assessed using Krushkall – Wallis non-parametric testing; height and weight were compared by one-way analysis of variance. Normally dis-tributed variables were compared using Students t-tests. Non-parametric two-tailed Mann – WhitneyU test was used to compare non-parametric data. Significance was calculated at a level ofP,0.05.
Results
Subjects
Eighty-one patients (44 males and 37 females) were recruited. The median age of subjects was 75 (48 – 92) years, mean height 165.55+10.27 cm, and mean weight 73.46+14.26 kg.
Carotid sinus massage response
Thirty-six (17 males and 19 females) individuals had normal CSM responses; 15 individuals displayed VDCSH (9 males and 6 females); 25 subjects had CICSH (14 males and 11 females); while five had a mixed response (four males and one females). Only data from controls and VDCSH groups were considered for further analysis. A further eight data sets (five control; three VDCSH) were excluded because of artefact and ectopic beats. Data from 31 case – controls and 12 VDCSH subjects were com-pared. Resting SBP, DBP, HR, and peak frequency were normally distributed; pulse intervals, RR interval, time domain measures of SBP, MAP, DBP, HR, RR variability, and centre of frequency had non-normal distributions. Age, height, weight, and baseline cardio-vascular variables were similar between groups (Table 1). Systolic blood pressure nadir and degree of vasodepressor response fol-lowing CSM were more marked in VDCSH group (Table 1).
Time domain analysis of cardiovascular
variability
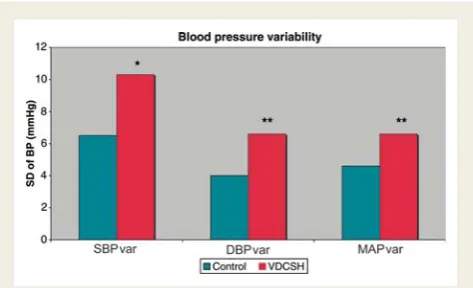
Diastolic blood pressure and MAP variability was significantly higher in the VDCSH compared with controls [6.6 (1.9 – 12.9) mmHg vs. 4.0 (1.7 – 9.5) mmHg; P,0.05 and 6.6 (2.9 – 10.1) mmHg vs. 4.6 (2.5 – 9.1) mmHg; P,0.05). A trend towards increased SBP variability was noted in VDCSH (Figure 1 and
Table 2). Differences in time domain measures of HR, PI variability were not significant (Table 2).
Frequency domain analysis of
cardiovascular variability
Standard VLF, LF, and HF bands of SBP, MAP, and DBP did not differ between cases and controls. A trend towards an increase in both LF (22.6%) and HF (129.6%) bands in VDCSH compared with controls was noted (Table 3).
[image:3.595.54.549.94.255.2]On further inspection of the SBP, MAP, and DBP frequency spectral differences between control and VDCSH groups were . . . .
Table 1 Demographics and baseline cardiovascular function in normal and vasodepressor carotid sinus hypersensitivity groups
Control VDCSH Significance
Number of cases 31/36 12/15
Age Median (range) 72 (50 – 92) 78 (48 – 88) NS
Height (cm) Mean+SD 164.3+8.9 167.8+10.2 NS
Weight (kg) Mean+SD 75.0+14.4 71.2+18.5 NS
SBP (mmHg) Mean+SD 153.1+17.9 159.8+16.7 NS
DBP (mmHg) Mean+SD 74.6+11.0 76.7+12.7 NS
MAP (mmHg) Mean+SD 103.9+11.8 108.4+13.1 NS
HR (b.p.m.) Mean+SD 67.1+12.6 71.9+13.3 NS
MaxRR (ms) Median (range) 882.6 (645.2 – 1308.1) 841.9 (643 – 1130.5) NS
Nadir SBP (mmHg) Mean+SD 124.2+22.7 102.5+19.7 P,0.01
Delta SBP (mmHg) Mean+SD 27.4+9.6 57.2+8.2 P,0.0001
[image:3.595.314.551.301.445.2]MaxRR, maximum RR interval reached after CSM; Nadir SBP, minimum SBP reached after CSM; Delta SBP, maximum change in SBP from baseline after CSM.
. . . .
Table 3 Comparison of standard frequency domain indices of cardiovascular variability
Variable Band Control VDCSH % Change Significance
SBP (mmHg2) SBPVLF 4.43 (IQR 6.36) 3.48 (IQR 6.09) 221.4 NS
SBPLF 3.97 (IQR 4.47) 5.24 (IQR 11.73) 32.0 NS
SBPHF 1.58 (IQR 2.78) 2.69 (IQR 6.54) 70.3 NS
MAP (mmHg2) MAPVLF 2.08 (IQR 4.52) 2.8 (IQR 4.51) 34.6 NS
MAPLF 2.18 (IQR 2.12) 2.66 (IQR 7.56) 22.0 NS
MAPHF 0.58 (IQR 1.65) 1.21 (IQR 3.93) 108.6 NS
DBP (mmHg2) DBPVLF 1.34 (IQR 2.2) 1.74 (IQR 2.01) 29.9 NS
DBPLF 1.55 (IQR 2.19) 1.78 (IQR 2.24) 14.8 NS
DBPHF 0.34 (IQR 1.66) 1.06 (IQR 1.58) 211.8 NS
Subscripts VLF, LF, and HF denote standard frequency bands VLF (0.003 – 0.04 Hz), LF (0.04 – 0.15 Hz), HF (0.15 – 0.4 Hz).
[image:4.595.49.547.232.355.2]. . . .
Table 2 Comparison of time domain indices of cardiovascular variability
Variable Control VDCSH % Change Significance
SBP var (mmHg) Median (range) 6.5 (3.5 – 14.0) 10.3 (4.2 – 16.3) 36.9 P¼0.07
DBP var (mmHg) Median (range) 4.0 (1.7 – 9.5) 6.6 (1.9 – 12.9) 39.4 P,0.05
MAP var (mmHg) Median (range) 4.6 (2.5 – 9.1) 6.6 (2.9 – 10.1) 30.3 P,0.05
HR var (b.p.m.) Median (range) 3.6 (1.1 – 20.1) 5.8 (1.3 – 14.4) 37.9 NS
PI var (ms) Median (range) 49.2 (15.5 – 221.3) 79.7 (24.3– 192.4) 38.3 NS
DBP var, SD of DBP; SBP var, SD of SBP; MAP var, SD of MAP; HR var, SD of HR; PI var, SD of PI.
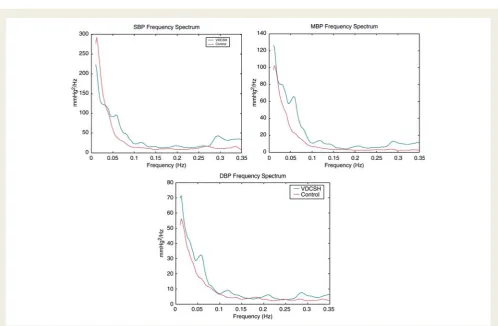
[image:4.595.47.546.385.711.2]obvious in narrow frequency bands within the LF and HF bands (Figure 2A–C). Two peaks exist in the LF band 0.06 Hz and 0.1 – 0.12 Hz in all three spectra in VDCSH but not in controls. A third peak in the HF band at 0.3 Hz was also noted.
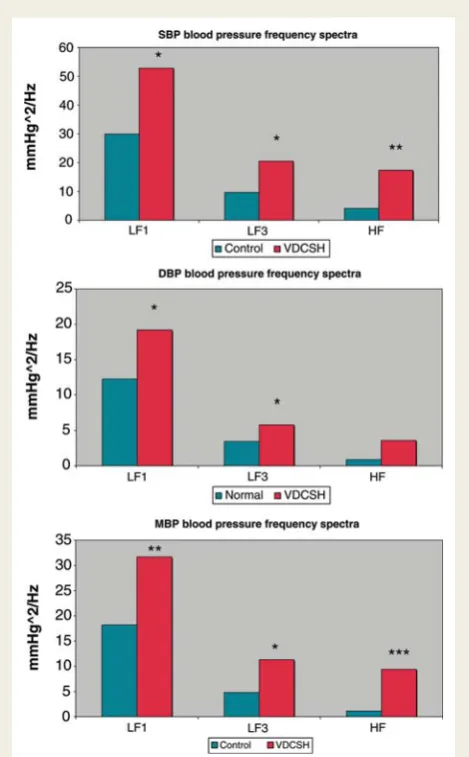
Quantitative analysis indicates significant increases in LF Mayer wave activity in MAP in VDCSH compared with controls at 0.06 Hz [controls 221.7 mmHg2/Hz (IQR: 30.8); VDCSH 231.5 mmHg2/Hz (IQR: 72.0) P,0.05]. At 0.1 Hz differences
approached significance [controls 24.9 mmHg2/Hz (IQR: 9.4); VDCSH 211.5 mmHg2/Hz (IQR: 12.9) P¼0.06]. No significant differences were noted in DBP and SBP spectra (Figure 3).
High frequency respiratory-related blood pressure fluctuations were significantly increased at 0.3 Hz in SBP for case vs. controls [17.4 mmHg2/Hz (IQR: 47.9) vs. 4.1 mmHg2/Hz (IQR: 10.4) P, 0.05] and MAP records [32.5 mmHg2/Hz (IQR: 76.9) vs. 64.6 mmHg2/Hz (IQR: 59.8)P,0.01]. A non-significant increase was found in DBP spectra at these frequencies (Figure 3).
Frequency of peaks analysis
No significant differences were found betweenfPvalues (Table 4),
between cases and controls. For clarity only SBP figures are shown, as trends and values for DBP and MAP were almost identical.
Discussion
Vasodepressor carotid sinus hypersensitivity is associated with sig-nificant increases in short-term blood pressure variability indices. These increases occur in two frequency bands—LF Mayer band, which is influenced strongly by baroreflex control of peripheral resistance vasculature and HF Traube– Herring band, primarily respiratory-related activity.
As far as we are aware, this is the first study investigating charac-teristics of short-term blood pressure fluctuations—Mayer waves in VDCSH.
A small but statistically significant increase in total DBP and MAP variability in VDCSH was detected. Increased blood pressure varia-bility has been linked independently to end-organ damage.26,27 Although these findings support the postulate that medullary centres maybe implicated in abnormal responses in VDCSH,11 increases in total blood pressure variability are non-specific and could arise from a number of internal and external sources, includ-ing cardiac activity,28 respiratory activity,29 hypo- or hyperactive baroreflexes,4 cognitive activation,30 and muscle activation24 amongst others. Wideband pressure fluctuations or increased blood pressure variance of this magnitude has been associated with blunted baroreflexes,31 with ageing,32 arterial stiffness,33 in animal models with baroreflex deafferentation.13 In such cases, increases in total blood pressure variability have been attributed to a reduced ability to modulate peripheral resistance and vascular compliance for blood pressure control in the face of internal and external disturbances.
[image:5.595.51.286.169.548.2]Paradoxically increases in blood pressure variability restricted to specific Mayer wave frequency bands have been explained by an
Figure 3 Comparison of frequency domain indices of BP varia-bility. (A) SBP (top), (B) DBP (middle), (C) MAP (bottom). (*P,0.1; **P,0.05; ***P,0.01).
. . . .
Table 4 Comparison of the frequency of peak for systolic blood pressure for the defined frequency bands VLF, LF, MF, HF
Variable Band Control VDCSH % Change Significance
SBP FVLF 0.037+0.0025 0.035+0.005 24.1 NS
FLF1 0.0583+0.0058 0.063+0.006 8.8 NS
FMF 0.097+0.012 0.103+0.01 6.19 NS
[image:5.595.61.549.658.729.2]increase in the gain and/or range of the baroreflex.19,22 Experimen-tal and theoretical evidence have been provided in support of this conclusion.13It has been reasoned that a highly reactive baroreflex will impose strong focussed modulations upon any internal or external blood pressure fluctuations only within a narrow fre-quency band13 typically 0.1 Hz. Furthermore, the amplitude of these oscillations will be determined by the saturation and threshold properties of the baroreflex.19In this case, a sharp res-onant peak would be expected in blood pressure spectra around the natural oscillating frequency of the feedback loop.
To draw any conclusions and make inferences regarding the nature of dysfunction in VDCSH from this finding, spectral analysis was used to further interrogate the source of the variability by decomposing the pressure fluctuations into their constituent sub-bands.
As hypothesized significant alterations in the LF Mayer band were detected indicated by a small peak in the LF bands. Such changes are consistent with alterations in the peripheral resistance-controlling arc of the baroreflex in VDCSH13,20and could be con-sidered indicative of an increased gain or range of the baroreflex. However, since the frequency of this peak is at the lower end of the Mayer wave band at 0.06 Hz, some doubt still remains over whether one can definitively conclude that a hypersensitive baror-eflex response exists in VDCSH. This is the first study to report possible surrogate markers for baroreflex sensitivity controlling peripheral resistance in VDCSH. In CSH, a hypersensitive response has only been observed reliably during CSM in comparison to other baroreflex sensitivity (BRS) measures. Other studies have examined BRS in CICSH only and have had contradictory results when assessing BRS using methods other than CSM in CCSS/ CSH populations. Some have reported a paradoxical decrease in BRS,34 no change in BRS,35 whereas others have indicated an increase in BRS36,37It has been suggested that this discrepancy is due to differences in stimuli characteristics and protocol.34 However, none to date has investigated the gain of the peripheral resistance feedback loop in vasodepressor form of CSH and so no parallels can be drawn here with other studies in VDCSH.
This finding is not in isolation. An increase in HF respiratory blood pressure waves was also detected. These results are consist-ent with altered respiratory drive in VDCSH resulting in increased tidal volume and increased intra thoracic pressure changes during respiration. Peripheral and central respiration and cardiovascular control centres are intimately linked,38so it is plausible that respir-atory centres are also affected in CSH. Increases in cardiorespira-tory variables to our knowledge have not been documented in CSH, however altered respiratory parameters including tidal and minute volume have been noted in other forms of neurocardiovas-cular syncope.39 Kenny et al.40 noted altered cardiorespiratory coupling during deep breathing test in a small series of patients with CICSH. Galdston and Steele41 reported hyperpnoea in response to CSM hypothesizing that blood flow to chemorecep-tors was altered. Furthermore, our findings would be in keeping with Doux and Yun’s recent hypothesis, which suggests that carotid artery disease, induces maladaptation of chemoreceptors and baroreceptors in ischaemic stroke, which in turn may be responsible for autonomic mediated dysfunction in cerebral autoregulation.42
Unfortunately, a definite conclusion cannot be drawn into nature and direction of dysfunction in VDCSH based on these results alone. Further scientific investigation is hence warranted into (i) the nature of blood pressure variability in VDCSH to deter-mine whether the cause is truly a hypersensitive or hyposensitive baroreflex and (ii) the role cardiorespiratory activity plays in CSH pathogenesis.
Limitations
As of any case – control study, we are limited in making any state-ments regarding causality in relation to VDCSH and blood pressure variability. However, biologically plausible mechanisms have been established by which VDCSH could affect blood pressure variability.11These mechanisms are supported by the pre-vious studies, looking at neurogenic sources of blood pressure control in autonomic dysfunction.38Such levels of autonomic dys-function have also been shown to occur in CSH by previous authors.40Furthermore, altered circadian blood pressure control was also noted previously in CSH.43Another possible limitation of our study is the lack of respiratory variable measurement. This limits our ability in drawing a definite conclusion as to the source of the detected variability especially in the HF band. However, since our significant findings were specifically found in the HF band of SBP and MAP spectra and not in the DBP records, this would support our hypothesis that these differences are respiratory related. Respiratory activity is well known to affect SBP/MAP significantly.
Conclusion
Blood pressure variability, in particular Mayer and Traube – Herring bands, was increased in VDCSH. This finding is consistent with the hypothesis that baroreflex activity is altered in VDCSH, but may also implicate cardiorespiratory centres in pathogenesis of VDCSH. Blood pressure variability thus holds the potential as a novel non-invasive marker of VDCSH, which may be related to degree of dysfunction in CSH. Further research is required to confirm the underlying physiological cause and nature of this variability.
Acknowledgements
We thank Kathleen Bennett for technical assistance and Helen Fitzpatrick for assistance with the manuscript.
Conflict of interest:none declared.
Funding
This work was supported by The Mercer’s Institute for Research on Ageing, St James’s Hospital, Dublin 8, Ireland.
References
1. Humm AM, Mathias CJ. Unexplained syncope—is screening for carotid sinus
hypersensitivity indicated in all patients aged.40 years?J Neurol Neurosurg
Psy-chiatry2006;77:1267 – 70.
2. Kerr SRJ, Pearce MS, Brayne C, Davis RJ, Kenny RA. Carotid sinus hypersensitivity in asymptomatic older persons: implications for diagnosis of syncope and falls.
3. Masson C. Carotid sinus hypersensitivity: an age-related phenomenon.J Neurol Neurosurg Psychiatry2006;77:1207.
4. Eckberg D.Human Baroreflexes in Health and Disease. Oxford: Clarendon Press;
1992.
5. Parry SW, Richardson DA, O’Shea D, Kenny RA. Diagnosis of carotid sinus hyper-sensitivity in older adults: carotid sinus massage in the upright position is essential.
Heart2000;83:22 – 3.
6. Roskam J. Un syndrome nouveau: syncopes cardiaques graves et syncopes
re´pe´-te´es par hyperre´flectivite´ sino-cartidienne.La Presse Medicale1930;39:590 – 3.
7. Kenny RA, Traynor G. Carotid sinus syndrome—clinical characteristics in elderly
patients.Age Ageing1991;20:449 – 54.
8. McIntosh SJ, Lawson J, Kenny RA. Clinical characteristics of vasodepressor,
cardi-oinhibitory, and mixed carotid sinus syndrome in the elderly.Am J Med1993;95:
203 – 8.
9. Brignole M, Menozzi C, Lolli G, Bottoni N, Gaggioli G. Long-term outcome of
paced and nonpaced patients with severe carotid sinus syndrome.Am J Cardiol
1992;69:1039 – 43.
10. O’Mahony D. Pathophysiology of carotid sinus hypersensitivity in elderly patients.
Lancet1995;346:950 – 2.
11. Miller VM, Slade JY, Oakley AE, Kalaria RN. Medullary autonomic pathology in
carotid sinus hypersensitivity.Neuropathol Appl Neurobiol2007;34:403 – 11.
12. Polvikoski T, Kalaria RN, Perry R, Miller V, Kenny RA. Carotid sinus
hypersensi-tivity associated with focalfalphag-synucleinopathy of the autonomic nervous
system.J Neurol Neurosurg Psychiatry2006;77:1064 – 6.
13. Julien C. The enigma of Mayer waves: Facts and models.Cardiovasc Res2006;70:
12 – 21.
14. Japundzic N, Grichois ML, Zitoun P, Laude D, Elghozi JL. Spectral analysis of blood
pressure and heart rate in conscious rats: effects of autonomic blockers.J Auton
Nerv Syst1990;30:91 – 100.
15. Cevese A, Gulli G, Polati E, Gottin L, Grasso R. Baroreflex and oscillation of heart
period at 0.1 Hz studied byfalphag-blockade and cross-spectral analysis in healthy
humans.J Physiol2001;531:235 – 44.
16. Di Rienzo M, Parati G, Castiglioni P, Omboni S, Ferrari AU, Ramirez AJet al.Role
of sinoaortic afferents in modulating BP and pulse-interval spectral characteristics
in unanesthetized cats.Am J Physiol Heart Circ Physiol1991;261:H1811 – 18.
17. Mancia G, Parati G, Castiglioni P, di Rienzo M. Effect of sinoaortic denervation on
frequency-domain estimates of baroreflex sensitivity in conscious cats.Am J Physiol
Heart Circ Physiol1999;276:H1987 – 93.
18. Cooke WH, Hoag JB, Crossman AA, Kuusela TA, Tahvanainen KUO, Eckberg DL. Human responses to upright tilt: a window on central autonomic integration.
J Physiol1999;517:617 – 28.
19. de Paor A, Ringwood J. A simple soft limiter describing function for biomedical
applications.IEEE Trans Biomed Eng2006;53:1233 – 40.
20. Ringwood JV, Malpas SC. Slow oscillations in blood pressure via a nonlinear
feed-back model.Am J Physiol Regulatory Integrative Comp Physiol2001;280:R1105 – 15.
21. Liu H-K, Guild S-J, Ringwood JV, Barrett CJ, Leonard BL, Nguang SK et al.
Dynamic baroreflex control of blood pressure: influence of the heart vs.
periph-eral resistance.Am J Physiol Regulatory Integrative Comp Physiol2002;283:R533 – 42.
22. Hammer PE, Saul JP. Resonance in a mathematical model of baroreflex control:
arterial blood pressure waves accompanying postural stress.Am J Physiol
Regulat-ory Integrative Comp Physiol2005;288:R1637 – 48.
23. Burgess DE, Hundley JC, Li S-G, Randall DC, Brown DR. First-order differential-delay equation for the baroreflex predicts the 0.4-Hz blood pressure rhythm in
rats.Am J Physiol Regulatory Integrative Comp Physiol1997;273:R1878 – 84.
24. Malik M.Clinical Guide to Cardiac Autonomic Tests.London: Kluwer Academic
Pub-lishers; 1998.
25. DeBoer RW, Karemaker JM, Strackee J. Comparing spectra of a series of point
events particularly for heart rate variability data.IEEE Trans Biomed Eng1984;
31:384 – 7.
26. Frattola A, Parati G, Cuspidi C, Albini F, Mancia G. Prognostic value of 24-hour
blood pressure variability.J Hypertens1993;11:1133 – 7.
27. Palatini PPM, Racioppa A, Zugno E, Guzzardi G, Anaclerio M, Pessina AC. Clinical relevance of nighttime blood pressure and of daytime blood pressure variability.
Arch Intern Med1992;152:1855 – 60.
28. O’Leary DS, Woodbury DJ. Role of cardiac output in mediating arterial blood
pressure oscillations.Am J Physiol Regulatory Integrative Comp Physiol1996;271:
R641 – 46.
29. Beda A, Jandre FC, Phillips DI, Giannella-Neto A, Simpson DM. Heart-rate and blood-pressure variability during psychophysiological tasks involving speech:
influ-ence of respiration.Psychophysiology2007;44:767 – 78.
30. Middeke M, Schrader J. Nocturnal blood pressure in normotensive subjects and
those with white coat, primary, and secondary hypertension.Br Med J1994;
308:630 – 2.
31. Mancia G, Ferrari A, Gregorini L, Parati G, Pomidossi G, Bertinieri Get al.Blood
pressure variability in man: its relation to high blood pressure, age and baroreflex sensitivity.Clin Sci (Lond)1980;59:401s – 4s.
32. Cicconetti P, Cacciafesta M, Migliori M, Di Gioacchino CF, Vetta F, Chiarotti F
et al. Influence of sex and age on blood pressure variability. Arch Gerontol Geriatr2000;30:225 – 36.
33. Mancia G, Parati G, Hennig M, Flatau B, Omboni S, Glavina Fet al.Relation
between blood pressure variability and carotid artery damage in hypertension: baseline data from the European Lacidipine Study on Atherosclerosis (ELSA).
J Hypertens2001;19:1981 – 9.
34. Morillo CA, Camacho ME, Wood MA, Gilligan DM, Ellenbogen KA. Diagnostic utility of mechanical, pharmacological and orthostatic stimulation of the carotid
sinus in patients with unexplained syncope.J Am Coll Cardiol1999;34:1587 – 94.
35. Cole CR, Zuckerman J, Levine BD. Carotid sinus ‘irritability’ rather than
hyper-sensitivity: a new name for an old syndrome?Clin Auton Res2001;11:109 – 13.
36. Morley CA, Dehn TCB, Perrins EJ, Chan SL, Sutton R. Baroreflex sensitivity measured by the phenylephrine pressor test in patients with carotid sinus and
sick sinus syndromes.Cardiovasc Res1984;18:752 – 61.
37. Dehn TCB, Morley CA, Sutton R. A scientific evaluation of the carotid sinus
syn-drome.Cardiovasc Res1984;18:746 – 51.
38. Janig W. The Integrative Action of the Autonomic Nervous System: Neurobiology.
Cambrdge University Press; 2006.
39. Virag N, Sutton R, Vetter R, Markowitz T, Erickson M. Prediction of vasovagal syncope from heart rate and blood pressure trend and variability: experience
in 1,155 patients.Heart Rhythm2007;4:1375 – 82.
40. Kenny RA, Allen JA, Wallace WF. Autonomic reflexes in patients with
cardioin-hibitory carotid sinus syncope.Clin Auton Res1993;3:101 – 5.
41. Galdston MGR, Steele J. Studies of the variation in circulatory and respiratory
responses to carotid sinus stimulation.Am Heart J1943;26:216.
42. Doux JD, Yun AJ. The link between carotid artery disease and ischemic stroke may be partially attributable to autonomic dysfunction and failure of cerebrovas-cular autoregulation triggered by Darwinian maladaptation of the carotid
baror-eceptors and chemorbaror-eceptors.Med Hypotheses2006;66:176 – 81.
43. Mulcahy R, Jackson SH, Richardson DA, Lee DR, Kenny RA. Circadian and
ortho-static blood pressure is abnormal in the carotid sinus syndrome.Am J Geriatr