Received 9 Jan 2015|Accepted 4 Sep 2015|Published 15 Oct 2015
Liquid exfoliation of solvent-stabilized few-layer
black phosphorus for applications beyond
electronics
Damien Hanlon
1,2,*, Claudia Backes
1,2,*, Evie Doherty
1,2,3, Clotilde S. Cucinotta
1,2, Nina C. Berner
1,3,
Conor Boland
1,2, Kangho Lee
1,3, Andrew Harvey
1,2, Peter Lynch
1,2, Zahra Gholamvand
1,2, Saifeng Zhang
4,
Kangpeng Wang
1,2,4, Glenn Moynihan
1,2, Anuj Pokle
1,2,3, Quentin M. Ramasse
5, Niall McEvoy
1,3,
Werner J. Blau
1,2, Jun Wang
4, Gonzalo Abellan
6, Frank Hauke
6, Andreas Hirsch
6, Stefano Sanvito
1,2,
David D. O’Regan
1,2, Georg S. Duesberg
1,3, Valeria Nicolosi
1,2,3& Jonathan N. Coleman
1,2Few-layer black phosphorus (BP) is a new two-dimensional material which is of great interest for applications, mainly in electronics. However, its lack of environmental stability severely limits its synthesis and processing. Here we demonstrate that high-quality, few-layer BP nanosheets, with controllable size and observable photoluminescence, can be produced in large quantities by liquid phase exfoliation under ambient conditions in solvents such as
N-cyclohexyl-2-pyrrolidone (CHP). Nanosheets are surprisingly stable in CHP, probably due to the solvation shell protecting the nanosheets from reacting with water or oxygen. Experiments, supported by simulations, show reactions to occur only at the nanosheet edge, with the rate and extent of the reaction dependent on the water/oxygen content. We demonstrate that liquid-exfoliated BP nanosheets are potentially useful in a range of applications from ultrafast saturable absorbers to gas sensors to fillers for composite reinforcement.
DOI: 10.1038/ncomms9563 OPEN
1School of Physics, Trinity College Dublin, Dublin 2, Ireland.2CRANN and AMBER Research Centres, Trinity College Dublin, Dublin 2, Ireland.3School of
O
ver the last few years, the study of two-dimensional (2D) materials1–6 such as graphene, BN and MoS2 have become one of the most exciting areas of nano-science. However, in the past year a new 2D material has been generating considerable excitement in the research community7. Phosphorene consists of atomically thin, 2D nanosheets of black phosphorus (BP). In BP, the monolayers stack together via van der Waals interactions to form layered crystals in much the same way as graphene stacks together to form graphite. Recently, it was shown that BP can be exfoliated by mechanical cleavage to form mono- and few-layer phosphorene, which we refer to as FL-BP8–12. This new material has a direct bandgap in mono-, few-layer and bulk forms, which varies with nanosheet thickness fromB1.5 eV for monolayer phosphorene toB0.3 eV for bulk BP8,13,14. This is in contrast to graphene1which has no bandgap and materials such as MoS2, which display direct bandgaps only in the monolayer form6. As a result, BP is extremely attractive both for electronics and optoelectronics and has therefore been extensively studied in applications such as transistors7,12,15, photodetectors15,16and solar cells9.In addition, like other 2D materials, it is probable that BP has the potential to perform in a range of applications beyond (opto)electronics. Indeed, BP has already been fabricated into electrodes in lithium ion batteries17. Furthermore, theory predicts that FL-BP shows potential for use in gas sensors18 and thermoelectrics19. For most applications, it will be necessary to produce FL-BP in much larger quantities than can be achieved by mechanical exfoliation. One way to prepare nanosheets in large quantities is by liquid phase exfoliation (LPE)20,21. This technique involves the sonication22,23 or shearing24,25 of layered crystals in appropriate liquids and has previously been applied to graphene and boron nitride, as well as a range of other 2D materials21–23,26–28.
While phosphorene nanosheets have very recently been produced by liquid exfoliation29–31, this method remains problematic, largely because BP is known to be unstable7,8,32, degrading via reactions with water and oxygen. For this method to be useful, ways must be found to stabilize liquid-exfoliated FL-BP nanosheets against oxidation. It is known that FL-BP can be protected from reacting with environmental species by encapsulation, suggesting a possible way forward7,24. We hypothesized that LPE of BP may be practical if the solvent is carefully chosen to minimize oxidation of the exfoliated nanosheets in the liquid phase due to the solvation shell acting as a barrier to prevent oxidative species reaching the nanosheet surface.
If this could be achieved it would yield numerous advantages. LPE is a powerful technique to produce nanosheets in large quantities. In addition, the nanosheets are produced directly in the liquid phase and are thus inherently processable and can be easily formed into composites, coatings or films21, facilitating their use in a range of applications. Furthermore, size-control can be achieved by centrifugation, enabling processing for both applications and fundamental studies. For example, studying the oxidation of BP nanosheets of varying sizes would give insight into whether the degradation mechanism is associated with nanosheet edges or the basal plane. However, most importantly, protection of the nanosheets by an appropriate solvent would allow large-scale production in ambient conditions, dramatically simplifying future development of this material.
In this work, we demonstrate that BP can be exfoliated to give large quantities of FL-BP nanosheets by sonication in solvents such as N-cyclohexyl-2-pyrrolidone (CHP), even in ambient conditions. We show that these nanosheets can be readily size-selected by controlled centrifugation. Such dispersions show direct gap photoluminescence (PL) with PL energy, width and
relative quantum yield scaling strongly with layer number. The BP nanosheets are relatively stable in CHP, but degrade rapidly once water/O2 is added. The reaction occurs predominantly at nanosheet edges, presumably following a different reaction pathway than previously observed32. Finally we demonstrate that liquid-exfoliated BP nanosheets can be used in applications beyond electronics. We show that dispersions of FL-BP have impressive nonlinear optical properties allowing them to be used in optical switching applications. In addition, the nanosheets can be incorporated into polymer matrices resulting in reinforced composites and are highly potent gas sensors.
Results
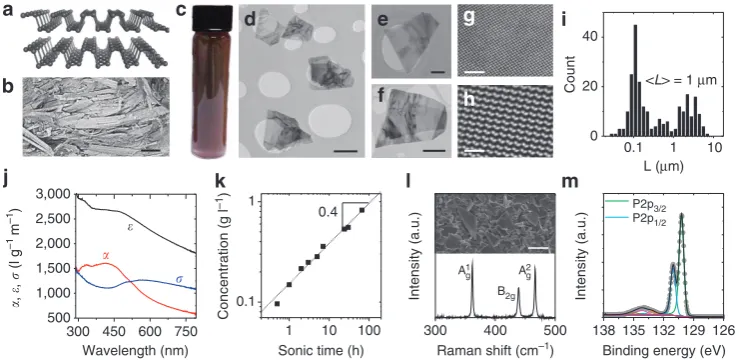
Exfoliation and basic characterization. To produce large quantities of BP nanosheets (see Fig. 1a for structure), we use LPE22,23. This technique is often carried out in amide solvents such as CHP or N-methyl-2-pyrrolidone (NMP), although isopropanol (IPA) has proven useful in some cases22. Sonication of ground BP crystals (see Fig. 1b for scanning electron microscopic (SEM) image) in CHP yields a brown dispersion (Fig. 1c). In the simplest case, we remove unexfoliated material by centrifugation at 1,000 r.p.m. (106g) for 180 min to yield a stable dispersion which we refer to as the standard sample (std-BP, see Supplementary Fig. 1 for process optimization).
The successful exfoliation of BP in CHP was confirmed by transmission electron microscopy (TEM) of nanosheets on holey carbon grids (TEM, Fig. 1d–f and Supplementary Fig. 2). These images show electron-transparent nanosheets with lateral dimen-sionsLB1mm. As shown by scanning TEM (STEM) and high-angle annular dark field (HAADF) STEM imaging, the lattice appears intact over wide regions (Fig. 1g,h). This suggests that, as with other 2D materials, BP can be exfoliated in liquids without the introduction of defects21–24,33. N.B. we used FL-BP exfoliated in IPA for STEM and HAADF, due to difficulties in completely removing the CHP. However, the intact lattice was also observed from the std-BP in CHP (Supplementary Fig. 3). To assess the lateral dimensions of the std-BP, we performed statistical TEM analysis, finding a bimodal size distribution with modes associated with LB100 nm and LB3mm (Fig. 1i). We note that the larger nanosheets are considerably bigger than is typically observed for other 2D materials (for example,Lo1mm)22,26,33,34.
To further characterize the std-BP dispersion, we measured the extinction coefficient, e, as shown in Fig. 1j. This parameter is defined via the optical transmittance; T¼10eCl, wherel is the cell length and C is the nanosheet concentration (measured by filtration and weighing). The extinction coefficient includes contributions from both absorbance (a) and scattering (s)33,35, which can be isolated using an integrating sphere and are shown in Fig. 1j. Note that coefficients of extinction, absorbance and scattering are related by e(l)¼a(l)þs(l)33,35. Because of size-dependent scattering contributions, the extinction coefficient cannot be used to accurately measure nanosheet concentration of varying sizes33–35. Instead, we can use the measured absorbance coefficient (a(l¼465 nm)¼15 l g1cm1) to give the concentration of all subsequent FL-BP dispersions. For example, Fig. 1k shows the BP concentration measured this way to scale with the sonication time asCpt0.4, similar to previous
observations for graphene exfoliation24,36. Concentrations as high as B1 g l1can easily be realized.
(Fig. 1m) show the expected contributions from P2p1/2 and P2p3/2 components. Contributions from PxOy species, presumably as a result of partial degradation (discussed below) are minor (o15%).
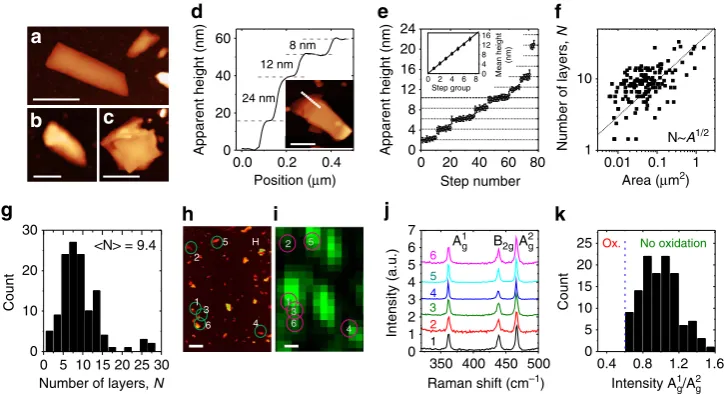
We can obtain information about the nanosheet thickness using statistical atomic force microscopy (AFM) analysis (images Fig. 2a–c and Supplementary Fig. 4). To overcome the problems associated with deposition of nanosheets onto substrates from high-boiling point solvents, the std-BP in CHP was transferred to IPA prior to drop casting the samples (see Methods). Apparent AFM heights from liquid-exfoliated nanomaterials are usually overestimated due to residual solvent24,33,37, as well as contributions from effects such as capillary forces and adhesion38,39. To overcome these problems and to convert the apparent measured AFM thickness to the number of layers, we have applied a similar approach to that reported for graphene and MoS2 (refs 26,27). This involves AFM analysis of incompletely exfoliated nanosheets (Fig. 2d inset), measuring the height of the steps between terraces (Fig. 2d and Supplementary Fig. 5). By plotting the measured step heights in ascending order (Fig. 2e), groups of steps with similar apparent heights appear. It is clear that the apparent step height is always a multiple of B2 nm, a value which we associate with the apparent monolayer height24,33. By plotting the mean apparent height associated with each group in ascending order (Fig. 5e inset), we find the apparent monolayer thickness to be 2.06±0.18 nm even though the real thickness isB0.5–0.7 nm. We can use this information to convert the measured apparent AFM heights into number of layers,N. We then determine the mean number of layers of std-BP to be oN4¼9.4±1.3 (see Supplementary Fig. 6 for the impact of uncertainty in apparent monolayer height). Shown in Fig. 2f is a plot of N versus nanosheet area for std-BP, demonstrating a rough correlation between flake thickness and area:N/pffiffiffiffiA, as previously observed for exfoliated MoO3and GaS nanosheets26,40. The nanosheets are reasonably thin:B70% of the observed nanosheets haveNr10 (Fig. 2g).
To gain further insights into the spectroscopic properties of our LPE FL-BP, we have selected a sample area with nanosheets of
varying sizes and thicknesses by AFM (Fig. 2h) and relocated the same area under a Raman microscope (Supplementary Fig. 7). A spatial Raman map (Ag1intensity, excitation wavelength 633 nm) of the region is shown in Fig. 2i. Single spectra (normalized to the Ag1 mode) extracted at the positions indicated in the Figure are displayed in Fig. 2j. These roughly correspond to the nanosheets circled in Fig. 2i. It has been shown that the intensity ratio of the Ag1/Ag2 phonon sensitively depends on sample degradation as a result of oxidation32. We therefore analysed the Ag1/Ag2 intensity ratio of 120 individual Raman spectra after baseline subtraction. The resultant intensity ratio histogram is plotted in Fig. 2k. None of the spectra showed Ag1/Ag2o0.6, confirming the basal planes to be unoxidized32. Analysis of data collected using 532 nm excitation gives very similar results (Supplementary Fig. 8). Furthermore, oxidation typically gives rise to a broad component under the B2g and Ag2 modes32 which is not observed in our samples, further confirming the structural integrity.
Size selection. A great advantage of liquid exfoliation is the ability to perform size-selection24,33,41. This is important, as some applications (for example, mechanical reinforcement)42 require large nanosheets, while others (for example, catalysis)43 benefit from small nanosheets. To demonstrate that established size-selection techniques can be applied to liquid-exfoliated FL-BP, we have performed controlled centrifugation to obtain dispersions with varying size distributions (Methods and Supplementary Figs 9-10). Nanosheet length histograms are displayed in Fig. 3a–c (and Supplementary Fig. 11) for three representative size distributions with meanLranging from 190 to 620 nm. Note that, for much of the remainder of the study, in addition of the std-BP, we have studied dispersions containing small (S-BP,
oL4¼130 nm) and large (L-BP, oL4¼2.3mm) to gain insights into size effects (see Supplementary Methods and Supplementary Figs 10 and 12).
We have also analysed the ultraviolet–visible optical response of dispersions of nanosheets of varying size. For each sample, we have measured the optical extinction spectra as shown in Fig. 3d.
0.1 1 10
0 20 40
300 450 600 750 500
1,000 1,500 2,000 2,500 3,000
1 10 100
0.1
1
Sonic time (h) Wavelength (nm)
300 400 500
B2g
138 135 132 129 126
A1
g A2g
Binding energy (eV) Raman shift (cm–1)
,
,
(l g
–1
m
–1
)
Concentration (g l
–1
)
Intensity (a.u.) Intensity (a.u.)
0.4 P2p3/2
P2p1/2
Count
L (μm) <L> = 1 μm
[image:3.595.114.484.49.229.2]
Figure 1 | Basic characterization of exfoliated black phosphorous.(a) Structure of black phosphorus (BP). (b) SEM image of a layered BP crystal (scale
The absorbance and scattering spectra of the size-selected FL-BP dispersions are also shown in Fig. 3e,f. Very clear spectral changes as a function of size can be seen in all spectra. Such changes are primarily due to the fact that each sample contains a different distribution of nanosheet thicknesses, each of which contributes a significantly different component to the measured spectrum10. In addition, the effect of edges may also contribute to the size-dependent changes in spectral shape33,44. The scattering spectra shown in Fig. 3f also vary strongly with nanosheet length. We have characterized this in more detail in Supplementary Fig. 13, using this data to generate a metric to extract nanosheet length from scattering spectra.
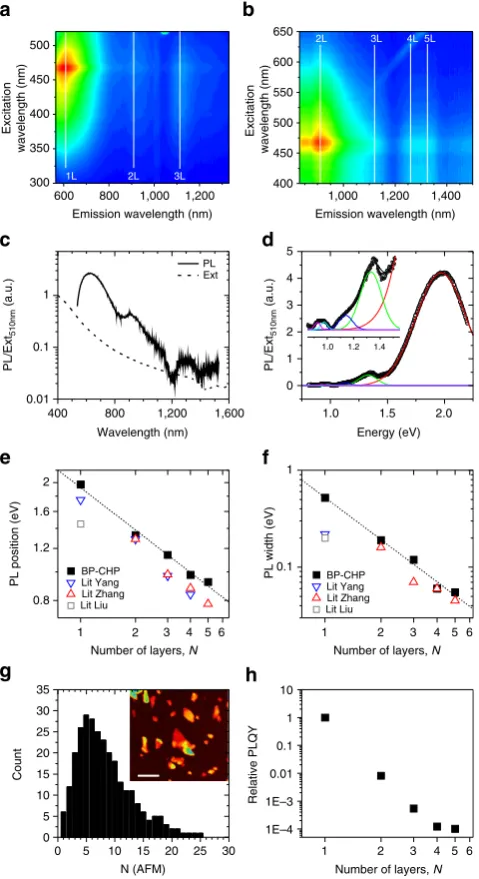
Photoluminescence. A number of publications have demon-strated PL from mechanically exfoliated BP nanosheets with one to five layers13,45,46. To investigate the possibility of PL from liquid-exfoliated FL-BP, we prepared dispersions by performing the sonication under inert gas conditions to avoid any partial oxidation of the BP. However, we note that the sample produced using standard centrifugation was very similar to our std-BP exfoliated under ambient conditions (see Supplementary Figs 14– 19 for more information). Prior to the PL measurement, additional centrifugation steps were performed (see Methods) to further remove large and thick nanosheets. Shown in Fig. 4a,b are PL emission–excitation contour maps measured for an FL-BP dispersion in CHP. Very clear emission lines can be seen atB600 andB900 nm with weaker features appearing atB1,150,B1,260 andB1,325 nm. We associate these features with PL from 1L to 5L BP, respectively. Plotted in Fig. 4c is a PL line spectrum, excited at 510 nm with the measured extinction spectrum for comparison. We have fitted this spectrum to five Gaussian (due to inhomogeneous broadening) lines in Fig. 4d, representing
1-, 2-, 3- 4- and 5-layer nanosheets. In agreement with previous results13, we see strong layer-number-dependence of both position and width of the fit components, reflecting the changes in the band structure of exfoliated BP8,13,14. The PL intensity also depends strongly on nanosheet thickness. To separate out the effects of thickness-dependent internal PL quantum yield (PLQY) and the population of nanosheets of a given thickness, we performed AFM analysis on this sample (inset of Fig. 4g and Supplementary Fig. 16). From such images, we measured nanosheet layer number and area (estimated as lengthwidth) for B300 nanosheets with the layer-number distribution shown in Fig. 4g. We then calculate the relative PLQY by dividing the integrated PL area for each layer number by the volume fraction of nanosheets of that thickness (approximately equivalent to PL/ absorbance for each layer number, Fig. 4h, see Supplementary Table 1). As observed previously13, we find the PLQY to be extremely sensitive to nanosheet thickness varying by 4 orders of magnitude from one to five layers. This effect13 is due to the thickness-dependent band structure of BP, as the internal PLQY (and width) is governed by the density of states distribution for electrons/holes, which depends on the number of band maxima and valleys.
Degradation. It has previously been shown that exfoliated BP degrades in the presence of water and oxygen, greatly limiting its application potential7,8,12,32. However, this may actually be less of a problem for liquid exfoliation as the solvation shell may protect the nanosheets from reacting with oxygen or water. To test this, we have monitored the temporal stability of liquid-dispersed BP by tracking the absorbance,A(l¼465 nm), of std-BP, S-BP and L-BP as a function of time (A¼aCl, Fig. 5a, Supplementary Fig. 20 and Supplementary Note 1). As we expect the reaction
0 20 40 60 80 0
4 8 12 16 20 24
24 nm
6
5 4
3
2
1
B2gA2g A1
g
0 5 1015 20 25 30 10
20 30
0
350 400 450 500 0
1 2 3 4 5 6 7
0.8 1.2 1.6 0
5 10 15 20
25 Ox. No oxidation
0.01 0.1 1 10
1 0
20 40
60 8 nm
12 nm
0 4 80 4 8 12 16
Mean height
(nm)
Step group
2 5
3 1
6 4
1 2
3 5
4 6 H
Count
Number of layers, N Raman shift (cm–1) Intensity A1 g/A2g 0.4
Count
Area (μm2) Step number
Number of layers,
N
Apparent height (nm)
Apparent height (nm)
0.4 0.2 0.0
Position (μm)
Intensity (a.u.)
<N> = 9.4
6 2
[image:4.595.116.479.49.246.2]N~A1/2
Figure 2 | Characterization of individual nanosheets.(a–c) Representative atomic force microscopic (AFM) images (scale bars ina,bandc:are 500, 200
and 1000 nm). (d) Height profile of the nanosheet in the inset along the line showing clearly resolvable steps, each consisting of multiple monolayers (scale bar, 500 nm). (e) Heights of470 steps of deposited FL-BP nanosheets in ascending order. The step height clustered in groups and is always found to be a multiple ofB2 nm, which is the apparent height of one monolayer. The mean height for each group (the error is the sum of the mean step height error and the s.d. in step height within a given group) is plotted in ascending order in the inset with the slope giving a mean monolayer step height of 2.06±0.18 nm. (f) Plot of number of layers per nanosheet (obtained by dividing the apparent height by the step height) as a function of flake area determined from AFM. The dashed line indicatesN/pffiffiffiffiAbehaviour. (g) Histogram of number of monolayers per nanosheet (sample size¼126). The mean number of layers is determined as 9.4±1.3 nm (where the error is due to the uncertainty in the step height analysis and the s.e. of the distribution). (h,i) Large area AFM image (h, scale bar, 1mm) and Raman A1
gintensity map (i, excitation wavelength 633 nm) of the same sample region. (j) Raman spectra (normalized to Ag2) of the nanosheets indicated inhandi(the numbers labelling the spectra injcorrespond to the nanosheets marked by numbers inhandi). (k) Histogram of the intensity ratio of the Ag1/Ag2modes obtained from the analysis of 120 baseline-corrected spectra acquired over an area of 2525mm2
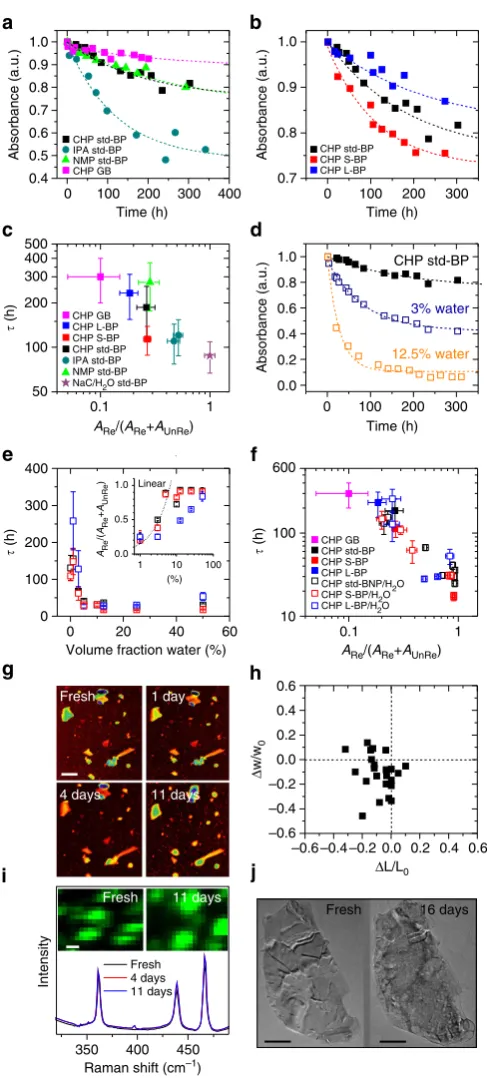
products to be molecules with wide HOMO-LUMO gaps32, the measured absorbance will be dominated by the unreacted BP. This is supported by the lack of spectral changes with time. All samples were shaken before measurement to avoid sedimentation effects and measured at similar absorbances/concentrations. In this case, degradation of the FL-BP should result in a fall in measured absorbance over time, which we do indeed observe for BP exfoliated in a number of solvents (Fig. 5a). It is clear that exfoliation in CHP and NMP results in low reactivity, which can be reduced even further by preparing the dispersions in dried and deoxygenated CHP under inert conditions (sample CHP GB). In addition, we see an increase in the reactivity with decreasing nanosheet size (Fig. 5b, Supplementary Table 2 and Supplementary Fig. 21), suggesting that the chemical reaction starts from the edge as previously found for other 2D materials such as TiS2(ref. 47).
Similar to Martel and co-workers32, we fit these curves to exponential decays: A¼AUnReþAReet/t, whereARerepresents the total amount of FL-BP which reacts over time and AUnRe represents the component which never reacts. Typically we observe time constants of 10s–100s of hours. This is much longer
than the decay times of B1 h observed by Martel and co-workers32 for mechanically cleaved BP in water, implying the degredation kinetics to be considerably different for solvent exfoliated BP. Such fits allow us to parameterize good solvents as those with long t and small ARe/(AUnReþARe) 0 500 1,000 1,500
0 10 20 30 40
<L> = 620 nm
<L> = 435 nm
Count
<L> = 190 nm
0 500 1,000 1,500 0
5 10 15 20 25 30
Count
0 500 1,000 1,500 0
10 20 30 40 50
400 600 800 0.0
0.5 1.0 1.5
400 600 800 0.0
0.5 1.0
Size
Size Size
400 600 800 0.1
1
Count
L (nm) Wavelength (nm)
(a.u.)
(a.u.)
[image:5.595.309.549.50.490.2]
(a.u.)
Figure 3 | Size dependence of optical properties of exfoliated Black
Phosphorous.(a–c) TEM length histograms of size-selected FL-BP in CHP
including representative TEM images as insets (scale bars ina–c: 100, 200 and 200 nm). Sample sizes ina–care 131, 111 and 140, respectively. (d) Extinction (e) spectra normalized to 355 nm of FL-BP dispersions with different mean nanosheet lengths showing systematic changes as a function of size. Extinction spectra can be split into contributions from absorbance (a) and scattering (s). (e) Absorbance spectra of the same dispersions (normalized to 340 nm) and (f) scattering spectra. Scattering spectra were obtained by subtracting the absorbance spectra from the normalized extinction spectra.
400 800 1,200 1,600
0.01 1
PL Ext
0 1 2 3 4 5
2
BP-CHP
1 2 3 4 5 6
1 2 3 4 5 6
1
0 10 15 20 25 30
0 5 10 15 20 25 30 35
Count
N (AFM)
1E–3
1E–4 0.01 1 10 400 450 500 550 600 650
1,000 1,200 1,400
5L 4L 2L 3L
600 800 1,000 1,200
300 350 400 450 500
3L 2L 1L
Excitation
wavelength (nm)
Excitation
wavelength (nm)
Emission wavelength (nm) Emission wavelength (nm)
PL/Ext
510nm
(a.u.)
PL width (eV)
PL position (eV)
PL/Ext
510nm
(a.u.)
0.1
Wavelength (nm) Energy (eV)
1.0 1.5 2.0
0.1
0.8 1.2 1.6
Number of layers, N Number of layers, N
1 2 3 4 5 6
Number of layers, N 5
0.1
Relative PLQY
Lit Yang Lit Zhang Lit Liu
BP-CHP Lit Yang Lit Zhang Lit Liu 1.0 1.2 1.4
Figure 4 | Photoluminescence of dispersed black phosphorous
nanosheets.(a,b) Photoluminescence emission–excitation contour maps
measured on a size-selected BP dispersion in CHP exfoliated under inert gas conditions (see Methods) measured with a 550 nm and 830 nm cut-off filter in emission, respectively. (c) Photoluminescence line spectrum (wavelength,lexc¼510 nm) for this BP dispersion in CHP. Also shown is the extinction spectrum for this dispersion as dashed line. (d) PL line spectrum, plotted versus photon energy, fitted to five Gaussian lines, representing the PL contributions from 1-, 2-, 3-, 4- and 5-layer nanosheets. (e,f) Position (e) and width (f) of fit lines shown ind, plotted versus layer number. The dashed lines ine,fshow power law decays with exponents of
(see Supplementary Table 3). In Fig. 5c, we plot t versus ARe/(AUnReþARe), extracted from Fig. 5a,b). This plot clearly shows FL-BP exfoliated in dry, deoxygenated CHP to be most stable, followed by NMP and CHP dispersions exfoliated in ambient conditions with ambient IPA dispersions being the least stable among the organic solvents. In addition, we have exfoliated BP in an aqueous surfactant solution with sodium cholate (NaC) as stabilizer (Supplementary Figs 23 and 28). The BP in the aqueous environment degrades most rapidly, although still with considerably longer time constants than micromechanically cleaved BP. This suggests the surfactant shell to offer partial protection, as with carbon nanotubes48.
These results cannot solely be explained by residual water content of these solvents (Supplementary Fig. 22) so we suggest that the solvation shell of CHP does indeed protect the nanosheets from water and/or oxygen. This is consistent with recent computational studies which show NMP, CHP and IPA to form tightly packed solvation shells adjacent to BP surfaces. The same study showed the molecular ordering within the solvation shell to vary from solvent to solvent, perhaps explaining the observed solvent-dependent stability49.
We note that to stably exfoliate and suspend BP, a solvent must fulfil two criteria: it must have the correct surface energy50 to facilitate exfoliation and avoid reaggregation, and it must form a solvation shell which acts as a barrier to oxygen/water. Compared with most 2D materials, where only the first criterion is important, this implies that relatively few solvents will be successful at both exfoliating and protecting BP. Indeed we have only had success using CHP, NMP and to a lesser extent IPA. While others have used DMF, ethanol and other solvents to suspend FL-BP30,31, the in-solvent stability has generally not been studied making it impossible to assess whether they meet the second criterion. It is clear that more work is needed to expand the list of solvents that can both suspend and protect BP.
However, such protection is clearly not perfect as we see some reactivity in all samples. To characterize this, we have added water (which also contains dissolved O2) to dispersions of S-BP, std-BP and L-BP in CHP. Addition of water/O2 significantly increases the reactivity (Fig. 5d, see Supplementary Table 4 and Supplementary Fig. 23) with t falling dramatically with added water content (Fig. 5e). In addition,ARe/(AUnReþARe) increases linearly with water contents up toB10 vol% water, above which it saturates (Fig. 5e inset). PlottingtversusARe/(AUnReþARe) for the water addition samples shows a steady deterioration of stability as water is added (Fig. 5f).
0 100 200 300 400 0.4
0.5 0.6 0.7 0.8 0.9 1.0
CHP std-BP IPA std-BP NMP std-BP CHP GB
0 100 200 300
0 100 200 300
3% water
CHP std-BP
12.5% water 100
200 300 400 500
50
CHP std-BP CHP S-BP CHP L-BP CHP GB
NaC/H2O std-BP NMP std-BP IPA std-BP
10 100 600
CHP std-BNP/H2O CHP S-BP/H2O
0 20 40 60
0 100 200 300 400
–0.6 –0.4 0.0 0.2 0.4
350 400 450 Fresh 4 days 11 days
1 10 100
0.0 0.5 1.0
(%) Linear
Fresh 11 days
Fresh 1 day
4 days 11 days
Fresh 16 days 1.0
0.9
0.8
0.7
Absorbance (a.u.)
Absorbance (a.u.)
Time (h)
1.0
0.8
0.6
0.4
0.2
0.0
Absorbance (a.u.)
Time (h)
ARe/(ARe+AUnRe)
ARe
/(
ARe
+
AUnRe
)
0.1 1
(h)
(h)
(h)
1 0.1
ARe/(ARe+AUnRe)
Volume fraction water (%)
Δ
w/w
0
0.6
0.4
0.2
0.0
–0.2
–0.4
–0.6
–0.2 0.6
ΔL/L0
Raman shift (cm–1)
Intensity
CHP GB CHP std-BP CHP S-BP CHP L-BP
CHP L-BP/H2O CHP std-BP CHP S-BP CHP L-BP
[image:6.595.45.289.194.734.2]Time (h)
Figure 5 | Stability of exfoliated black phosphorous nanosheets. (a,b) Relative absorbance at 465 nm, measured as a function of time, for (a) the standard FL-BP dispersion (std-BP) exfoliated in CHP, NMP and IPA, as well as BP exfoliated in CHP in a glovebox (CHP GB) and (b) std-BP in CHP compared with size-selected dispersions containing small (S-BP) and large nanosheets (L-BP). The dashed lines represent exponential decays: A¼AUnReþAReet/t, whereARerepresents the component of BP, which reacts with water/O2,AUnRerepresents the unreacted component andt represents the reaction timescale. (c) Reaction timescale,t, plotted versus the fraction of BP which reacts,ARe/AUnReþARe, for a number of different systems. (d) Fitted time-dependent absorbance (465 nm) data for std-BP in CHP and std-BP dispersions with 3 vol% and 12.5 vol% of water added. (e) Plot oftversus volume fraction of added water. The inset shows the fraction of unstable BP plotted versus water content. The dashed line demonstrates this fraction to scale initially linearly with water content. (f) Plot oftversusARe/AUnReþARefor BP exfoliated in CHP with and without the addition of water. (g) Sequence of AFM images of the same sample region of an as-prepared sample, and after 1, 4 and 11 days of exposure to ambient conditions, respectively (scale bar, 600 nm). Errors in c,e,fare statistical errors associated with the fits. (h) Map showing both fractional length,L, and width,w, changes as measured by AFM immediately after exfoliation after day 4. Negative values ofDw/w0and DL/L0indicate that the nanosheets are getting smaller over time. (i) Mean Raman spectra (633 nm excitation) summed over the same sample region of an as-prepared sample, after 4 days and 11 days, respectively. Spectra are normalized to the silicon peak at 521 cm1. Inset: Raman A1
Furthermore, we investigated the degradation of liquid-exfoliated FL-BP after deposition onto substrates using AFM, Raman and TEM. In these experiments, we monitored the same sample region (that is, the same nanosheets) with AFM and Raman immediately after deposition until 11 days later. As shown by the AFM images in Fig. 5g (and Supplementary Figs 24–26), we observe broadening and blurring (that is, loss of fine structure) of the nanosheets. This is typically accompanied with shrinking of nanosheet length, L and width, w (Fig. 5h, Supplementary Fig. 27). In some cases, we observe an increased apparent height which is typically accompanied with an increased contrast in the phase images (Supplementary Figs 25,26), attributed to the adsorption of water. However, it is important to note, that even after 11 days of ageing under ambient conditions, the CHP-exfoliated FL-BP is clearly still intact, as the average Raman spectra (normalized to Si) of the same sample region show no spectral changes, especially with respect to Ag1/Ag2 (Fig. 5i and Supplementary Fig. 28). These data imply that the overall structure of the FL-BP nanosheets does not change with time, consistent with degradation occurring at nanosheet edges rather than the basal plane. This is further confirmed by XPS (Supplementary Fig. 29) and TEM analysis where we tracked the same nanosheets over time (Fig. 3j and Supplementary Fig. 30). While the flakes look disrupted and, as with AFM, blurred out at the edges, most of the nanosheets remain intact even after 16 days. It is important to emphasize that we clearly observe degradation when using a less favourable, low boiling point solvent such as IPA (Supplementary Fig. 31). Taken together this suggests that solvents such as CHP protect the nanosheets from degrading at the basal plane with the solvation shell remaining even after the bulk solvent has been removed. Importantly, it also shows that degradation starts at the edges. This implies that the structure of the solvation shell is different at the nanosheet edges in a way that makes water/O2ingress at the edges much more likely than at the basal plane. This preferential edge degradation has important implications for future applica-tions of BP. Edge degradation leaves the basal plane intact and should not greatly affect the properties of the BP nanosheets other than their size. This makes the environmental instability of BP less problematic for applications than might previously have been thought.
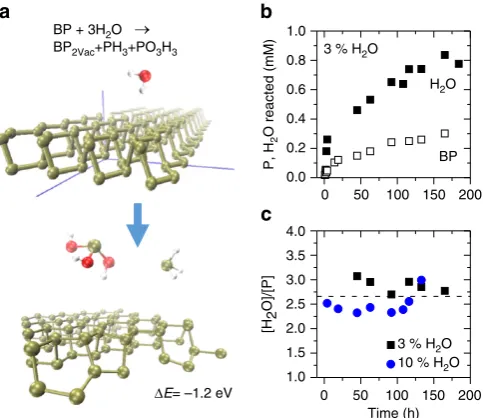
Reaction mechanism. If the basal plane is protected by solvent such that the dominant reaction pathway in liquid-exfoliated nanosheets occurs at the edges, then the reaction mechanism may differ to that proposed by Martel and co-workers32 Here we suggest an alternative pathway involving nanosheet edges, which is supported by density functional theory calculations (see also Supplementary Note 2). Since we experimentally observe a drop in pH with time after water addition and the formation of phosphorous and/or phosphoric acid (XPS), we propose the following acid–base disproportionation reaction involving nanosheet edges (Fig. 6a), which may become dominant when basal plane reactions are suppressed:
BPþ3H2O!BP2VACþPH3þH3PO3 ð1Þ This reaction was evaluated for both edge sites and basal plane P atoms. In both cases, a defective structure BP2VAC, with two P vacancies in the BP supercell is formed (2.5% vacancy concentration, Supplementary Figs 32 and 33). The reaction energy of process (1) is evaluated as
DE¼½EðBPÞ þ3EðH2OÞ ½EðBP2VACÞ þEðPH3Þ þEðH3PO3Þ ð2Þ where [E(BP)þ3E(H2O)] is the energy of the nanosheet and three isolated water molecules at infinite distance from the nanosheet and [E(BP2VAC)þE(PH3)þE(H3PO3)] is the energy
of the defective nanosheet infinitely distant from the other isolated reaction products. This reaction is exothermic (DE¼ 1.2 eV, see Fig. 6) when the process occurs at the edge but endothermic (DE¼0.26 eV) when occurring far from the edge (see Supplementary Figs 34 and 35). In either case, degradation is a multistep process. Since we are interested in whether a reaction starts at the edge or the basal plane, we have analysed the early steps in the reaction (approach of H2O and splitting of H2O to hydroxyl group and H atoms chemisorbed to neighbouring P). In both edge and basal plane cases, the water adsorption is slightly exothermic, while the splitting of the water is highly unfavourable on the basal plane (Supplementary Fig. 34). We have furthermore ruled out that the disproportiona-tion reacdisproportiona-tion could proceed in the middle of BP nanosheet if activated by the formation of the first hole by studying the degradation process starting from a defective structure BP2VAC (Supplementary Fig. 36). The reaction is again endothermic by
BDE¼0.26 eV further supporting that the reaction is unlikely to occur on the basal plane.
These calculations show that BP can react with water, even in the absence of oxygen, to remove P atoms from the nanosheet edge although this reaction may only be important when basal plane reactions32 are suppressed. To test the validity of the proposed reaction, we attempted to experimentally determine the stoichiometric ratio of reacted BP and water. After addition of water to a BP dispersion, the consumption of both water and BP can be tracked by ultraviolet–visible spectroscopy (see Supplementary Figs 37 and 38, Supplementary Note 3). Knowing the extinction coefficients of both components, this data can be converted to the concentration of reacted BP and water, 0 50 100 150 200
BP
0 50 100 150 200 Time (h) BP + 3H2O
BP2Vac+PH3+PO3H3
ΔE= –1.2 eV
1.0
0.8
0.6
0.4
0.2
0.0
P, H
2
O reacted (mM)
3 % H2O
3 % H2O 10 % H2O
H2O
4.0
3.5
3.0
2.5
2.0
1.5
1.0
[H
2
[image:7.595.307.549.49.258.2]O]/[P]
respectively (Supplementary Fig. 37). The reacted concentration as a function of time for both BP and water is shown in Fig. 6b (using the CHP GB dispersion after addition of 3 vol% of water). It is clear that two to three water molecules are consumed for every P atom. As shown in Fig. 6c, a similar stoichiometry ratio is obtained when analysing a dispersion where initially 10 vol% of water was added. The thus experimentally determined H2O/P ratio of two to three agrees well with the proposed edge reaction.
However, it can unfortunately not distinguish between the proposed edge disproportionation reaction and the reported basal plane oxidation32.
Applications. For liquid-exfoliated FL-BP, the degradation timescale is slow enough to allow processing of nanosheets for applications testing in a number of areas. We believe that if applications potential is demonstrated, practical usage of FL-BP will be enabled by encapsulation7,24. In this work we have chosen three applications, which have not previously been described to demonstrate the broad potential of FL-BP.
Theoretical work has suggested FL-BP nanosheets as gas sensors18. We prepared thin films of FL-BL nanosheets by vacuum filtration followed by transfer to interdigitated electrode arrays. Two-probe measurements showed relatively high conductivities of B1 S m1, similar to films of WTe2 nanosheets51. Shown in Fig. 7a (and Supplementary Fig. 39) is the resistance change of a thin film of FL-BP nanosheets on exposure to ammonia (NH3) gas. We observe a resistance increase, consistent with NH3 donating electrons to the p-type FL-BP. By extrapolation of the signal-to-noise level (Fig. 7b), and assuming the minimum detectable signal to be three times the root mean square noise level, we estimate a detection threshold of 80 p.p.b. This shows FL-BP networks to be competitive with other nano-sensors52–54 and a very promising material for gas detection.
The nonlinear optical response of the FL-BP dispersions was investigated by open-aperture Z-scan using a 340-fs pulsed fibre laser55. In Fig. 7c,d, it is clearly seen that normalized transmission of the FL-BP dispersions increases with laser intensity at both 1,030 and 515 nm. Such broadband saturable absorption (SA) suggests that the FL-BP nanosheets could serve as an ultrafast nonlinear saturable absorber, an essential mode-locking element for ultrashort pulsed lasers56,57. Since graphene is a well-known broadband saturable absorber58, we carried out the same nonlinear measurement for graphene dispersions prepared by the similar liquid exfoliation. At the same level of linear transmission, the FL-BP dispersions exhibit much stronger SA response than the graphene dispersions at both wavelengths. The saturable intensity Isis obtained by fitting the Z-scan data with the SA model dI/dz¼ aI, where a¼a0/(1þI/ISat): a0 is the linear absorption coefficient andIis the excitation intensity. As shown in Fig. 7e, ISat of FL-BP is much lower than that of
0.7 0.9
1,030 nm BP Graphene 515 nm
Graphene BP
10 100 600
1.00 1.05 1.10 1.15 1.20
BP, T0=81.2% Graphene, T0=82.3%
1,030 nm
1 10 100
1.00 1.05 1.10 1.15 1.20
Graphene, T0=80.5% BP, T0=79.9%
515 nm 0 30 60 90 120
0 5 10 15
0.2 10
15 20 25
Strength (M
Pa)
0 40 80 120
0 5 10 15 20 25
Stress (M
Pa)
PVC
0.2 0
5 10 15
0 4
0 10 20
1 2 3
0 10 20 30 40
Signal/noise
–50 50 100 –150
–100 –50 0 50 100 150
ν
<YBP>
YBP
–100 0
Y (GPa), v (%) : Armchair BP vol fraction (%)
0.4 0.0
Y(GaP),
v
(%): zigzag
T (MJ m
–3)
1.0
0.8
0.6
0.4
Y (GPa)
0.0 0.4
0.2
0.0 0.4
BP vol fraction (%) BP vol fraction (%)
Strain (%) Linear transmission, T0
0.6 0.8
Isat
(TW cm
–2)
1.0
0.8
0.6
0.4
0.2
0.0
Normalized
T
Normalised T
I (GW cm–2) I (GW cm–2)
PVC/BP (0.3vol%)
2 Time (min) NH3 (p.p.m.)
Δ
R
/
R0
[image:8.595.49.289.162.736.2](%)
Figure 7 | Applications of liquid-exfoliated FL-BP.(a,b) Sensing of NH3
graphene at both 1,030 and 515 nm when the linear transmission is equal. The significant ultrafast nonlinear property of FL-BP implies a huge potential in the development of nanophotonic devices, such as mode-lockers, Q-switchers, optical switches and so on59.
The impressive mechanical properties of 2D materials in general60 suggest the potential to use FL-BP as a reinforcing filler in composites. Shown in Fig. 7f are the representative stress–strain curves for a film of polyvinylchloride (PVC) and a PVC:FL-BP (0.3 vol%, see methods and Supplementary Figs 40 and 41). It is clear that the mechanical properties improve considerably both in the high and low strain regimes. Shown in Fig. 7g-i are the composite modulus, strength and tensile toughness, plotted as a function of BP loading content. In each case, mechanical properties increase considerably for loading levels of only 0.3 vol%. The modulus, Y, increases from 500 MPa for PVC to 900 MPa for the 0.3 vol% composite. In addition, at 0.3-vol% loading, the measured strength of the composite doubles while its tensile toughness displays a sixfold increase. These are significant increases and are competitive with those found using graphene as a filler in both PVC61 and polymers in general62.
We used first-principles simulations (see Supplementary Note 4) to obtain the bulk BP Young’s modulus as a function of orientation in the plane of the crystal as shown in Fig. 7j, yielding a Voigt–Reuss–Hill in-plane average modulus of
hYBPi ¼97 GPa. We also calculated the Poisson’s ratio finding it to be highly anisotropic. Assuming the BP nanosheets lie in-plane63, we can use the calculatedhYBPi, coupled with the rule of mixtures62to predict the composite modulus as a function of BP volume fraction,Vf:Ycomp¼ hYBPiVfþYpoly(1Vf). We find this prediction (blue line) to agree well with the experimental data even though we have not corrected for the finite aspect ratio of the nanosheets or their layered nature.
Discussion
In conclusion, we have shown that the BP crystals can be efficiently exfoliated in appropriate solvents to yield high-quality, few-layered nanosheets with controllable size, which can be used for fundamental measurements such as PL studies. Compared with mechanically cleaved nanosheets, liquid-exfoliated FL-BP is remarkably stable in CHP, probably due to protection by the solvation shell. However, addition of water results in degradation of the nanosheets. Both experimental and computational studies indicate the degradation to occur at the nanosheet edge with no basal plane damage and proceed by reaction of the FL-BP with water. Based on this, we propose an alternative BP degradation reaction, which can occur when basal plane reactions are supressed. Importantly, this means that the net result of degradation is reduction on nanosheet size rather than alteration of flake properties. We demonstrate that liquid-exfoliated FL-BP nanosheets have potential for use in applications as gas sensors, saturable absorbers and reinforcing fillers for composites. We believe this work is important as it will facilitate the large-scale production of FL-BP. Such a goal is realizable in practise because, even when produced in ambient conditions, CHP-exfoliated FL-BP is stable for B200 h (cf, B1 h for mechanically cleaved BP). We believe these advances will facilitate its development in a broad range of applications.
Methods
Sample preparation.BP crystals were purchased from Smart Elements (purity
99.998%) with all other materials sourced from Sigma Aldrich (all used as received). BP was lightly ground with pestle and mortar and immersed in CHP (concentration 2 g l1). The dispersion was sonicated for 5 h at 60% amplitude
with a horn-probe sonic tip (VibraCell CVX, 750W) under cooling, yielding a stock
dispersion. Aliquots of the stock dispersion were centrifuged at 1,000 r.p.m. (106g) for time periods varying from 5 to 240 min in a Hettich Mikro 220R centrifuge equipped with a fixed-angle rotor 1016. The supernatant was decanted and sub-jected to absorbance spectroscopy. The supernatant with centrifugation conditions 1,000 r.p.m. for 180 min was denoted std-BP. The std-BP was subsequently sepa-rated into small and large stable nanosheets. For this purpose, aliquots of std-BP dispersion were subjected to an additional centrifugation of 5 kr.p.m. (2,660g) for 120 min. The supernatant (containing small flakes) was decanted and characterized as S-BP, while the sediment (containing large flakes) was redispersed in fresh CHP and characterized as L-BP. Alternatively, the FL-BP was size-selected by controlled centrifugation with subsequently increasing rotation speeds. The sediment after 2 kr.p.m. (426g, 2 h) was discarded, while the supernatant was subjected to further centrifugation at 3 kr.p.m. (958g, 2 h). The sediment was collected in fresh solvent, while the supernatant was subjected to further centrifugation at 4 kr.p.m. (1,702g, 2 h). Again, the sediment was collected and the supernatant was centrifuged at high r.p.m. This procedure was repeated for 5 kr.p.m. (2,660g, 2 h), 10 kr.p.m. (10,170g, 2 h) and 16 kr.p.m. (25,000g, 2 h) to yield samples with decreasing sizes in the respective sediments. For part of the degradation studies and PL measurement, BP was exfoliated under inert conditions by sonication in an argon-filled glovebox (O2o0.1 p.p.m.; H2Oo0.1 p.p.m.) in pump-freeze deoxygenated and dry CHP with a water content of 29 p.p.m. (0.5 g l1BP, 15 ml CHP, tapered tip Bandelin Sonoplus 3100, 25% amplitude, 2 h, pulse 2 s on, 2 s off). The resultant dispersions were transferred into centrifugation vials, which were sealed and centrifuged for 3 h at 100gto obtain the std-BP GB sample. To increase the population of few-layered species for the PL measurement, this std-BP GB sample was centrifuged for 16 h at 25g. The sediment was discarded and the supernatant centrifuged again at 710gfor 180 min. The PL spectra shown in the main manuscript were acquired from the supernatant of this centrifugation after dilution to an optical density of 0.4 cm1. All solvent transfer was carried out in the glovebox.
Characterization.Optical extinction and absorbance were measured on a Perkin
Elmer 650 spectrometer in quartz cuvettes. To distinguish between contributions from scattering and absorbance to the extinction spectra, dispersions were mea-sured in an integrating sphere using a home-built sample holder to place the cuvette in the centre of the sphere. The absorbance spectrum is obtained from the measurement inside the sphere. A second measurement on each dispersion was performed outside the sphere to obtain the extinction spectrum. This allows for the calculation of the scattering spectrum (extinction absorbance). The experiments to track both water and BP degradations were performed on a Perkin Elmer Lambda 1050 spectrometer in extinction.
Bright-field TEM imaging was performed using a JEOL 2100, operated at 200 kV, while HRTEM was conducted on a FEI Titan TEM (300 kV). High resolution TEM images (Fig. 5f) were taken using an FEI Titan 60–300 Ultimate Microscope operated at 300 kV. The FL-BP was dropped on grids using a drop casting method and excess fluid was absorbed by an underlying filter membrane. It was then baked in vacuum at 120°C for several hours. The samples were imaged on the day they were received which is termed Day 1. The same flake was then imaged on Day 3 and 16. No changes in nanosheet structure of morphology were observed between Day 1 and Day 3, but by Day 16 a combination of reaction products and water adsorption results in a liquid layer on the flake. This layer can be removed with the beam, and comparison of the shape of the flakes between Day 1 and Day 16 shows that the overall shape and size of the flake has not changed. There is also lattice apparent in the flake on Day 16 when using a high magnification (300k).
Aberration-corrected STEM images were taken using a Nion Ultrasteme 100 (cold filed emission gun at the SuperSTEM Laboratory in Daresbury, UK. The suspended FL-BP flakes were dropped onto lacey carbon-coated copper TEM grids as before. The samples were then prebaked at 120°C in a vacuum overnight. The images were recorded using a 100 kV acceleration voltage with a HAADF field detector and low-pass bright-field imaging. Figure 1f shows a representative Butterworth-filtered HAADF STEM image and Figure 1g shows a low-by-pass bright-field STEM image of the material. The lattice shows high uniformity with the presence of very few defects or dislocations. Depending on the zone axis used, the lattice can exhibit a ‘dumbbell’-type configuration.
AFM was carried out on a Veeco Nanoscope-IIIa (Digital Instruments) system equipped with an E-head (13mm scanner) in tapping mode after depositing a drop of the dispersion transferred to IPA on a pre-heated (150°C) Si/SiO2wafer with an oxide layer of 300 nm. Raman spectroscopy on individual flakes was performed using a Horiba Jobin Yvon LabRAM HR800 with 633 nm excitation laser in air under ambient conditions. XPS was performed under ultra-high vacuum conditions (o51010mbar), using monochromated Al KaX-rays (1,486.6 eV) from an Omicron XM1000 MkII X-ray source and an Omicron EA125 energy analyser. An Omicron CN10 electron flood gun was used for charge compensation and the binding energy scale was referenced to the adventitious carbon 1s core level at 284.8 eV. Core-level regions were recorded at an analyser pass energy of 15 eV and with slit widths of 6 mm (entry) and 3 mm10 mm (exit), resulting in an instrumental resolution of 0.48 eV. After subtraction of a Shirley background, the core-level spectra were fitted with Gaussian–Lorentzian line shapes using the Marquardt’s algorithm.
detector (Symphony iHR 320). Spectra were obtained at 5°C using appropriate cutoff filters (see Supplementary Figs 17–19).
Modelling.The QuantumEspresso package was used to evaluate the reaction
energies. In this case, we selected an energy cutoff of 50 Ryd, a grid of 221 Monchorst–Pack k-points (see Supplementary Note 2) and ultrasoft pseudopo-tentials. Langreth and Lundqvist van der Waals-corrected exchange and correlation functional64was used and atomic forces were relaxed until they were
o5103eV A1.
We also calculated bulk and in-plane mechanical properties of BP (see Supplementary Note 4 and Supplementary Tables 5–7) to clarify the microscopic origins of an observed dramatic increase in the Young’s modulus of composites reinforced with BP nanosheets. In this case, the PBE functional, augmented with the empirical dispersion correction of the B97-D functional65was used to compute
the elastic constants of bulk phosphorus by finite-difference, the nanosheets in question being closer to the bulk than monolayer regime. The Voigt–Reuss–Hill approach,66was used to estimate both isotropic (found to be comparable to current
literature67) and nanosheet in-plane-only estimates of the average nanosheet
Young’s modulus, as well as upper (Voigt) and lower (Reuss) expected error bounds.
Applications.For nonlinear optical measurements, an open-aperture Z-scan
system was used to study the ultrafast nonlinear optical properties of the FL-BP (std-BP) and graphene dispersions. This measures the total transmittance through a sample as a function of incident laser intensity, while the sample is sequentially moved through the focus of a lens (along thez-axis)55,57. All experiments were
performed with 340-fs pulses from a mode-locked fibre laser, which was operated at 1,030 nm and its second harmonic, 515 nm, with a pulse repetition rate of 1 kHz. All dispersion samples were tested in quartz cuvettes with 1-mm pathlength.
Gas sensing was conducted on the FL-BP (std-BP) prepared in CHP and then subsequently transferred into 2-proponal by centrifugation as conducted for the AFM measurements to facilitate filtration onto a nitrocellulose membrane. Following filtration, the film was allowed to dry under vacuum conditions. The FL-BP film was cut into 102-mm rectangular pieces. These were then transferred onto silicon dioxide wafer, while the nitrocellulose membrane was dissolved using the transfer method according to the study by Wuet al.68
For gas sensing, gold electrodes were sputtered on top of an adhesion layer of nickel (Ni/Au¼30/70 nm) using a metal shadow mask, which has a 2-mm-wide and 200-mm-long channel. All devices were loaded in a gas-sensing chamber and annealed at 100°C for 1 h to remove residues and adsorbates on the surface. The gas-sensing chamber was kept at room temperature at a pressure of 10 Torr, with a 100 s.c.c.m. flow of the NH3and N2mixtures. The resistance change of five devices on interval gas exposure was simultaneously measured using a Keithley model 2612A SourceMeter and a Keithley 3706 System Switch at a constant bias voltage of 1 V. The initial resistance and root mean square noise were calculated from the first 500 data points,B2 min before the first gas injection. NH3for 2 min and pure N2 for 5 min were periodically introduced to record sensor response and recover, respectively.
A previously prepared nanofiller FL-BP dispersion in CHP, centrifuged between 1 kr.p.m. for 180 min and 3 kr.p.m. for 120 min and redispersed in fresh CHP solvent, was subsequently filtered onto a Polyester Membrane Filter (0.2mm) of known mass. The membrane was dried in a vacuum oven at 100°C for 2 h and the mass of the membrane was remeasured to attain the mass of the filtered nanofiller. The nanofiller was redispersed by bath sonication (Branson 1510 Model 45 kHz) in a 65:35 tetrahydrofuran (THF), chloroform solvent mixture. PVC was dissolved in a solvent mixture (65:35 THF/chloroform). A range of FL-BP/PVC/THF/ Chloroform dispersions (from 0 to 0.0074 volume fraction) were made by adding the FL-BP/THF/Chloroform filler solution to the PVC/THF/Chloroform solution with varying increments of loading. These solutions were of constant mass (150 mg of FL-BP and polymer) and constant volume (5 ml of FL-BP, polymer and solvent). These samples were sonicated in the same bath as before for 1 h to homogenize after the blending of the solutions. The homogenized solution mixtures were then dropcast into 551 cm Teflon trays and placed in a vacuum oven for 4 h at 40°C under no vacuum to form composite films. The films were then kept overnight (B17 h) at 50°C under full vacuum to ensure that the solvent was completely removed and to protect the filler material from decomposition before testing. For mechanical measurements, the films were cut into 2.25-mm strips and then tested on a Zwick Roell tensile tester with a 100 N load cell at a strain rate of 10 mm min1.
References
1. Geim, A. K. Graphene: status and prospects.Science324,1530–1534 (2009). 2. Novoselov, K. S.et al.A roadmap for graphene.Nature490,192–200 (2012). 3. Ferrari, A. C.et al.Science and technology roadmap for graphene, related
two-dimensional crystals, and hybrid systems.Nanoscale7,4598–4810 (2015). 4. Chhowalla, M.et al.The chemistry of two-dimensional layered transition metal
dichalcogenide nanosheets.Nat. Chem.5,263–275 (2013). 5. Osada, M. & Sasaki, T. Exfoliated oxide nanosheets: new solution to
nanoelectronics.J. Mater. Chem.19,2503–2511 (2009).
6. Wang, Q. H., Kalantar-Zadeh, K., Kis, A., Coleman, J. N. & Strano, M. S. Electronics and optoelectronics of two-dimensional transition metal dichalcogenides.Nat. Nanotechnol.7,699–712 (2012).
7. Wood, J. D.et al.Effective passivation of exfoliated black phosphorus transistors against ambient degradation.Nano Lett.14,6964–6970 (2014). 8. Castellanos-Gomez, A.et al.Isolation and characterization of few-layer black
phosphorus.2D Materials1,025001 (2014).
9. Buscema, M., Groenendijk, D. J., Steele, G. A., van der Zant, H. S. J. & Castellanos-Gomez, A. Photovoltaic effect in few-layer black phosphorus PN junctions defined by local electrostatic gating.Nat. Commun.5,4651 (2014). 10. Qiao, J., Kong, X., Hu, Z.-X., Yang, F. & Ji, W. High-mobility transport
anisotropy and linear dichroism in few-layer black phosphorus.Nat. Commun. 5,4475 (2014).
11. Xia, F., Wang, H. & Jia, Y. Rediscovering black phosphorus as an anisotropic layered material for optoelectronics and electronics.Nat. Commun.5,4458 (2014).
12. Li, L.et al.Black phosphorus field-effect transistors.Nat. Nanotechnol.9,
372–377 (2014).
13. Zhang, S.et al.Extraordinary photoluminescence and strong temperature/ angle-dependent Raman responses in few-layer phosphorene.ACS Nano8,
9590–9596 (2014).
14. Cai, Y., Zhang, G. & Zhang, Y.-W. Layer-dependent band alignment and work function of few-layer phosphorene.Sci. Rep.4,6677 (2014).
15. Buscema, M.et al.Fast and broadband photoresponse of few-layer black phosphorus field-effect transistors.Nano Lett.14,3347–3352 (2014). 16. Hong, T.et al.Polarized photocurrent response in black phosphorus field-effect
transistors.Nanoscale6,8978–8983 (2014).
17. Sun, J.et al.Formation of stable phosphorus–carbon bond for enhanced performance in black phosphorus nanoparticle–graphite composite battery anodes.Nano Lett.14,4573–4580 (2014).
18. Kou, L., Frauenheim, T. & Chen, C. Phosphorene as a superior gas sensor: selective adsorption and distinct I–V response.J. Phys. Chem. Lett.5,
2675–2681 (2014).
19. Fei, R.et al.Enhanced thermoelectric efficiency via orthogonal electrical and thermal conductances in phosphorene.Nano Lett.14,6393–6399 (2014). 20. Du, W., Jiang, X. & Zhu, L. From graphite to graphene: direct liquid-phase
exfoliation of graphite to produce single- and few-layered pristine graphene.
J. Mater. Chem. C1,10592–10606 (2013).
21. Nicolosi, V., Chhowalla, M., Kanatzidis, M. G., Strano, M. S. & Coleman, J. N. Liquid exfoliation of layered materials.Science340,1226419 (2013). 22. Coleman, J. N.et al.Two-dimensional nanosheets produced by liquid
exfoliation of layered materials.Science331,568–571 (2011). 23. Hernandez, Y.et al.High-yield production of graphene by liquid-phase
exfoliation of graphite.Nat. Nanotechnol.3,563–568 (2008).
24. Paton, K. R.et al.Scalable production of large quantities of defect-free few-layer graphene by shear exfoliation in liquids.Nat. Mater.13,624–630 (2014). 25. Varrla, E.et al.Turbulence-assisted shear exfoliation of graphene using
household detergent and a kitchen blender.Nanoscale6,11810–11819 (2014). 26. Hanlon, D.et al.Production of molybdenum trioxide nanosheets by liquid
exfoliation and their application in high-performance supercapacitors.Chem.
Mater.26,1751–1763 (2014).
27. Zhi, C. Y., Bando, Y., Tang, C. C., Kuwahara, H. & Golberg, D. Large-scale fabrication of boron nitride nanosheets and their utilization in polymeric composites with improved thermal and mechanical properties.Adv. Mater.21,
2889–2893 (2009).
28. Green, A. A. & Hersam, M. C. Solution phase production of graphene with controlled thickness via density differentiation.Nano Lett.9,4031–4036 (2009). 29. Brent, J. R.et al.Production of few-layer phosphorene by liquid exfoliation of
black phosphorus.Chem. Commun.50,13338–13341 (2014).
30. Yasaei, P.et al.High-quality black phosphorus atomic layers by liquid-phase exfoliation.Adv. Mater.27,1887–1892 (2015).
31. Kang, J.et al.Solvent exfoliation of electronic-grade, two-dimensional black phosphorus.ACS Nano9,3596–3604 (2015).
32. Favron, A.et al.Photooxidation and quantum confinement effects in exfoliated black phosphorus.Nat. Mater.14,826–832 (2015).
33. Backes, C.et al.Edge and confinement effects allow in situ measurement of size and thickness of liquid-exfoliated nanosheets.Nat. Commun.5,4576 (2014).
34. O’Neill, A., Khan, U. & Coleman, J. N. Preparation of high concentration dispersions of exfoliated mos2 with increased flake size.Chem. Mater.24,
2414–2421 (2012).
35. Yadgarov, L.et al.Dependence of the absorption and optical surface plasmon scattering of mos2 nanoparticles on aspect ratio, size, and media.ACS Nano8,
3575–3583 (2014).
36. Khan, U., O’Neill, A., Lotya, M., De, S. & Coleman, J. N. High-concentration solvent exfoliation of graphene.Small6,864–871 (2010).
38. Ridings, C., Warr, G. G. & Andersson, G. G. Composition of the outermost layer and concentration depth profiles of ammonium nitrate ionic liquid surfaces.Phys. Chem. Chem. Phys.14,16088–16095 (2012).
39. Nemes-Incze, P., Osva´th, Z., Kamara´s, K. & Biro´, L. P. Anomalies in thickness measurements of graphene and few layer graphite crystals by tapping mode atomic force microscopy.Carbon46,1435–1442 (2008).
40. Harvey, A.et al.Preparation of gallium sulfide nanosheets by liquid exfoliation and their application as hydrogen evolution catalysts.Chem. Mater.27,
3483–3493 (2015).
41. Khan, U.et al.Size selection of dispersed, exfoliated graphene flakes by controlled centrifugation.Carbon50,470–475 (2012).
42. May, P., Khan, U., O’Neill, A. & Coleman, J. N. Approaching the theoretical limit for reinforcing polymers with graphene.J. Mater. Chem.22,1278–1282 (2012).
43. Jaramillo, T. F.et al.Identification of active edge sites for electrochemical H-2 evolution from MoS2 nanocatalysts.Science317,100–102 (2007).
44. Ramasubramaniam, A. & Muniz, A. R.Ab initiostudies of thermodynamic and electronic properties of phosphorene nanoribbons.Phys. Rev. B.90,085424 (2014).
45. Liu, H.et al.Phosphorene: an unexplored 2D semiconductor with a high hole mobility.ACS Nano8,4033–4041 (2014).
46. Yang, J.et al.Unambiguous identification of monolayer phosphorene by phase-shifting interferometry. Preprint at http://arxiv.org/abs/1412.6701 (2014). 47. Han, J. H.et al.Unveiling chemical reactivity and structural transformation of
two-dimensional layered nanocrystals.J. Am. Chem. Soc.135,3736–3739 (2013). 48. O’Connell, M. J.et al.Band gap fluorescence from individual single-walled
carbon nanotubes.Science297,593–596 (2002).
49. Sresht, V., Padua, A. A. H. & Blankschtein, D. Liquid-phase exfoliation of phosphorene: design rules from molecular dynamics simulations.ACS Nano9,
8255–8268 (2015).
50. Hughes, J. M., Aherne, D. & Coleman, J. N. Generalizing solubility parameter theory to apply to one- and two-dimensional solutes and to incorporate dipolar interactions.J. Appl. Polym. Sci.127,4483–4491 (2013).
51. Cunningham, G., Hanlon, D., McEvoy, N., Duesberg, G. S. & Coleman, J. N. Large variations in both dark- and photoconductivity in nanosheet networks as nanomaterial is varied from MoS2 to WTe2.Nanoscale7,198–208 (2014). 52. Lee, K., Gatensby, R., McEvoy, N., Hallam, T. & Duesberg, G. S.
High-performance sensors based on molybdenum disulfide thin films.Adv. Mater. 25,6699–6702 (2013).
53. O’Brien, M.et al.Plasma assisted synthesis of WS2 for gas sensing applications.
Chem. Phys. Lett.615,6–10 (2014).
54. Schedin, F.et al.Detection of individual gas molecules adsorbed on graphene.
Nat. Mater.6,652–655 (2007).
55. Sheikbahae, M., Said, A. A., Wei, T. H., Hagan, D. J. & Vanstryland, E. W. Sensitive measurement of optical nonlinearities using a single beam.IEEE J.
Quant. Electron.26,760–769 (1990).
56. Blau, W. J. & Wang, J. Variety pays off for nanotubes.Nat. Nanotechnol.3,
705–706 (2008).
57. Wang, K.et al.Ultrafast saturable absorption of two-dimensional MoS2 nanosheets.ACS Nano7,9260–9267 (2013).
58. Sun, Z.et al.Graphene mode-locked ultrafast laser.ACS Nano4,803–810 (2010). 59. Bonaccorso, F., Sun, Z., Hasan, T. & Ferrari, A. C. Graphene photonics and
optoelectronics.Nat. Photonics4,611–622 (2010).
60. Ataca, C., Sahin, H. & Ciraci, S. Stable, single-layer MX2 transition-metal oxides and dichalcogenides in a honeycomb-like structure.J. Phys. Chem. C 116,8983–8999 (2012).
61. Vadukumpully, S., Paul, J., Mahanta, N. & Valiyaveettil, S. Flexible conductive graphene/poly(vinyl chloride) composite thin films with high mechanical strength and thermal stability.Carbon49,198–205 (2011).
62. Young, R. J., Kinloch, I. A., Gong, L. & Novoselov, K. S. The mechanics of graphene nanocomposites: a review.Compos. Sci. Technol72,1459–1476 (2012). 63. Khan, U.et al.Polymer reinforcement using liquid-exfoliated boron nitride
nanosheets.Nanoscale5,581–587 (2013).
64. Dion, M., Rydberg, H., Schroder, E., Langreth, D. C. & Lundqvist, B. I. Van der Waals density functional for general geometries.Phys. Rev. Lett.92,
246401 (2004).
65. Grimme, S. Semiempirical GGA-type density functional constructed with a long-range dispersion correction.J. Comput. Chem.27,1787–1799 (2006). 66. Hill, R. The elastic behaviour of a crystalline aggregate.Proc. Phys. Soc. Lond.
Sect. A65,349–355 (1952).
67. Appalakondaiah, S., Vaitheeswaran, G., Lebegue, S., Christensen, N. E. & Svane, A. Effect of van der Waals interactions on the structural and elastic properties of black phosphorus.Phys. Rev. B.86,035105 (2012).
68. Wu, Z. C.et al.Transparent, conductive carbon nanotube films.Science305,
1273–1276 (2004).
Acknowledgements
The research leading to these results has received funding from the European Union Seventh Framework Programme under grant agreement n°604391 Graphene Flagship. We have also received support from the Science Foundation Ireland (SFI) funded centre AMBER (SFI/12/RC/2278). In addition, JNC acknowledges the European Research Council (SEMANTICS) and SFI (11/PI/1087) for financial support. C.B. acknowledges the German research foundation DFG (BA 4856/1-1). E.D., A.P. and V.N. acknowledge ERC 2DNanoCaps, SFI PIYRA and FP7 MoWSeS. G.S.D., K.L., N.McE and N.C.B. acknowledge SFI for PI_10/IN.1/I3030 while W.B acknowledges an SFI Investigator Award (12/IA/1306). STEM experiments were performed at SuperSTEM, the EPSRC UK national facility for aberration-corrected STEM. J.W. and S.Z. acknowledge NSFC (61178007, 61522510 and 61308034), STCSM (12ZR1451800) and the External Coop-eration Program of BIC, CAS (No. 181231KYSB20130007). S.S. and C.S.C. have been supported by the European Research Council (Quest project). All reaction energy cal-culations were performed on the Parsons cluster (project HPC_12_0722), and all mechanical property calculations on the Lonsdale cluster, (project HPC_14_00800), maintained by the Trinity Centre for High Performance Computing. These clusters were funded through grants from Science Foundation Ireland. G.A. acknowledges the EU for a Marie Curie Fellowship (FP7/2013-IEF-627386).
Author contributions
D.H. and G.A. prepared liquid dispersions; D.H., C.B., A.H., N.McE. and G.S.D. per-formed the spectroscopy; C.B. perper-formed AFM/Raman and PL; D.H. perper-formed low-res TEM; E.D., A.P., Q.M.R. and V.N. performed hi-res TEM; C.Bo, Z.G. and P.L. prepared and tested composites; K.L. and G.S.D. tested gas sensing; C.S.C. and S.S. performed calculations on FL-BP stability; G.M., and D.D.O’R performed simulation of composite mechanical reinforcement by FL-BP loading; S.Z., K.W., W.J.B. and J.W. performed nonlinear optical measurements; G.A., A.Hi and F.H. supported the exfoliation under inert conditions; J.N.C. and C.B. planned the experiments and wrote the paper.
Additional information
Supplementary Informationaccompanies this paper at http://www.nature.com/ naturecommunications
Competing financial interests:The authors declare no competing financial interests.
Reprints and permissioninformation is available online at http://npg.nature.com/ reprintsandpermissions/
How to cite this article:Hanlon, D.et al.Liquid exfoliation of solvent-stabilized few-layer black phosphorus for applications beyond electronics.Nat. Commun.6:8563 doi: 10.1038/ncomms9563 (2015).