Is fuel poverty in Ireland a distinct type of deprivation?
Full text
Figure


Related documents
First, the context of fuel poverty and energy inefficient housing in Europe is delineated using cross-country data on energy efficiency standards and energy consumption in
Estimates based on the most recent data (for 2005) indicate that almost 16% or 229,000 households were vulnerable to fuel poverty in Ireland, on the basis that they paid more than
W e have seen in Chapter 5 that the “consistent” poverty measure, measured as the percentage falling below the 60 per cent relative income line and experiencing basic deprivation
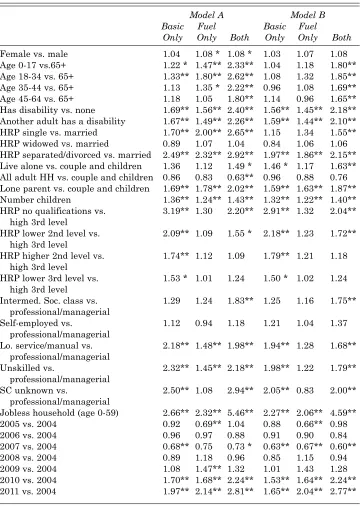
of household, household type, household size (number of children and number of.. adults), income poverty, basic deprivation, consistent income poverty, social risk.. group (both
From Table 3.14 it is evident that, for both income poverty lines, there is a clear continuum relating to secondary deprivation running from consistently non-poor on both indices
The formation of an Inter-Departmental Group on Fuel Poverty in Northern Ireland, led by the Department for Social Development and aligned to the governments Fuel Poverty Strategy is
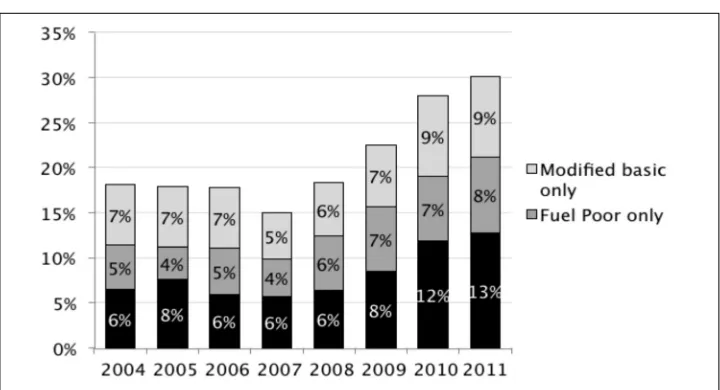
Basic deprivation fell from 15% in 2005 to 12% in 2007, but increased sharply to reach 31% in 2013. Poverty and deprivation rates stabilised in 2014. This upward trend
of household, household type, household size (number of children and number of.. adults), income poverty, basic deprivation, consistent income poverty, social risk.. group (both
