Proceedings of the Third Conference on Machine Translation (WMT), Volume 2: Shared Task Papers, pages 765–769
RTM results for Predicting Translation Performance
Ergun Bic¸ici
Department of Computer Engineering, Bo˘gazic¸i University orcid.org/0000-0002-2293-2031
bicici.github.com
Abstract
With improved prediction combination using weights based on their training performance and stacking and multilayer perceptrons to build deeper prediction models, RTMs become the 3rd system in general at the sentence-level prediction of translation scores and achieve the lowest RMSE in English to German NMT QET results. For the document-level task, we compare document-level RTM models with sentence-level RTM models obtained with the concatenation of document sentences and ob-tain similar results.
1 Introduction
Quality estimation task in WMT18 (Specia et al.,
2018) (QET18) address machine translation per-formance prediction (MTPP), where translation quality is predicted without using reference trans-lations, at the sentence- (Task 1), word- (Task 2), phrase-level (Task 3), and document-levels (Task 4). The tasks contain subtasks involving English-German phrase-based machine translation (SMT) and neural network-based SMT (NMT), German-English SMT, German-English-Latvian SMT and NMT, English-Czech SMT, and English-French SMT. Task 1 is about predicting HTER (human-targeted translation edit rate) scores (Snover et al.,2006), Task 2 is about binary classification of words, Task 3 is about binary classification of phrases, and Task 4 is about predicting multi-dimensional qual-ity metrics (MQM) (Lommel,2015).
We use referential translation machine (RTM) (Bic¸ici, 2017) models for building our prediction models. RTMs predict data translation between the instances in the training set and the test set using interpretants, data close to the task instances. Interpretants provide context for the prediction task and are used during the derivation of the features measuring the closeness of the
RTM interpretants
Task Train Test Training LM
Task 1 (en-cs, SMT) 41254 1000
0.225M 5M
[image:1.595.311.522.221.333.2]Task 1 (en-de, SMT) 27273 1000 Task 1 (en-de, NMT) 14442 1000 Task 1 (de-en, SMT) 26963 1000 Task 1 (en-lv, SMT) 12251 1000 Task 1 (en-lv, NMT) 13936 1000 Task 1 (en-lv, NMT) 13936 1000 Task 3 (de-en, NMT) 6021 543 Task 4 (en-fr, NMT) 1200 269
Table 1: Number of instances and interpretants used.
test sentences to the training data, the difficulty of translating them, and to identify translation acts between any two data sets for building prediction models. With the enlarging parallel and monolingual corpora made available by WMT, the capability of the interpretant datasets selected by RTM models to provide context for the training and test sets improve.
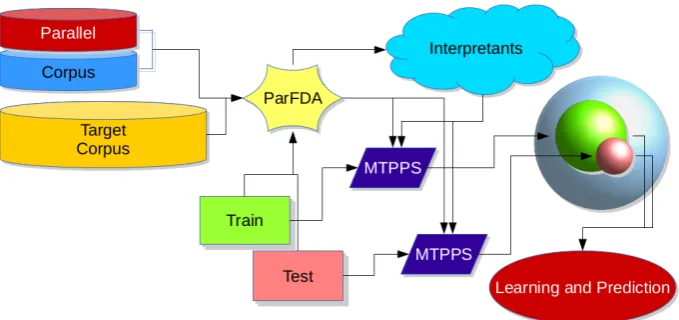
Figure 1 depicts RTMs and explains the model building process. RTMs use parfda
(Bicici, 2018) for instance selection and ma-chine translation performance prediction system (MTPPS) (Bic¸ici and Way, 2015) for generating features. The total number of features vary de-pending on the order ofn-grams used (e.g. a log of probability score from the language model for eachn-gram is used).
We use ridge regression, kernel ridge sion, k-nearest neighors, support vector regres-sion, AdaBoost (Freund and Schapire, 1997), gradient tree boosting, extremely randomized trees (Geurts et al.,2006), and multi-layer percep-tron (Bishop,2006) as learning models in combi-nation with feature selection (FS) (Guyon et al.,
2002) and partial least squares (PLS) (Wold et al.,
1984) where most of these models can be found inscikit-learn. 1 Evaluation metrics listed
1http://scikit-learn.org/
Figure 1: RTM depiction: ParFDA selects interpretants close to the training and test data using parallel cor-pus in bilingual settings and monolingual corcor-pus in the target language or just the monolingual target corcor-pus in monolingual settings; an MTPPS use interpretants and training data to generate training features and another use interpretants and test data to generate test features in the same feature space; learning and prediction takes place taking these features as input.
Figure 2: Document-level RTM model with separate MTPPS run for each training and test document to ob-tain corresponding feature representations, which are filtered and processed before learning and prediction.
are Pearson’s correlation (r), mean absolute error
(MAE), and root mean squared error (RMSE). We use Global Linear Models (GLM) (Collins,
2002) with dynamic learning (GLMd) (Bic¸ici,
2017) for word- and phrase-level translation per-formance prediction. GLMd uses weights in a range[a, b]to update the learning rate dynamically according to the error rate.
2 Mixture of Experts Models
We use prediction averaging (Bic¸ici,2017) to ob-tain a combined prediction from various predic-tion outputs better than the components, where the performance on the training set is used to obtain weighted average of the topkpredictions,yˆwith
evaluation metrics indexed byj ∈ J and weights
Figure 3: Stacking training data, X, frommpredictors.
withw:
wj,i =
( 1
evalj,i ifjis minimized
evalj,i ifjis maximized
ˆ
yˆ
yˆ
yµk =
1
k Pk
i=1yyˆˆyˆi MEAN
ˆ
yˆ
yˆ
yj,wj k =
1
Pk i=1wj,i
Pk
i=1wj,iyyˆˆyˆi
ˆ
yˆ
yˆ
yk = |J1|Pj∈Jyyˆˆyˆj,wjk MIX
(1) where weights are inverted to decrease error. We only use the MIX prediction if we obtain better results on the training set. We select the best model usingr and mix the results usingr, RAE,
MRAER, and MAER. The set of evaluation met-rics used for mixing also affects the results. Since we try to obtain results with relative evaluation metric scores less than 1, we filter out those
re-sults with higher than1relative evaluation metric
scores.
[image:2.595.305.529.324.439.2]Task 4 model setting rP MAE RAE MAER MRAER en-fr SMT doc stack -0.1725 43.0687 0.9857 0.8123 0.805 en-fr SMT doc mix -0.1812 43.5726 0.9973 0.8347 0.8256 en-fr SMT doc FS RR -0.177 44.058 1.0084 0.8509 0.8413 en-fr SMT sent stack 0.2109 42.5196 0.9732 0.8464 0.8372 en-fr SMT sent mix -0.2299 43.2402 0.9897 0.8197 0.8116 en-fr SMT sent FS KR -0.1844 43.2891 0.9908 0.8255 0.8167
Table 2: Training results on Task 4 with stacking and prediction averaging. FS RR is the top single model for doc and FS KR for sent where RR is ridge regression and KR is kernel ridge regression.
Task 1 rP MAE RAE MAER MRAER
[image:3.595.325.504.183.418.2]en-de SMT 0.4336 0.1365 0.8654 0.7951 0.798 en-de NMT 0.459 0.1138 0.8282 0.84 0.7771 de-en SMT 0.5634 0.1364 0.7953 0.7637 0.7573 en-cs SMT 0.5381 0.151 0.8109 0.7423 0.7679 en-lv SMT 0.3805 0.1362 0.9055 0.8755 0.8041 en-lv NMT 0.5714 0.1466 0.7971 0.753 0.7595 Table 3: Training results on Task 1 with prediction av-eraging.
weights where pi represents the accuracy of the
independent classifieriin a weighted majority
en-semble (Kuncheva and Rodr´ıguez,2014) obtained slightly better results (Equation (2)).
wj,i= wj,i
1−wj,i (2)
We also use stacking to build higher level mod-els using predictions from base prediction modmod-els where they can also use the probability associated with the predictions (Ting and Witten,1999). The stacking models use the predictions from predic-tors as features and build second level predicpredic-tors (Figure3).
3 Document-level MTPP Model Comparisons
We evaluate the effect of two different RTM data modeling techniques for the document-level task. Our first approach involves running separate MTPPS instances for each training (green in Fig-ure2) or test (salmon colored) document to obtain specific features for each document. Then, only the document-level features and the min, max, and average of the sentence-level features are used to obtain an RTM representation vector instance from each document. Our second approach con-catenates the sentences from each document to ob-tain a single sentence representing each and runs an RTM model. Features from word alignment are included in both and they share the interpretants. The first approach use 1359 features and the sec-ond use 383 features.
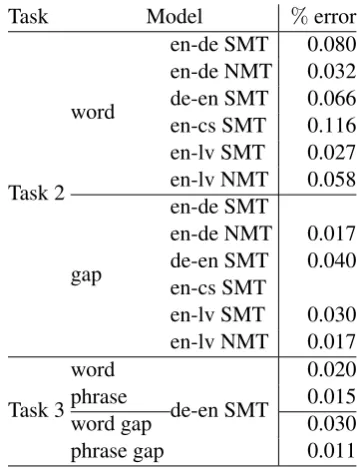
Task Model %error
Task 2 word
en-de SMT 0.080 en-de NMT 0.032 de-en SMT 0.066 en-cs SMT 0.116 en-lv SMT 0.027 en-lv NMT 0.058
gap
en-de SMT
en-de NMT 0.017 de-en SMT 0.040 en-cs SMT
en-lv SMT 0.030 en-lv NMT 0.017
Task 3 word
de-en SMT
0.020
phrase 0.015
word gap 0.030
phrase gap 0.011
Table 4: RTM Task 2 training error for some of the models where GLMd is parallelized over splits. All GLMd models use[0.5,2]as weights.%error are twice the overall error found based on all tags (2N+1).
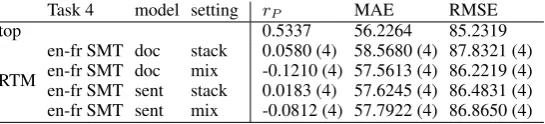
Training results are in Table2 where we com-pare them and the first approach is denoted as doc and the second as sent. The first approach obtained the top results in QET16 (Bicici,2016). doc ob-tains better MAER (mean absolute error relative) and MRAER (mean relative absolute error rela-tive) (Bic¸ici and Way,2015). We obtain3rd best
RMSE while we note that both MAE and RMSE results are close to each other in all four submis-sions on the test set.
4 Results
[image:3.595.77.289.183.257.2]Task 4 model setting rP MAE RMSE
top 0.5337 56.2264 85.2319
RTM
[image:4.595.163.436.62.124.2]en-fr SMT doc stack 0.0580 (4) 58.5680 (4) 87.8321 (4) en-fr SMT doc mix -0.1210 (4) 57.5613 (4) 86.2219 (4) en-fr SMT sent stack 0.0183 (4) 57.6245 (4) 86.4831 (4) en-fr SMT sent mix -0.0812 (4) 57.7922 (4) 86.8650 (4) Table 5: Task 4 test RTM results and the top result in the task.
Task 1 rP rS MAE RMSE
en-de SMT topRTM 0.4166 (6) 0.4254 (4) 0.1353 (5) 0.1731 (6)0.7397 0.7543 0.0937 0.1362 en-de NMT topRTM 0.4704 (3) 0.5461 (3) 0.1192 (3)0.5129 0.6052 0.1114 0.17190.1727 (1) de-en SMT topRTM 0.5772 (6) 0.5167 (5) 0.1311 (6) 0.1679 (4)0.7667 0.7318 0.0945 0.1315 en-cs SMT topRTM 0.5295 (3) 0.5348 (3) 0.1519 (3) 0.1952 (3)0.6918 0.7105 0.1223 0.1693 en-lv SMT topRTM 0.3521 (8) 0.2861 (7) 0.1430 (4) 0.1869 (3)0.6188 0.5766 0.1202 0.1602 en-lv NMT topRTM 0.5487 (4) 0.5017 (4) 0.1540 (3) 0.2006 (3)0.6819 0.6665 0.1308 0.1747
Table 6: Test results of RTM in Task 1 where numbers in parentheses show the rank and corresponding top re-sults. RTM achieves the lowest RMSE in en-de NMT and becomes the 3rd system in general.rPis Pearson’s
correlation andrSis Spearman’s correlation.
2007) processing tools. 2 LMs are built using kenlm(Heafield et al.,2013). The comparison of results on the training set are in Table3for Task 1 and in Table2for Task 4.
The results on the test set (Tables5and6) shows that RTM can become the 1st in en-de NMT and 3rd in general. Test results are taken from the
com-petition’s result submission websites at:
• sentence level https://competitions. codalab.org/competitions/19316
• word level https://competitions. codalab.org/competitions/19306
• phrase level https://competitions. codalab.org/competitions/19308
• document level https://competitions. codalab.org/competitions/19309
The references for the test sets are not released yet. For Task 2 and Task 3, we model words or phrases and gaps separately and then combine their results. The error%on the training sets are
in Table4and the results on the test set are in Ta-ble7.
2https://github.com/moses-smt/ mosesdecoder/tree/master/scripts
Model task F1BAD F1OK wF1
w
ord
en-deword 0.3300 (7) 0.8813 (3) 0.2908 (6) SMT gapsrc 0.2547 (3) 0.9764 (1) 0.2487 (3)0.1650 (2) 0.8591 (1) 0.1418 (2)
en-deword 0.0927 (6) 0.9235 (1) 0.0856 (6) NMTgapsrc 0.1360 (1) 0.9878 (1) 0.1343 (1)0.0337 (2) 0.9209 (1) 0.0310 (2)
de-enword 0.3790 (6) 0.8979 (3) 0.3403 (6) SMT gapsrc 0.1463 (3) 0.9804 (1) 0.1435 (3)0.1211 (2) 0.8946 (1) 0.1083 (2)
en-lv word 0.3681 (3) 0.9044 (1) 0.3329 (3) SMT gapsrc 0.1298 (3) 0.9853 (1) 0.1279 (3)0.1195 (2) 0.8917 (1) 0.1066 (2)
en-lv word 0.4280 (4) 0.8530 (1) 0.3651 (3) NMTgapsrc 0.0829 (3) 0.9819 (1) 0.0814 (3)0.1977 (2) 0.8418 (1) 0.1664 (2)
en-cs word 0.5280 (4) 0.8257 (2) 0.4360 (4) SMT gapsrc 0.1059 (3) 0.9810 (1) 0.1039 (3)0.3229 (2) 0.7962 (2) 0.2571 (2)
phrase
de-en
phrase 0.2651 (3) 0.9168 (1) 0.2431 (2)
SMT
gap 0.0518 (2) 0.9811 (1) 0.0508 (2) src 0.0956 (1) 0.8994 (1) 0.0860 (1) word 0.1648 (3) 0.9004 (2) 0.1484 (3) gap 0.1029 (2) 0.9373 (1) 0.0964 (2) src 0.0973 (2) 0.8376 (1) 0.0815 (2)
Table 7: RTM Task 2 and Task 3 results on the test set. wF1is average weightedF1score (F1multi).
5 Conclusion
Referential translation machines can achieve top performance in automatic, accurate, and language independent prediction of translation scores and achieve to become the 1st system according to
RMSE for MTPP from English to German in QET18. RTMs pioneer a language independent approach and remove the need to access any task or domain specific information or resource.
Acknowledgments
with-out contribution to the content nor responsibility thereof. We also thank the reviewers’ comments and Fred Blain from The University of Sheffield.
References
Ergun Bic¸ici. 2017. Predicting translation performance with referential translation machines. InProc. of the Second Conference on Statistical Machine Transla-tion (WMT17), pages 540–544, Copenhagen, Den-mark. Association for Computational Linguistics.
Ergun Bic¸ici and Andy Way. 2015. Referential trans-lation machines for predicting semantic similarity. Language Resources and Evaluation, pages 1–27.
Ergun Bicici. 2016. Referential translation machines for predicting translation performance. In Proc. of the First Conference on Statistical Machine Trans-lation (WMT16), pages 777–781, Berlin, Germany. Association for Computational Linguistics.
Ergun Bicici. 2018. Robust parfda statistical machine translation results. InProc. of the Third Conference on Statistical Machine Translation (WMT18), Brus-sels, Belgium.
Christopher M. Bishop. 2006. Pattern Recognition and Machine Learning.
Michael Collins. 2002. Discriminative training meth-ods for hidden markov models: theory and experi-ments with perceptron algorithms. In Proc. of the ACL-02 conference on Empirical methods in natu-ral language processing - Volume 10, EMNLP ’02, pages 1–8, Stroudsburg, PA, USA.
Yoav Freund and Robert E Schapire. 1997. A decision-theoretic generalization of on-line learning and an application to boosting. Journal of Computer and System Sciences, 55(1):119–139.
Pierre Geurts, Damien Ernst, and Louis Wehenkel. 2006. Extremely randomized trees. Machine Learn-ing, 63(1):3–42.
Isabelle Guyon, Jason Weston, Stephen Barnhill, and Vladimir Vapnik. 2002. Gene selection for cancer classification using support vector machines. Ma-chine Learning, 46(1-3):389–422.
Kenneth Heafield, Ivan Pouzyrevsky, Jonathan H. Clark, and Philipp Koehn. 2013. Scalable modified Kneser-Ney language model estimation. InProc. of the 51st Annual Meeting of the Association for Com-putational Linguistics, pages 690–696, Sofia, Bul-garia.
Philipp Koehn, Hieu Hoang, Alexandra Birch, Chris Callison-Burch, Marcello Federico, Nicola Bertoldi, Brooke Cowan, Wade Shen, Christine Moran, Richard Zens, Chris Dyer, Ondrej Bojar, Alexandra Constantin, and Evan Herbst. 2007. Moses: Open source toolkit for statistical machine translation. In
Proc. of the 45th Annual Meeting of the Association for Computational Linguistics Companion Volume Proc. of the Demo and Poster Sessions, pages 177– 180. Association for Computational Linguistics.
Ludmila I. Kuncheva and Juan J. Rodr´ıguez. 2014. A weighted voting framework for classifiers en-sembles. Knowledge and Information Systems, 38(2):259–275.
Arle Lommel. 2015. Multidimensional quality metrics (mqm) definition. URL http://www. qt21. eu/mqm-definition/definition-2015-12-30. html.
Matthew Snover, Bonnie Dorr, Richard Schwartz, Lin-nea Micciulla, and John Makhoul. 2006. A Study of Translation Edit Rate with Targeted Human Annota-tion. In Proc. of Association for Machine Transla-tion in the Americas,.
Lucia Specia, Fr´ed´eric Blain, Varvara Logacheva, Ram´on F. Astudillo, and Andr´e Martins. 2018. Findings of the wmt 2018 shared task on quality es-timation. In Proceedings of the Third Conference on Machine Translation, Volume 2: Shared Task Pa-pers, Brussels, Belgium. Association for Computa-tional Linguistics.
Kai Ming Ting and Ian H. Witten. 1999. Issues in stacked generalization. Journal of Artificial Intel-ligence Research, 10:271–289.