381
IRISH ACTUARIAL DATA,
BY W. A. HONOHAN, M.A., F.I.A. {Read on Friday, 15th December, 1944.)
Actuarial science is mainly concerned with the estimation of future contingencies, particularly from the monetary point of view, and in this it utilises past experiences of the forces involved. These may find expression in the rates of mortality, rates of sickness, probabilities of marriage and of issue, trends of age-distributions, proportions married, sizes of families, relative ages of husbands and wives, rates of promotion in business, rates of secession and so on. Not every problem can of itself, however, throw up a sufficient volume of material to enable all the necessary factors to be calculated, so that it is desirable, if possible, to make available from time to time certain standard data, which could be used, at least as a guide, in the solution of such problems.
It is instructive to compare the position in regard to data in this country with that obtaining in Great Britain, our nearest neighbour. It has been the practice of British life assurance companies to mako available at intervals the mortality experience under their assurance and annuity contracts, and in recent years they have, in fact, been publishing it more or less continuously. From this material numerous tables of monetary functions have been derived and are used extensively in the valuation of the companies' contracts and in all kinds of problems. There is, on the other hand, no published experience of Irish assurance companies.
In Great Britain, too, the sickness experiences of some of the larger friendly societies and of selected approved societies under the National Health Insurance Scheme have been published, whereas, so far as I am aware, there has been in this country only one sickness investigation about which information is available (although not published), namely, that of the National Health Insurance Society during the years 1935 to 1938. I refer to this investigation later.
The experiences of certain pensioners and life tenants and of a number of private pension and widows' and orphans' funds in Great Britain have also been published, not to speak of the Government Actuary's Reports on the valuations of the National Health Insurance Societies and on the Widows', Orphans' and Old Age Pensions Scheme.
In Eire, we have had three National Life Tables, prepared in connec-tion with the 1926 and 1936 Censuses and the 1941 Register of Populaconnec-tion. In each case there are separate tables for males and females and, for 1941, tables (male and female) for Urban Areas. In a similar manner to Great Britain, the Insurance Act, 1936, prescribes the Eire Life Table No. 1 (Males) as the basis to be used in the calculation of free paid-up policies and of surrender values of industrial assurance policies, but no monetary functions have been published, except those given in a short-illustrative paper of mine which was published in the Journal of the
Institute of Actuaries (Vol. 68, p. 168). To complete the picture, I
should mention the unofficial regional life tables presented to this Society by Mr. Colm A. Barry on the 31st October, 1941.
I now propose briefly to survey the existing material, and to present certain new statistics and functions.
Age Distribution of the Population.
I consider first the age-distribution of the population as it is a feature which has more than a technical interest and is, in fact, very much to the point in these days of planning social schemes for the future. Acluaries are interested in age-distributions for a number of reasons. They represent the resultant of various forces of mortality, migration and so on ovor a large number of years, and they are an important factor in population forecasting. They also, of course, affect the cost of insurance and pension schemes for the persons constituting the age-distribution.
From the published statistics, we may deduce the following table :
TABLE I
Percentage Distribution by Decennial Age-Groups of the Population of the Twenty-six Counties at intervals of forty years.
Age-Group
€— 4 5—14 15—24 25—34 35—44 45-- r>4 55—64 65.-74 . . 75 and over
TOTAL
Census, 1861
0/
/o 11-9 20-6 22-5 12-9 10-4 9-6 7-5 3-1 1-5
100-0
Census, 1901
% 9-7 20-5 20-9 14-5 10-6 9-2 8-1 4-3 2-2
100-0
Register, 1941
0/
/o 9-2 18-0 17-1 14-4 12-1 10-1 8-8 7-2 3 1
100-0
By W. A. Honohan, M.A., F.I.A. 383
In Table II, I have made what may be described as a socially significant age-grouping of the figures and I have set out the trend over roughly a half-generation and compared it with the corresponding movement in Great Britain and the U.S.A. The population is divided into four groups which may be described as (a) children, (b) the most active working population (which includes the whole of the female population of reproductive ages), (c) middle age and (d) old age.
TABLE II
Percentage Distribution of Populations in Broad Age-Groups—-Some Comparisons
AGE-GROUP
0—14 15—44 45—64
65 and over
TOTAL
E I R E
1926 29-2 42-7 18-9 9-2 100-0
1941 27-3 43-5 18-9 10-3 100-0
GREAT BRITAIN
1921 27-7 46-9 19-4 7-0 100-0
1939* 21-5 46-1 2 3 0 9-4 100-0
U.S.A.f 1920
31-8 47-3 16-2 4-7 100-0
1940 25-1 48-4 19-7 6-8 100-0
* National Register—United Kingdom and Isle of Man---Statistics of Population on 29th September, 1939 (70—368*). The figures are exclusive of men in the Armed forces, and should be read with that in mind.
•f Statistical Abstract of the U.S.A.
The main features of the table are that we have a higher proportion of old people than the British or Americans, and that while all three peoples are growing older, the British and Americans are doing so faster than we, our main strength apparently being in the proportion of children, v/hich, however, is itself dwindling. The stronger " working " blocks— on which services for young and old depend—in the British and American figures should be noted. It is scarcely necessary to remark that, other things being equal, where such groups are strong, standards of living are higher. The falling populations in the youngest group and the main-tenance of vitality standards point, however, to the likelihood that the strength of these groups will not be long maintained.
A recent British White Paper* makes the point that the increased proportion of old persons is directly due to the improvements in medical science and sanitary legislation, and that this trend was to be expected, and may not, in fact, be undesirable, since with lowered mortality goes increased vitality, and with it an increase in the age up to which economic productivity can, if necessary, be maintained. I feel that this argument is not very helpful in view of the insistent demands for more leisure and pensions at earlier ages. Moreover, the older a man gets the* harder it is to learn a new job, so that the increasing average age of the working part of the population will not help the unemployment problem. Another point which may be made is that the direction of economic demand varies considerably with age,* and with a changing age-distribution changes in the direction of demand and supply must be expected. In this respect we may be affected to some extent, as regards our imports, by a changed character of supply in Great Britain, even though the changed force of demand may not be so strong here.
Irish Actuarial Data
In business, too, recruitment may be necessary in due course at ages much above the normal entry age. This would affect private pension schemes by making necessary increases in the contributions required— apart altogether from any increasing burden due to greater vitality among pensioners. Life assurance companies, also, may experience a smaller volume of new business—which is mostly taken out at ages under 35—and when this occurs in conjunction with the maturing of policies to larger numbers of old persons, the invested funds of such companies may reach a peak and begin to fall. In this country, however, it may be that there is still a considerable degree of under-insurance, a fact which might tend to postpone such an eventuality. And it may be no harm to point out once again that the incurring of long-term liabilities, whether by the State or by local authorities or private interests, should be related to long-term movements of the population.
Population Forecasting.
I have said that the age-distribution of the population is an important factor in attempts at estimating the future trend of the population. Except, perhaps, for schemes of national ambit, actuaries are not par-ticularly concerned with population forecasts, and I do not propose to do more than to draw the attention of those interested to the papers submitted to this Society by Dr. Geary in November, 1935, and March, 1941, which indicate that where an allowance is made for migration and/or declining fertility and mortality, the change in the age-distribution of the population may be expected to continue in the direction indicated in Table II. In Great Britain many estimates—official and unofficial —have been made. Of these I may mention that issued as a White Paper in May, 1942—Current Trend of Population in Great Britain— and that recently made by the Government Actuary's Department in connection with the Beveridge Plan and the White Paper on Social Insurance (Cmd. 6550). Practically all of these estimates—based on different assumptions—point to a continuance of the trend towards an aged population.
Other Age-distributions.
The age-distribution of a particular section of the community cannot be expected to be similar to that of the whole population if the group is subject to forces other than death. Thus, in a body like the Civil Service from which members fall out on permanent incapacity, on dismissal, or on transfer to other occupations, and to which new members are added at different ages, we find the following age-distribution which I am permitted to quote. It is that of established Civil Servants on the 1st January, 1940, who numbered 9,756 males and 3,853 females.
TABLE III
Percentage Distribution by Quinquennial Age-Groups of Established Civil Servants on 1st January, 1940.
Age-Group
Male . Female
16-20
/o
3-2 6-3
20-25
0/
/o 11-4 40-3
25-30
0/
/o 111 20-6
30-/ 11 8
35
n
0 2
35-40
0/
/o 10-8
6-8
40-/ 14 7
45
T
1 7
45-50
0/
/o 10-6
4-2
50-°/ 11
2 55
o
1 9
55-60
0/
/o 10-8
2-1
60-°/ 5 0
-65
/
o
6 9
Over 65
/o
0-1 .—
Total
By W. A. Ronohan, M.A., F.I.A. 385 The main points in this table are the fairly even spread of the male& over the quinquennial age-groups from 20 to 60, and the considerable fall away in females after the early ages, due no doubt mainly to marriage —on which retirement is compulsory—but also, to some extent, to the fact that the influx of women into the established Civil Service has only taken place on a large scale within the past 20 or 30 years, so that the later age-groups have not yet received their full quota and the distribution is accordingly unstable. Practically one-half of the females are under 25 years of age, and the average age of all is 29-7 as compared with 40-4 for the males.
As a matter of interest, I give in Table IV the age-distributions of the male members of a Bank and of a large friendly society in comparison with the Civil Service. In the case of the Bank the change in the age-distribution over a period of only 15 years was so remarkable—and so significant as a warning when endeavouring to forecast the future —that I give the distribution as at two dates.
TABLE IV
Percentage Distributions by Quinquennial Age-Groups of Male Staffs—Some Comparisons.
Age Group
16—20 20—25 25—30 30—35 35—40 40—45 45—50 50—55 5 5 _ 6 0 60—65 Over 65
TOTAL
Average Age
Bank 1926
/o 12-5 42-6 14-4 9-1 5-3 4-7 3 0 3-4 2-0 1 1 1-9 100-0 29-5
1941 0/
/o
3-5 8-4 15-3 21-2 26-8 9-8 5-6 3 0 2-4 1-4 2-6 1000 36-7
Friendly Society
1942 0/
/o
1-8 4-8-6-3 6-3 11-8 20-7 19-0 12-9 8-5 4-9 3-0 100-0 44-7
Civil Service,
1940 0/
/o
3-2 11-4 11-1 11-0 10-8 141 10-6 111 10-8 5-6 0 1 100-0 40>4
The really interesting point about these figures is the way they differ from each other. They illustrate clearly the danger of using the experience of any one group for another or, indeed, for the same group at two different points of time.
Mortality.
The contingency of death enters into all calculations relating to the future and, for this reason, the study of mortality rates is of prime importance to the actuary. Crude rates—so much per, say, 1,000 of the population—are of little or no use, since it is essential to have regard to age-distributions. Mortality rates by age have been extracted for the years surrounding the Census dates and have been used in the pre-paration of the Life Tables. The most recent table, Eire No. 3—issued last March—shows that there is a repetition of some of the features disclosed in the No. 2 Table. For instance, the male rates fall to about age 11 and then increase to the end of life, except for a slight recession round about the ages 24 to 27. Incidentally, the recession lasts until about age 30 in the Urban Areas Table. On the other hand, the female rates, while continuing to show the feature of falling to about age 10, Introduce on this occasion a recession, as in the male table, between ages 25 and 28; this does not appear in the Urban Table.
In Table V, I have set out some specimen mortality rates which may help to fix ideas of the relative vitality in the different countries in these islands, bearing in mind, of course, the different periods to which they relate.
TABLE V
Specimen Values of Ike Bales of Mortality per 10,000 i.e. the j^robahiliiies of dying within one year after the age slated.
Age
Males
20 40 60 80
Females
20 40 60 80
No. 1 1925-7
40 70 243 1,139
45 75 239 1,005
Eire Life Tables No. 2
1935-7
35 62 241 1,063
37 63 224 966
No. 3 1940-2
35 56 234 1,235
38 58 216 1,091
Urban 1940-2
41 71 337 1,280
37 59 252 1,068
Northern Ireland
Life Table 1925-7
38 67 265 1,217
45 78 258 1,045
English Life Table (No. 10)
1930-2
32 56 242 1,450
27 44 177 1,186
Scottish Life Table 1930-2
33 68 252 1,510
29 55 202 1,258
The similarity between the Eire and the Northern Ireland rates, especially at the early ages, should be noted, as also the favourable male rates compared with the English and Scottish, particularly at the older ages. It is surprising, however, to observe that the Eire female rates at the important ages are rather less favourable than the British female rates, which, incidentally, are materially lower than the British male rates.
By W. A. Honohmi, M.A., F.I A. 387
TABLE VI
Bates of Mortality per 10,000 in Certain Age-Qrowps—International Comparisons.
Age-Group
Males 25-29 35-39 45-49 55-59 65-69
Females 25-29 35-39 45-49 55-59 65-69
1935-7
41 53 91 188 407
49 57 85 175 370
England
and
Wales 1939*
26 37 80 195 445
24 30 58 123 316
U.S.A. (White Population)
1939f
26 42 93 205 441
21 33 64 140 331
Germany 1936f
32 45 80
175.
421
28 38 65 138
, 367
France 1936f
47 80 125 229 486
38 48 75 139 320
Denmark 1940f
18 30 57 138 364
19 31 54 121 332
•Journal of the Institute of Actuaries, Vol. 71, p. 411. The ratos given here are central death-rates.
f Monthly Bulletin of Statistics published by the League of Nations—-December, 1941.
In general these figures are more noteworthy for their similarity than for their differences. Irish male mortality is relatively heavy at the early ages but relatively favourable in later life, whereas Irish female mortality, while generally not unfavourable in comparison with Irish male mortality, is unfavourable for the age-groups given, as compared with all the other countries. The lightness of the Danish male rates and the heaviness of the French male rates are also noteworthy features. Before passing from the rates of mortality, I should like to voice a plea for the recording of marital status at death. This would enable us to extract rates of mortality for married persons as distinct from single or widowed. In England the information is available for women, but it is available for both sexes in Scotland. It appears from the Scottish figures that married men are subject to much lighter mortality than single men or widowers, and that the mortality is heaviest amongst widowers. With regard to women, the rates of mortality for widows both in Scotland and England are much heavier than those for single or married women. For ages up to between 40 and 45 in Scotland, and 35 to 40 in England, the rates for single women are lighter than those for married women. After these ages the position is reversed, but the differences are not great at the older ages.
Life Tables and Age-distributions.
Irish Actuarial Data
hand, is a fortuitous grouping of persons who have been subject to varying forces of mortalitj^, varying degrees of accretion by births and varying forces of migration. While the two are, therefore, not com-parable, it is instructive to place them side by side to see how faf the existing population fails to conform with the life table assumptions.
TABLE VII
Age-Distribution of the Population in 1941 and that of the Eire Life Table No. 3.
Age-Group
0-4 5-9 10-14 15-19 20-24 25-29 30-34 35-44 45-54 55-64 66-74 75 and over Total
Average age .
Males 1941 Register
0/
/o
9-3 9-1 9-0 9-0 8-0 7-6 6-8 12-0 10-2 8-9 7-3 2-8 100-0 31-5*
No. 3 Life Table
0/
/o
7-8 7-5 7-5 7-4 7-3 7 1 7 0 13-4 12-5 10-7 7-6 4-2 100-0 35-1
Females 1941
Register 0/
/o
9-2 9 0 9-0 9 1 7-9 7-7 6-6 12-2 10-0 8-7 7-1 3-4 100-0 31-7*
No. 3 Life Table
% 7-7 7-4 7-4 7-3 7-2 7-0 6-9 13-2 J2-3 10-7 7-9 5-0 100-0 35-6
*1936 Census : Data not given in sufficient detail in 1941 for precise calculation. Apart from the feature that the average age of males is almost the same as that of females in the general population, the difference of 4 years in each case between the population and the life table average ages gives some indication of the extent to which the assumptions implicit in the life table have not operated in the past.
The figures suggest interesting, if tentative, lines of argument. For instance, the point could, perhaps, be made that, while there is a suffi-ciency of births for the maintenance of a stable population, one of the effects of migration has been to bring about such a reduction of the early adult and middle-age groups that the known improvement in mortality rates has not been able to restore the average age of the population to normal. Having regard to the proportions in the later age-groups it might also be suggested that, despite the ageing of the population to which I have already referred, the position at present is not as bad as in a stable population subject to the 1940-2 forces of mortality. Survivorship.
By W. A. Konohan, M.A., F.I.A.
TABLE VIII
Numbers Surviving to Ages Stated out of 1,000 Persons Born.
389
Attained
Age
20 40 60 80
Males
]£ire 1940-2
871 799 635 191
I^ire Urban
Areas 1940-2
841 764 548 131
England
and
Wales 1930-2
872 809 636 162
Females
Eire 1940-2
891 813 657 225
&ire Urban
Areas 1940-2
866 793 621 192
England
and
Wales 1930-2
894 837 702 249
There is a striking similarity between the fiire male figures up to age 60 and the English figures, but the fiire female figures, while better than the ^ire male figures, are less favourable than the English all through, The figures for urban areas indicate the considerably lower vitality of those areas, especially for males.
Other Forces of Decrement.
So far my remarks have dealt with the life tables for the whole country or for the urban areas. In the case of particular sections of the popula-tion such as the Civil Service, there are other forces of decrement as well as mortality, but there is very little published information on the point. The Society may, therefore, be interested to see the results of an examina-tion which I made of the experience of established Civil Servants during the three years 1935-37. Although the data is not very extensive (because the period was short), it is possible to obtain a fairly useful picture of the way in which the decrements due to withdrawals, ill-health retire-ments, etc., affect the numbers surviving to different ages.
In Table IX \ give numbers of such survivors and compare them with those from the ]§ire Life Table No. 3.
TABLE IX
Numbers Surviving to Ages Stated out of 100 Starting at Age 20.
Age
20 30 40 50 60 Go
Males
Civil Service
100 92 86 77 48 41
Eire
100 96 92 85 73 63
Females
Civil Service
100 59 38 28 13 6
Eire
100 96 91 85 74 65
retirement age of 65. The " loss " of 59 arises from 27 retirements on grounds of ill-health, 15 resignations or dismissals, 15 deaths and 2 normal retirements after age €0. Out of 100 females starting at age 20, only 6 reach the compulsory retirement age of 65, the decrement of 94 being made up of 52 marriages, 23 retirements on grounds of ill-health, 6 resignations (otherwise than on marriage) and dismissals, 5 deaths, and 8 normal retire-ments after age 60.
Values of Annuities depending on Survival, etc.
In Appendix A I give the values of some functions derived from the Eire No. 3 Life Table, namely, the present values, at 2J per cent, 3 per cent, and 3|- per cent interest, of an annuity of 1 (i.e. a unit) per annum to persons at each age, and the present values, at 3 per cent interest, to persons at each age, of a unit payable on death. Values are given separately for males and females, and it is seen that the annuity values for females are higher at all ages than for males and, of course, their assurance values are lower. A difference of only | per cent, in the rate of interest makes a difference in the annuity values at the youngest ages of as much as 10 to 12 per cent., but this naturally becomes smaller as the age advances. '
Although schemes of national ambit require national statistics as a basis for their costing (and the English Life Tables have, in fact, been used extensively for calculations required in connection with social insurance schemes in Great Britain), it should be remembered that the data for the national life tables comprises the sick-bed members of the population as well as the healthiest. The figures in the Appendix, therefore, being based on such a heterogeneous collection, could not be expected to be applicable to any particular class of the community such as the working or insured population, or the members of a profession or business, as selective forces of one kind or another are always operating to distinguish one class from another.
Having issued this warning, and, notwithstanding the risk involved in quoting figures which may be used without the necessary caution and qualifications, I venture to give a few illustrations. At 3 per cent, interest and assuming the mortality of the whole (male or female) population in the years 1940 to 1942 to continue throughout the remainder of l i f e
-fa) the capital value at its commencement—age 70—of an old age pension of 10/- a week is £207 for a man and £221 for a woman ;
(h) the capital value on retirement at the age of 65 of a pension of
By W. A. Honohan, M.A., F.I.A. 391
outlay figures. If attention is focussed exclusively on the annual costs, it is to be feared that the full import of the matter cannot be appreciated. If a scheme, providing for benefits payable in the future, is enshrined in legislation, the extent of the burdens to which we are endeavouring to commit posterity, legally and morally, should be realised. In so far as the present generation is not expected to provide the necessary finance cumulatively to meet such benefits, it should be borne in mind that posterity may have no desire—may, in fact, not be able—to meet them, and it may alter the law to suit itself. Schemes of social security which proceed on the " pay as you go " plan, ignoring the gross burden and providing no trusteeship except the future community as a whole, should be recognised for what they are, that is to say, dependent on the good-will of the next generation.
I have applied the annuity values at 3 per cent, to the numbers in the population at the older ages in 1936 (the figures are not given for each year of age for 1941), and—again bearing in mind the limitations of the figures—find that the capital cost of granting an old age pension of £1 a week to all those over the age of 65 would be of the order of £105,000,000. If the commencing age were reduced to 60 the cost would be about £85,000,000 more. Again, I must point out that these costs do not cover those persons now living who are under these ages of 60 or 65, and who may hope to secure a pension in due course, nor do they cover generations still'unborn.
Proportions Married.
Up to this point I have dealt mainly with the contingency of death. Contingency is perhaps not the happiest word because death is a certainty; only its incidence is contingent. I come now to marriage, which while not a certainty, has a high degree of probability for most people, and has a vital bearing on the future population of our country.
Marital status is recorded at each Census, and the numbers of persons married, widowed and single in certain age-groups are set out in the published volumes. The most recent figures are compared with those of the British Register of September, 1939, in the following table. The age-groups are not quite the same in the two cases as the British data was extracted by year of birth, so that the age-groups would be 14f-19f, 19|-24|, etc.
TABLE X
Proportions
Age-Group
15-20 20-25 25-35 35-45 45-55 55-65 65 and over .
of the Population in Certain Age-groups who are Married
Males
^ i r e 1941
•002 •032 •255 •534 •625 •607 •516
Great Britain 1939
•006 •160 •646 •841 •861 •805 •630
Females
Iiiire 1941
•010 •123 •445 •643 •633 •522 •306
Great Britain 1939
•026 •322 •694 •765 •718 •614 •355
It is frequently useful when dealing with widows' and orphans' funds to have information as to the proportions of members who are married. For this reason, and also because I have used the figures in deriving the probabilities of marriage to which I refer in the next section of my paper, I have set out, unadjusted, the proportions married at each age up to 60, as derived from the 1936 Census data. It is a pity that similar information —i.e. as to marital status at each age—is not made available from the 1941 Register, and it is to be hoped it will be given for later Censuses. Beyond noting that the figures would require to be graduated before being suitable for monetary or other calculations, no comment seems to be called for, except perhaps that, as was to be expected, the female proportions are higher than the males at the earlier ages and lower at the later ages. Probabilities of Marriage.
The probability of becoming married within a year at each age cannot be obtained directly because age is not recorded at marriage. The information may be available in certain funds or businesses where mar-riage brings about retirement, an increase in salary, a payment of a gratuity, or other change of status. This, however, would be of limited utility, and, for the country as a whole, it would be desirable to have a broader basis as, for instance, the data in a national insurance scheme. The last valuation regulations for the National Health Insurance Scheme* quote the marriage rates for spinsters and widows which were used at the inception of the Scheme in 1911, and were based on marriages in the United Kingdom in the ten years 1896 to 1906. There are no rates for males as there is no benefit payable to males on marriage. Incidentally, in the Report on the experience of the Scheme submitted by the British Government Actuary in 1939—to which I have already referred—the rates adopted are stated to have been based on the recorded experience of the Society during the three years 1935-37 ; the rates themselves were not, however, quoted.
I give in Appendix B the results which I obtained by applying the proportions married in the 1936 Census—graduated to remove minor fluctuations from age to age—to the functions of the fiire Life Table No. 3. The principle adopted was to obtain the numbers of unmarried (in the life table population) who marry within each year of age by equating the numbers married in the life table at each age with the survivors from those who were married at the previous age and the survivors of those who became married within the year, the assumption being made that marriages occur evenly over the year and, for purposes of approximate calculation, could therefore be regarded as all taking place at the middle of the year. The formula used is set out in the Appendix. As the probabilities derived in this way come abruptly to an end—at) age 52 in the case of males and 41 in the case of females—the figures for the later ages are arbitrary, being based on the shapes of the curves leading up to these points.
. By W. A. Honohan, M.A., F.T.A. 393 impossible to provide a series of rates which would be appropriate for every year. The numbers of marriages obtained by applying the pro-babilities to the 1936 Census data are 13,472 from the male rates and 14,465 from the female, as compared with 14,336 actual marriages in 1935 and 14,763 in 1936. (It is not possible to calculate the expected marriages accurately from the 1941 data, as the population is not given for each age.) The female rates, therefore, appear to be quite satisfactory as appropriate to the period round about 1936. I am unable to explain why the male rates should give such a low figure, as they were calculated on precisely the same basis as the female, unless it be that the degree of accuracy in the recorded marital status is not the same in the two sexes.
While these features of the statistics indicate that too much cannot be claimed for the probabilities I have quoted, they are, at least, better than none, and whatever about their absolute amount—which could, perhaps, be graded up or down to suit circumstances, they do, it is suggested, give a fair idea of the progression of the probabilities from
age to age.
It is interesting to observe that the greatest probability of marriage for both sexes is at age 30. This must not, of course, be confused with the average ages at marriage? which were given in Volume X of the
1926 Census (p. 84) as 34.9 for males and 29.1 for females, and which were
deduced from statistics for marriages of under one year's duration. The female rates mount and fall away more quickly with age than the male rates, the highest point with the males, (at age 30) being no greater than that for females at age 22.
I made no graduation of the rates after applying the formula, and therefore the minor fluctuations from age to age should not be regarded as in any way significant. It is possible, however, that the peculiar fall in the female rates at the important age of 24 may have some explanation which eludes me.
In the following table, I compare specimen probabilities from the Appendix with those adopted for the British (and Irish) National Health Insurance Scheme and those used in the German Social Insurance Scheme.
TABLE XI
Probabilities of Marriage within a Year—Women
Age
20 25 30 35 40
45
35ire
•0380 •0600 •0809 •0434 •0121 •0005
British National Health Insurance
•0689 •1091 •0672 •0338 •0186 •0109
German Social Insurance*
•0777 •1719 •1241 •0730 •0492 •0281
* Actuarial Technique and Financial Organisation of Social Insurance—Feraud.
Published by the International Labour Office.
Occasionally; we require annuity values depending on marriage as well as survival, for instance, in connection with contributions to a fund which cease on marriage. Combining the marriage rates with the death rates, I have prepared the table of 3 per cent, annuity values in Appendix B. Comparing the figures with those in Appendix A, we see that the effect of introducing the marriage element is to reduce, very considerably, the value of the annuities depending on survival only. The new values decrease, at first, to age 22—where they are almost as low as one-half of the ordinary annuity values—and they increase there-after to age 40, there-after which they fall again, when the effect of the marriage probabilities is practically negligible.
Belative Ages of Husband and Wife.
Information in regard to the relative ages of husbands and wives is also very useful in the valuation of widows' funds and in other circum-stances. In Vol. IX of the 1926 Census, particulars are given of the age-distributions of husbands and wives in quinquennial age-groups ; the information is not available in respect of any later date. The figures disclose features almost exactly similar to those of the British 1921 Census—as perhaps one might expect® from general considerations. While very young wives had husbands considerably older, the difference in age narrows with advancing age of wives, until at about age 77 the average age of husbands is about the same ; after this, the average age of husbands is less than that of wives. Conversely, young husbands are married to wives older than themselves—although the difference is not so great as it is in the case of young wives—but equality in age is reached about age 27, after which the difference in age widens gradually up to the highest ages.
Probabilities of Issue.
We seem to have no information in regard to the probabilities of birth to men or women at each age. The age of parents is not recorded on the Birth Register, and there is, therefore, no possibility of securing direct information. At the inception of the National Health Insurance Scheme in 1911, it was necessary to obtain some rates in order to assess the value of the maternity benefits, and recourse had to be made to certain New Zealand statistics of families left by fathers who had died ; the rates were subsequently modified to accord with the experience of selected approved 'societies in Great Britain, but the experience in Eire is not available.
By W. A. Honohan, M.A., F.l.A. 395
from the high rate of births in Dublin City (a crude rate in 1942 of 25-0 legitimate births per 1,000 of the population, as compared with 21-5 for4
the whole country), that the probabilities for the City are not applicable to the country in general. It is suggested, however, that reasonable rates for the whole country might be obtained by adjusting the City rates to produce the lower proportion of total births.
[image:15.391.36.340.115.269.2]Specimen values from the Appendix are reproduced in the following table, which gives also the corresponding rates in the National Health Insurance (Valuation) Regulations, 1936, i.e. rates based on the experience of the British insured population.
TABLE _XII
Probabilities of Issue within a Year—Married Women
Age
Dublin d t y , 1942 British Insured
Population, 1936
16
•660
•400 20
.•606
•603 25
•486
•359 30
•349
•261 35
•227
•194 40
•108
•106 45
•024
•022
Probabilities of issue for married men might be obtained by using the information available in respect of the ages of husbands and wives. Size of Families.
In 1926—but not in 1936—information was obtained as to the numbep of dependents under age 16 left by married men, married women, widowers or widows, according to the age of the deceased. The particulars are set out in detail in Vol. IX of the Census, and some comparisons with cor-responding British figures are given in the General Census Report (p. 144). For actuarial purposes, the information is defective, as it ignores the ages of the children, a point of importance in connection with the duration of orphan benefits.
In this connection, it is an interesting question whether the sizes of families left by persons dying at any age are much different from those of persons living at the same age. There is evidence to show—as one might expect—that the families left by parents dying are somewhat smaller than those of parents living. For instance, New Zealand Census statistics of the families of fathers show, for children under age 16, •differences of from 5 to 7 per cent.
Sickness Experience.
TABLE XIII
Average Number of Weeks of Incapacity per Member during the Year.
Experience of the National Health Insurance Society, 1936-38. GBEAT BRITAIN : Rates adopted in the National Health Insurance Valuations, 1938.
Age Group
16-20 20-25 25-30 30-35 35-40 40-45 45-50 50-55 55-60 60-65 65-70
Men
$ire
•62 •85 1-04 1-24 1-52 1-94 2-65 3-58 5 1 1 9 0 3 19-46
Gt. Britain
•86 •85 •94 106 1-26 1-57 1-95 2 7 4 4 0 8 6-60
t
Spinsters and Widows
fiire
1-16 1-91 2-47 3-23 3-78 5 1 5 6-75 8-75 11-68 18-39 29-24
Gt. Britain
•99 1-38 1-72 1-96 2-20 2-58 3 1 3 3-92 5-18 7-47
t
Married
fiire
4 1 1 5-90 7-52 7-20 8-20 9 1 7 12-87 16-80 21-01 31-60
Women
Gt. Britain
3-95 3-69 3-58 3-70 4 1 2 4-88 6 0 8 7-92 10-86
t
* The rates for married women for age-group, 16-20, are omitted, as the data on which they are based is too small to enable reliable conclusions to be drawn.
f Benefits cease at age of 65 (the pension age) in Great Britain.
The rates of sickness in Sire are so much higher than the British rates (which are based on the experience of representative approved societies there) as to constitute a matter of some concern.
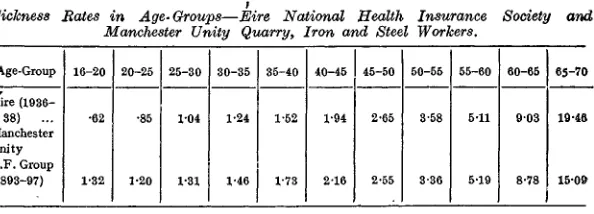
As a further demonstration of this point, I give in Table XIV a com-parison of the Eire male rates with those of the 1893-7 experience of the Quarry, Iron and Steel, etc., Workers group of the Manchester Unity Society of Oddfellows—one of the largest friendly societies in Britain (then with almost 600,000 members). This group—known as the E.F. Group—had the worst sickness experience of any group in the Society.
TABLE XIV
Sickness .
Age-Group
Eire (1936-38) .., Manchester Unity E.F. Group (X893-97)
Rates in Age-Groups—Eire National Manchester Unity Quarry, j
16-20
•62
1-32 20-25
•85
1-20 25-30
1-04
1-31 30-35
1-24
1-46 35-40
1-52
1-73
Health Insurance Iron and Steel Workers.
40-45
1-94
2-16 45-50
2-65
2-55 50-55
3-58
3-36 55-60
5-11
5-19
Society and
60-65
9 0 3
8-78
65-70
19-45
15-0&
On the whole, I find that this group of the Manchester Unity Society gives sickness rates more nearly akin to those of the Eire Insurance Society than any of its other groupings. I t is really a serious matter to find that we, in 1936-38, have as heavy a sickness experience as a representative group of the Quarry, Iron and Steel Workers in Great Britain had forty years ago.
^05Cn^WtOi—O < O<I<Ita^0©G 0 tOtOfcOfc«ls3tOtOb5IS»b3bStOlNOb«tOtOtOtOtOb3tOtOI ^ 6i-"o o C D © t o W 0 0 b b b b O i rfx C O MHHMH<HHHHHHMHHHMHHHHHHHb5tCMl^lOb5t4}WWMt«WtOb3MbSMWtOWWWbat«l!O M WWi^^i^Oi^C^©Qffi^^^^COC»QOCOCpcpcO©OOOOOHMi-HHMMWt3bS M CO<^050^©^Co6i6iC»OH^tic0^6t6-i65*»-C 5 _-.._ - .
. H
*> • |f» . ^ U ) © H ' C O ~ 3 CD>-'0OCO<l©t^O5C O tObCtOLsStOtStSls5l^b»b3tOtOtN3t«bOfcOtOb ^ . . . . . „ » ^ ^ ^ -«-.-.« , „ . ^ „ _ _ — — « j « ^ » 4 ^ 0 0 Q O 0 0 Q O <X > <X > ^ C O © © © © © © © C O __. . _ . _ _ _. . _ . _ _ . _ _ . _ _ _ _ _ . _ . . ^coc^o^©wc^db©cooT-J©tooa6x6i<i-J © tO^(^<l©OW^OiOia5^K)005WQOW^HWO(050i050lWMCO^O^CDMCnO^OOWl»W©WOObS01COOO " " " ' " " 03bOCX)COl^CO©GOH-^WCO^COOOO(^<^QO|vSQOOiC^OOOTC55COOXrfi«. " ~ _ _ -U^^#^l^^^^& : ^ *1 M
^ ^1^ ^ 5S
398
A P P E N D I X A—{continued.)
Age 55 56 §7 58 .59 60 61 62 63 64 65 66 67 68 69 70 71 72 73 74 75 • 76 77 78 79 80 81 82 83 84 85 86 «7 88 89 90 91 92 93 94 95 96-97 98 99 Present 24% 14-321 13-889 13-457 13-027 12-600 12-176 11-755 11-339 10-925 10-518 10-113 9-712 9-314 8-920 8-533 8-152 7-778 7-415 7-064 6-729 6-409 6-106 5-820 5-551 5-298 5-060 4-835 4-618 4-412 4-213 4-022 3-837 3-707 3-543 3-384 3-228 3-073 2-918 2-759 2-590 2-403 2-189 1-928 1-591 1-129
value of <
Male 3 % 13-635 13-241 12-847 12-454 12-063 11-671 11-281 10-896 10-513 10-13U 9-757 , 9-380 9-007 8-637 8-272 7-911 7-557 7-211 6-879 6-558 6-253 5-962 5-688 5-431 5-188 4-958 4-740 4-532 4-333 4-141 3-956 3-775 3-651 3-491 3-337 3-185 3-035 2-883 2-728 2-564 2-382 2-171 1-915 1-582 1-126 mnuity oJ a t the a£
3J% 13-004 12-645 12-285 11-923 11-561 11-201 10-841 10-484 10-128 9-773 9-420 9-069 8-718 8-368 8-023 7-683 7-347 7-019 6-701 6-395 6-102 5-826 5-562 . 5-314 5-080 4-861 4-650 4-449 4-256 4-070 3-891 3-716 3-596 3-441 3-290 3-144 2-997 2-850 2-699 2-539 2-360 2-155 1-902 1-575 1-122
* 1 per annum commencing *e stated 2i% 14-899 14-471 14-038 13-604 13-173 12-750 12-334 11-921 11-511 11-104 10-697 • 10-296 9-898 9-505 9-115 8-733 8-359 7-993 7-641 7-302 6-981 6-676 6-389 6-117 5-863 5-624 5-400 5-179 4-971 4-771 4-578 4-393 4-212 4-036 3-863 3-690 3-516 3-336 3-147 2-943 2-714 2-447 2-125 1-719 1-189 Female 3% 14-157 13-768 13-374 12-978 12-585 12-196 11-813 11-432 11-053 10-675 10-299 9-924 9-552 9-182 8-817 8-457 8-103 7-758 7-423 7-103 6-796 6-505 6-230 5-972 5-728 5-498 5-281 5-072 4-871 4-680 4-495 4-315 4-140 3-971 3-803 3-636 3-467 3-293 3-109 2-910 2-686 2-426 2-109 1-710 1-185 3J% 13-476 13-123 12-764 12-401 12-040 11-682 11-329 10-977 10-626 10-275 9-924 9-575 9-226 8-880 8-536 8-196 7-862 7-535 7-217 6-912 6-619 6-342 6-080 5-832 5-600 5-379 5-169 4.969 4-776 4-591 4-412 4-239 4-071 3-908 3-745 3-584 3-420 3-251 3-073 2-879 2-661 2-406 2-095 1-701 1-189 Present Value of 1 payable on
the death of a life now of the age Male 3 % •59697 •60861 •62026 •63188 •64343 •65502 •66655 •67793 •68925 •70045 •71160 •72273 •73376 •74469 •75548 •76615 •77662 •78685 •79666 •80615 •81517 •82377 •83187 •83946 •84665 •85345 •85989 •86604 •87192 •87760 •88307 •88841 •89208 •89681 •90136 •90585 •91029 •91478 •91937 •92421 •92960 •93582 •94239 •95324 •96672 stated Female 3% •58154 •59304 •60468 •61639 •62800 •63950 •65082 •66209 •6732$ •68446 •69558 •70666 •71766 •728SS •73937 •75001 •7604g •77061 •78Q6& •79004 •79911 •80772 •81585 •82347 •83Q6.9 •8374$ •843^0 •8500a •85602 •86167 •86714 •87246 •8776S •8828$ •8875S •89252 •89752 •90266 •90810 •91398 •92061 •9282$ •93766 •94946 •96498
NOTES : (1) The annuity values which assume that payments are made even.lv t>ver each year, were calculated by means of the formula
/ 100- x
L\ y ix+t{i+iy
M fci
.
.
.
.
ire lx and dx are the usual functions of the life table ; i is the rate of interest
By W. A. Honokan, M.A., FLA.
APPENDIX B
Functions based on Marriage and Issue Data
399 Age 15 16 17 18 19 20 21 22 23 24 25 26 27 28 29 30 31 32 33 34 35 36 37 38 39 40 41 42 43 44 45 46 47 48 . 49 50 51 52 53 54 55 56 57 58 59 60 Proportions Married Males •000 •000 •000 •001 •003 •008 •018 •033 •053 •078 •111 •137 •171 •210 •262 •283 •342 •363 •404 •412 •445 •480 •518 •520 •559 •526 •598 •589 •615 •613 •588 •614 •635 •619 •634 •590 •634 •635 •649 •631 •622 •634 •643 •629 •632 •606 Females •000 •002 005 •014 •029 •056 092 •131 •176 •224 •268 •312 •355 •400 •456 •481 •544 •548 •583 •589 •607 •627 •649 •659 •677 •662 •688 •670 •681 •681 •656 •653 •658 •653 •646 •618 •626 •616 •617 •603 •595 •580 •570 •555 •541 •507 Probabilities of Marriage within a
year Males 00100 •00199 •00501 •01006 •01525 •02064 •02529 •02919 •03342 •03803 •04314 •05134 •05280 •05296 •05151 •04966 •04736 •04456 •04304 •04127 •03910 •03664 •03594 •03507 •03405 •03197 •02918 •02503 •02052 •01575 •01061 •01075 •01090 •01098 •00831 •00563 •00450 •00330 •00240 •00150 •00065 . — Females •00199 •00299 •00702 •01515 •02770 •03798 •04496 •05167 •05813 •05658 •06000 •06235 •06652 •06961 •07482 •08091 •05867 •04456 •04427 •04392 •04337 •04001 •03614 •02884 •01778 •01211 •00613 •00350 •00200 •00100 •00050 —. —. —. —• . —. —-—. . — —. Probabili-ties of Issue within a year Wives _ •660 •652 •639 •624 •606 •586 •564 •539 •513 •486 •458 •430 •402 •375 •349 •324 •300 •275 •251 •227 •202 •178 •154 •130 •108 •086 •066 •049 •035 •024 •015 •007 —. —. — — —. —. —. . — — —. Age 0 1 2 3 4 5 6 7 8 9 10 11 12 13 14 15 16 17 18 19 20 • 21 22 23 24 25 26 27 28 29 30 31 32 33 34 35 36 37 38 39 40 41 42 43 44 45
P.V. of Ann. of 1 per aim. ceasing on Death or Marriage 3°/o Females 19-677 20-596 20-387 20-078 19-735 19-372 18-95.7 18-572 18143 17-698 17-237 16-760 16-270 15-766 15-249 14-720 14-206 13-694 13-224 12-850 12-629 12-537 12-536 12-631 12-827 13019 13-281 13-603 14025 14-542 15-207 16-062' 16-609 16-952 17-318 17-709 18125 18-506 18-842 19-059 19070 18-975 18-764 18-498 18-196 17-867 NOTES : (1) The proportions married are the crude figures calculated from the 1936 Census data.
(2) The probabilities of marriage are calculated by means of the formula— {hx+ i lx+i- hx Ix ( 1 - qx)} I 1 ( 1 — hx) Ix ( 1 — fax)}
ivhere Ix and qx are the usual functions of the life table and hx is the proportion
married at age x - graduated figures.
# (3) The derivation of the probabilities of issue is explained in the paper.
(4) The. annuity values are calculated by means of the formula given Ttuadfer note (1) in Appendix A except that the functions lx and dx are taken from a
DISCUSSION ON MR. HONOHAN'S PAPER
Mr. D. H. Shaw, proposing the vote of thanks, said that until recently all life assurance business was written by Offices outside the country, but following official support given to the establishment of a strong foundation for this business within Ireland the volume of new business written has increased considerably. It will be possible soon to take out the Irish experience but the body of data available will be very small compared with that obtained for the British Offices' experience J924 to 1929 and subsequently. The business available relating to life tenants is negligible. A considerable volume of ordinary life assurance business relates to lives entered over age 35 and the average age at entry is nearly 35.
The distribution of Male Staffs in the Banks reflects the influx some 20 years ago and this will have the effect of raising the charge for pensions outgo in the future to over 2 J times the present figure. The Civil Service Staff over age 65 would not appear to include pensioners whereas these seem to be included in the Bank Staffs under Table IV. It would be interesting to know the number of cases of retirements on permanent ill-health pensions included in the ill-health retirements of the Civil Service Staff given on page 389 within age groups.
Referring to the national statistics he thought that following the. improved results obtained from the dates of birth for the live population it would be a great advance if something could be done to get correct ages in t i e registration of deaths. It is a difficult matter but the mis-statement of ages at present presents a real problem in extracting the death rates as .it is not just a question of redistribution. Very valuable information would also be obtained if particulars of parents' ages, dates of marriage, and previous children were supplied in the registration of births. The possibility of a card system for the whole population might be worth consideration.
The figure of capital liability for pensions, which would be very much greater if persons under age 60 were included, is important for the calculation of contributions but in considering the cost of such schemes estimates of future income and outgo would be essential. Under the recent British scheme figures based on projected rates were mentioned but the estimates supplied by the Government Actuary assumed constant (pre-war) fertility and mortality rates. In Ireland a change in the proportion married at the younger ages under Table X could make a very considerable difference in the future population. He thought that projected rates of fertility and mortality should be taken into account in estimates of the cost of any schemes, and certainly this should be done in calculating contribution rates. The problem in this country as regards schemes of national insurance might, however, be one requiring quite different treatment, and this should receive careful thought before we assume that our most pressing needs are met by schemes similar to those adopted in other countries.
401
fantastic without comprehensive and accurate statistical data. Mr. Honohan's paper shows conclusively that statistics are a necessity und not a luxury in an age of increasing governmental intervention in social and economic life. And to a layman, perhaps the most valuable contribution of the early part of the paper is the demonstration that the inaccurate interpretation of reliable statistics can be even more deplorable in its results than the complete absence of data. This issue is first indicated in page 385 and the emphasis is maintained throughout by the paper's preoccupation with the supreme importance of age-distribution as a feature of census returns. It is indeed true that this feature is of " more than technical interest . . . in these days of planning social schemes for the future," so much so, that by disregarding age-groups, and overlooking their implications by concentrating on mere aggregates of total population, many popular publicists have solemnly prescribed as " cures" for unemployment and under-education the reduction by half in the size of a community.
As Mr. Whitaker has stated, it is unfortunately a fact that due to the big percentage of persons in our over-65 age group, the labour force under that age must be prepared to shoulder an increasing burden. It is a pity that so many unthinking advocates of social security measures omit to take adequate account of this phenomenon, and to realise that the greater the proportion of people who have retired from productive employment the greater are demands on the labour force of the com-munity who are responsible for the maintenance of the national income. There is, I suppose, some consolation in the knowledge that this pheno-menon of an ageing population is common to all Europe, but that the rate is faster in the West than in the East. I t has been said that to move Eastwards is to go back in time. This is supported by considering the demographic circumstances of Soviet Russia, where the inevitability of an ageing population has been demonstrated in recent projections. It is of interest, however, to note that this problem is more serious for an industrial economy than for an agricultural one. Industrialism, with all its complex mechanization, requires the freshness, vitality and adaptability of youth to maintain efficiency and high output. In agriculture, however, thanks to the simplicity of the processes involved, the labour force can be expected to maintain its productive capacity to an age much greater than- 65. It is true, I suppose, that in an indus-trial economy the disadvantage of a decline in the earlier age-groups oan be offset, temporarily, by an increase in mechanization, but the law of diminishing returns sets a limit to the extent that this substitution of technical innovation is possible.
that by adopting a policy of borrowing money from the community instead of obtaining it by taxation, a government is enabled to pass the cost of a war on to posterity ; the truth is that the money cost merely represents the real cost which must be borne by the generation righting the war. I exclude, of course, all questions of external borrowing, which are not relevant to the matter under discussion. If there is a flaw in this analysis, no doubt the lecturer will refer to it in his reply. In the meantime, I want to reiterate my appreciation of a timely, significant and a most suggestive paper.
Dr. Geary said that he had slight—but only slight—qualms about the propriety of computing, as the lecturer had done for Appendix B, marriage probabilities from census data. He (Dr. Geary) assumed that, had the figures been available, Mr. Honohan would have preferred to base the probabilities on the number of marriages in the years from the census year, classified by ages of persons married, in conjunction with the census statistics of numbers of bachelors of these ages ; in other words, that the marriage table should be computed exactly on the lines of the Life Table. He (Dr. Geary) agreed with Mr. Shaw that it would be very desirable that the statistics of marriages should be com-piled in this manner and that the statistics of births should, on a national scale, be classified by age of mother, order of birth, etc., as Mr. Lyon had done for his well-known Statistical Society paper. His (Dr. Geary's) qualms were, he confessed, to some extent allayed by the convincing " cheek which Mr. Honohan had given at the top of page 393. Actually the comparison even for males was very good, and the slight discrepancy was perhaps due more to the abberations of smoothing and to the fact that at the 1936 Census the number of married men were slightly fewer than the number of "married women, than to inaccuracy in the census data.
Dr. Geary said that some time ago he had occasion to prepare tables for certain younger ages purporting to indicate the. life-migration-marital-occupational history of females at prevailing rates, as the Life Table does, taking account of mortality alone. This inquiry showed, for example, that of 1,000 females living at age 13 A there would be left about 900 at age 34 ; of this 900, 400 would have emigrated, and of the 500 remaining in the State, 300 would have married, and of the 200 unmarried, 50 would be occupied and 150 would be unoccupied.
As to the question of the ageing of the population, Dr. Geary said that his estimates of the future trend, to which Mr. Honohan had referred, did not indicate a serious increase in the proportion of elderly people in the population, though there would probably be an increase for a decade or so to come.
403
to the value of things in terms of money, both now and in the future. Whether or not, as Mr. Lynch seems to suggest—although I find it hard to agree—it will all work out more or less the sani3 in the long run, it is primarily the aspect of rights and obligations which I have in mind. In this connection two points seem to be clear enough, first, that the children born to-day are being saddled with more and more obligations to the community and, so burdened, are being prevented from developing free and unfettered lives, and, secondly, that the present generation is being placed in the position of having moral claims, while the provision of means to meet those claims is being left to an entirely different genera-tion. The following passages from the British White Paper on Social Insurance (Part I Cmd. 6550) are significant as indicating the modern feeling towards these matters :—
(i) " . . . the Government feel that, although accruing rights under existing schemes need not be preserved in all cases . . . "
(par. 121) and
(ii) " in the preparation of a nation-wide scheme of social insurance, which must of necessity undergo many changes in its develop-ment, it would be neither practicable nor desirable to lay down a hard and fast rule that all accruing rights must be safeguarded on each occasion of change " (par. 182).
The ill-health retirements from the Civil Service were all medically-certified cases, but would, not all qualify for pension. For instance, there is a 10-year period after recruitment during which no pension is granted for retirement on health grounds. Their apparently large numbers should be read in conjunction with the small numbers of deaths in service as compared with the deaths in the population. Many of the ill-health retirements presumably result in early deaths, thus helping to restore the balance.
There is no intention to criticise the Irish Insurance Companies or anyone else for not publishing their experiences ; the paper simply gave a summary of the facts t)f the situation. The reference to new business being taken out mostly at ages under 35 was based on British experience, and it was interesting to hear from Mr. Shaw that the average age for His Company's business was just under 35. The statement was, therefore, probably applicable to Irish business also, but, if there was a much larger proportion of business taken out in Great Britain under age 35 than in Ireland, is this not an argument in favour of giving great publicity to the features of Irish business ?
With regard to Dr. Geary's remarks about the preparation of the marriage probabilities, it is undoubtedly the case that better rates would be obtained if we had the ages at marriage. The proportions married, which reflected the marriage rates of various years in the .past, were the next best thing available. As these had remained fairly stationary over a long period, it is suggested, especially having regard to the satis-factory results of the test made, that reasonably good probabilities had been constructed. The trivial effect of graduating the proportions married would hardly account for the differences shown in the test between the male and female rates.