A silicon microfluidic ultrasonic separator
N.R. Harris
a,∗, M. Hill
b, S. Beeby
a, Y. Shen
b, N.M. White
a,
J.J. Hawkes
c, W.T. Coakley
caDepartment of Electronics and Computer Science, University of Southampton, Southampton SO17 1BJ, UK bSchool of Engineering Sciences, University of Southampton, Southampton SO17 1BJ, UK
cCardiff School of Biosciences, Cardiff University, PO Box 915, Cardiff CF10 3TL, UK
Abstract
Ultrasonic standing waves can be used to generate forces on particles within a fluid. Such forces have a number of potential applications in microfluidic devices. This paper describes a device that provides filtration on a microfluidic scale. It is microfabricated and uses ultrasound in the megahertz frequency range to concentrate particles at a node within the flow. It offers the possibility of a functional equivalent of a centrifugal separator for microfluidic systems. It is constructed using silicon and Pyrex, and hence is compatible with established microfabrication techniques. The modelling, design, fabrication and control of the device are discussed.
© 2003 Elsevier B.V. All rights reserved.
Keywords: Microfluidic; Microengineering; Ultrasonic
1. Introduction
High frequency, acoustic standing waves can be used to separate materials with different acoustic impedances. The technique can be used to agglomerate particles, to hold par-ticles within a flow, or to manipulate parpar-ticles with the flow
[1]. The device described in this paper falls into the lat-ter category, as it is a microfluidic flow through separator, and is an extension of previous work performed by Hawkes and Coakley[2]into similar devices fabricated using tradi-tional rather than microfabrication techniques. The device is fabricated in silicon and Pyrex and, as such, is able to exploit standard silicon processes. Driving is achieved via a bonded PZT plate, although future developments will use
a thick-film PZT actuator [3]. Fig. 1 shows a schematic
cross-section of the prototype.
2. Principle of operation
A fluid/particle mixture is drawn into the device through the port on the left ofFig. 1. An acoustic standing wave, of a half wavelength, is maintained within the cavity and as the particles move through the field they migrate to the pressure node at the centre of the cavity as is shown by the idealised pressure profile inFig. 2. A fraction of the particle-free fluid
∗Corresponding author. Tel.:+44-2380-593-667.
E-mail address: nrh@ecs.soton.ac.uk (N.R. Harris).
can then be drawn from the “clean” outlet and the remainder of the fluid/particle mixture can be drawn from the final, dirty outlet. Such a scheme allows for a relatively small quantity of clarified fluid to be produced. Different geometries have the potential to increase the proportion of clarified fluid re-covered, or alternatively to increase the concentration of the particles recovered from the “dirty” outlet. A separator with the ability to clarify samples or concentrate particles within a sample has important potential applications in integrated microfluidic sensing systems.
3. Modelling
Previous work [4] has allowed the characterisation and
validation of a multi-layered resonant structure, constructed in stainless steel, and this has been extended to include the silicon/Pyrex construction described here. Amongst impor-tant variables that can be adjusted are:
• the depth of the cavity,
• the thickness of the Pyrex layer,
• the thickness of the silicon layer.
The basic structure modelled is shown inFig. 3and con-sists of several layers, whose physical parameters can be altered according to the structure being modelled, and is composed of a piezoelectric transducer, a layer of adhesive, a silicon layer, a filtration chamber filled with fluid (in this case water), and a Pyrex reflector plate. The parameters of
Fig. 2. Pressure profile through half wavelength cavity with rigid bound-aries.
the layers can be altered, according to the structure being modelled. For example, changing the parameters of the fluid layer to those of air result in a model of an empty cell, which is useful for isolating the effects of the PZT and silicon layers. The model assumes that the concentration of particles is not high enough to disrupt the acoustic field significantly.
The currently available outputs from the model are:
• impedance seen looking into the device,
• voltage seen when driven from a 50driving stage,
• acoustic force,
Fig. 3. Basic structure for modelling.
only for stainless steel construction. It is, however, still im-portant to verify the model with silicon and Pyrex and be-cause many of the acoustic figure of merit parameters (such as stored energy and performance number) are not directly accessible, validation has to be undertaken by comparing the accessible electrical parameters (such as measured volt-age or impedance) with an experimental device. Before any validation can be achieved, a reference device has to be con-structed, and so a best estimate of key parameters was made and model predictions were undertaken.
Modelling of the system, as described by Hill and Wood
[5], has indicated that the most critical parameter in deter-mining the operating frequency of the device is the depth of the cavity. In order to allow direct comparison with the per-formance of the stainless steel filter described by Hawkes
and Coakley [2], the target cavity depth was 250m, to
[image:2.842.127.216.189.382.2] [image:2.842.167.435.588.721.2]Fig. 4. Comparison of experimental (dotted) and modelled data for the Cardiff stainless steel cell.
of 525m, when used with a standard thickness Pyrex wafer of 1.7 mm with a cavity depth of 240m. To illustrate the effect that cavity depth has on the predicted performance,
Fig. 5should be considered.
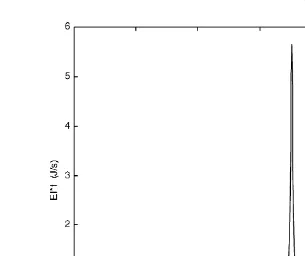
This shows the variation of the stored energy frequency product as a function of cavity depth, when the total thick-ness of both Pyrex and cavity is fixed at 1.7 mm. As can be seen, the stored energy frequency product (a measure of the energy stored in the standing wave) reaches a peak at about
240m. With a frequency of 3 MHz and cavity lateral
di-Fig. 5. Variation of performance with cavity depth.
mensions of 5 mm wide by 12 mm long, this equates to an energy density of about 44 J/m3.
[image:3.842.154.431.494.718.2]Fig. 6. Comparison of the performance of stainless steel (dashed) and silicon devices.
If the stored energy frequency curves are compared with the original stainless steel cell we can see that the curve for the silicon device has just one dominant peak (Fig. 6). De-spite a wide tolerance on peak magnitudes due to uncertain-ties in material parameters, these simulated results suggest that the silicon-fabricated device should perform at least as well as the steel chamber.
5. Construction
Two types of device were fabricated; one with double chamfered ports and one with single chamfers. In order to achieve this, double-sided wafer processing was required. This was achieved using a double-sided alignment process and standard wet KOH etching leaving chamfers at the
an-gle of 54.7◦. The chamber was then formed by etching a
1.7 mm thick Pyrex wafer to the desired depth of 240m.
This was achieved with a 30 min etch in 48% buffered hy-drofluoric acid using a chrome/gold mask (50 and 500 nm thick, respectively) and Shipley S1818 resist in order to min-imise pinholes. The silicon and Pyrex wafer were then
an-odically bonded together.Fig. 6shows a SEM of a single
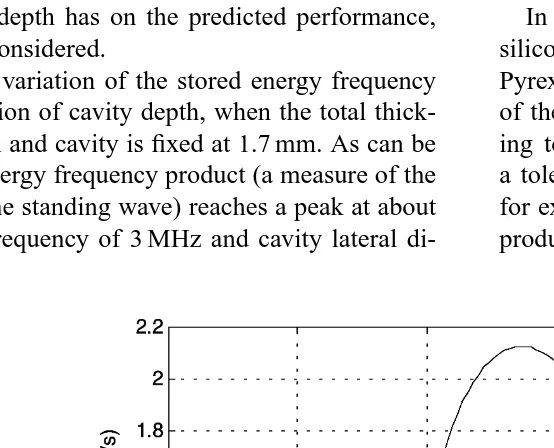
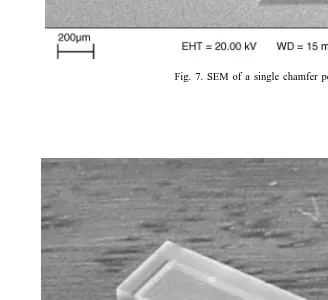
chamfer port, and the section of the Pyrex cavity. These two different port profiles were selected because although the single chamfered port is easier to manufacture, there may be some fluid flow advantages in the double chamfered pro-file. Future experimental work will address this aspect, al-though some initial computational fluid dynamic results are reported by Hill et al.[6].Fig. 7shows a SEM of a single chamfer port, and a section of the Pyrex cavity, whileFig. 8
shows a photograph of the finished separator mounted on a Perspex manifold, to allow easy connection of pipe work.
6. Impedance measurements
In order to verify the validity of the model against the fab-ricated device, an impedance analyser was used. The instru-ment used was a Hewlett Packard 4192A frequency anal-yser, under PC control. Initially, measurements were taken with both 0.5 and 1 V excitation amplitudes. As no mea-surable difference was noted, all subsequent measurements were taken at an excitation voltage of 1 V.
The approach taken was to verify the model a layer at a time in order to reduce the number of degrees of free-dom, and thus uncertainty in the various parameters of the layers. The first part of the model that required refinement was the response of the PZT driving element in isolation, and its impedance trace was taken. The transducer model parameters were then adjusted to give a good match. The graph (Fig. 9) shows the match obtained. It is very impor-tant to get the transducer data as close as possible to the experimental results as this is effectively the input to the model system, and so has a profound effect on the output data.
The next layer in the model is the glue layer. This has an uncertainty associated with it, as the acoustic and material parameters of the glue have to be estimated. It is possible to reduce the uncertainty in the layer thickness by the simple expedient of sectioning another device and measuring the thickness using the SEM. This was duely done and the layer
was measured to be between 8 and 10m.
Fig. 7. SEM of a single chamfer port.
[image:5.842.130.458.418.718.2]Fig. 9. Modelled (solid) and measured (dashed) results for the transducer in isolation.
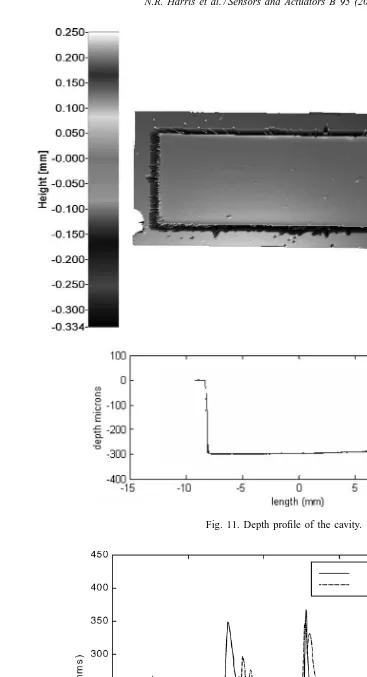
The next part of the model is the cavity, which is made significant by introducing a fluid such as water into it, rather than having it filled with air. The key physical parameter that can be measured directly is the cavity depth. This was checked with an optical, non-contact form measurement sys-tem, which indicated that the cavity had been over-etched to an average of about 290m and was not entirely flat, and so the cavity resonance is expected to be lower than the
origi-Fig. 10. Modelled (solid) and measured (dashed) results for the transducer and silicon layer.
nal predicted value as indicated inFig. 5. The depth profile is shown inFig. 11.
The device was filled with water and impedance mea-surements were taken. Again the modified predicted and
measured results are shown (Fig. 12), and a good match
[image:6.842.146.456.475.720.2]Fig. 11. Depth profile of the cavity.
Fig. 13. Predicted separator performance.
Fig. 14. Controller system diagram.
fluid’s acoustic properties, as will the concentration of the particles to be separated. This trace is the response of the complete cell, because as soon as the cavity is brought into play, the Pyrex backing layer also has to be included.
The main feature to note is that the trace now shows two clear peaks. The higher frequency peak is due to the cavity resonance and the lower frequency peak is mainly a function of the transducer resonance as indicated inFig. 12.
These results give an indication that the model is giving good results in terms of impedance predictions and, by ex-tension through the stainless steel results, the other outputs will also be reliable. Now it is necessary to analyse the pre-dicted separation performance. For this the stored energy frequency product is the preferred variable, and the output from the model for this parameter is given below inFig. 13.
In comparison with the original best estimate predic-tions given in Fig. 6, it can be seen that the peak stored energy frequency product number is greater than the orig-inal predictions (but of the same order of magnitude), but the peak occurs at a different frequency. This is, in the main, due to the cavity depth being over etched to 0.29 mm rather than the nominal 0.25 mm. The re-sults, however, indicate that the device will function as a separator.
7. Controller
[image:8.842.160.443.353.525.2]Fig. 15. Example of the voltage trace seen by the controller.
2.75 MHz. This coincides with the peak of the energy storage in the chamber. As already indicated, the frequency of this null may move around slightly, as the fluid temperature, or the concentration of particles may alter. This requires some form of closed loop controller. It is possible to implement a flexible controller using a microcontroller, which closes the loop by sampling the transducer voltage, and using this to make adjustments to a voltage-controlled oscillator. The con-struction of a flexible controller such as this also allows the transducer voltage information to be extracted, together with the frequency information, hence allowing detailed monitor-ing and data loggmonitor-ing of these parameters. A system diagram of the controller is given inFig. 14and gives an indication of the flexibility of the system. In particular a two line LCD dis-play has been incorporated, allowing local indication of pa-rameters such as frequency or voltage measurements, as well as an RS232 serial interface allowing PC control and data logging.
The system is programmed in C, allowing rapid
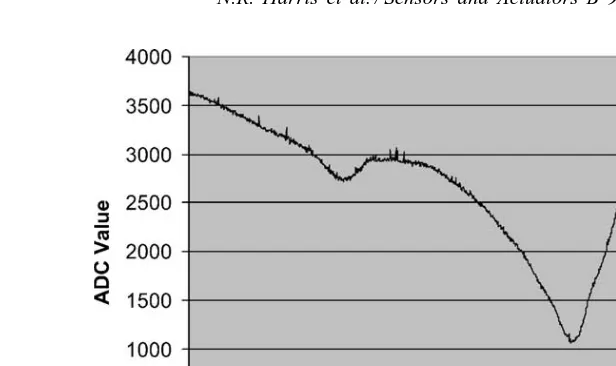
imple-mentation of programs. Fig. 15shows an example output
of the analogue to digital converter raw value against fre-quency, as measured by the controller and logged to a PC. The cavity resonance can clearly be extracted as it corre-sponds to a null in the measured voltage across the cell at about 2.73 MHz in this case.
8. Conclusions
A micromachined microfluidic ultrasonic separator has been modelled, designed and built using standard micro-machining processes. The results from the model com-pare favourably with the results obtained from a previous separator built in stainless steel. By a process of mea-suring impedance, and using the results to refine the model a layer at a time, it has been possible to produce a model that gives high confidence of predicting
sepa-rator performance. A flexible digital controller has been designed and built and is able to identify the operation point. Work is ongoing to test the separation perfor-mance of the device and develop the concept to include a thick-film PZT actuator rather than the bulk PZT currently used.
Acknowledgements
The authors wish to thank the Engineering and Physical Research Council (EPSRC) for their financial support under grant number GR/R13333/01. We also gratefully acknowl-edge the Financial support given by Dstl and Microfiltrex Ltd. and the assistance of Dr. Christian Maul of TaiCaan Technologies for the use of their non-contact 3D profiling system.
References
[1] M. Groschl, Ultrasonic separation of suspended particles. Part I. Fun-damentals, Acustica 84 (3) (1998) 432–447.
[2] J.J. Hawkes, W.T. Coakley, Force field particle filter, combining ultra-sound standing waves and laminar flow, Sens. Actuators B 75 (2001) 213–222.
[3] N. Harris, M. Koch, S. Beeby, N.M. White, A.G.R. Evans, Thick-film printing of PZT onto silicon for micromechanical applications, in: Proceedings of the Ninth Micromechanics Europe Workshop, 1998, pp. 78–81.
[4] M. Hill, Y. Shen, J.J. Hawkes, Modelling of layered resonators for ultrasonic separation, Ultrasonics 40 (2002) 385–392.
[5] M. Hill, R.J.K. Wood, Modelling in the design of a flow-through ultrasonic separator, Ultrasonics 38 (2000) 662–665.
finite element modelling and design of MEMS devices, silicon processing and MEMS packaging and testing. He currently has over 40 publications in the field.
Yijun Shen was a research student in the school of engineering sciences,
and has recently submitted his thesis for the degree of PhD in the field of acoustic modelling. His main interest has been in modelling
W.T. Coakley obtained an MSc degree in experimental physics at