higher, controlled temperatures to force the solutes into the gas phase. Each of these gas-phase methods have been modiRed for use with the SPME approach to solute trapping.
Future Directions
Chemical extractions are thought to be a mature science. However, progress is still being made. The key inSuences driving these advances include the need for faster and more selective extractions and extrac-tions that use smaller (if any) amounts of organic solvents. Better predictive models to aid the design and scale-up of extraction processes will also continue to be of great interest.
Further Reading
Barton AFM (ed.) (1990) Handbook of Polymer}Liquid Interaction Parameters and Solubility Parameters. Boca Raton: CRC Press.
Dean JR (1990) Extraction Methods for Environmental Analysis. New York: John Wiley&Sons.
Giddings JC (1991)UniTed Separation Science. New York: John Wiley&Sons.
Handley AJ (ed.) (1999) Extraction Methods in Organic Analysis. ShefReld: ShefReld Academic Press.
Karger BL, Snyder LR and Horvath C (1973)An Introduc-tion to SeparaIntroduc-tion Science. New York: John Wiley &Sons.
Lide DR (ed.) (1994)Handbook of Organic Solvents. Boca Raton: CRC Press.
Morrison GH and Freiser H (1957) Solvent Extraction in Analytical Chemistry. New York: John Wiley&Sons. Perry RH and Green DW (eds) (1997)Perry’s Chemical Engineer’s Handbook, 7th edn. New York: McGraw-Hill.
Rydberg J, Musikas C and Choppin GR (eds) (1992) Principles and Practice of Solvent Extraction. New York: Marcel-Dekker.
Wolf FJ (1969)Separation Methods in Organic Chemistry and Biochemistry. New York: Academic Press.
FLOTATION
E. Woodburn, UMIST, Manchester, UK
Copyright^ 2000 Academic Press
Introduction
Overview of the Essential Elements of Separations Based on Froth Flotation
The objective of aSotation separation operation is to remove small hydrophobic particles from an aqueous suspension (pulp) by causing them to collide with, and to attach to, air bubbles. The bubble}particle aggregates rise through the suspension forming a froth at the upper surface of the pulp. The froth, which consists of the bubble}particle aggregates with inter-bubble water containing both hydrophobic and hydrophilic particles, forms a second phase where further enhancement of the hydrophobic/hydrophilic particle separation occurs, by water draining back to the pulp. TheRnal product in which the hydrophobic particles are concentrated is removed as a froth
over-Sow.
The science of the separation is primarily con-cerned with improving the selectivity of the hydro-phobic particle attachment in the pulp through the addition of surface active chemicals. In addition, the hydrodynamics of the bubble}particle collision in the aerated suspension is important, as is the regulation
of the drainage of water-containing hydrophilic par-ticles from the froth by controlling its structure, also with surfactants.
It is probably fair to say that the industrial practice ofSotation is effective even in the absence of a com-plete understanding of its scientiRc basis. The success-ful application of flotation separations in industry can be classiRed into three areas.
Mineral Processing
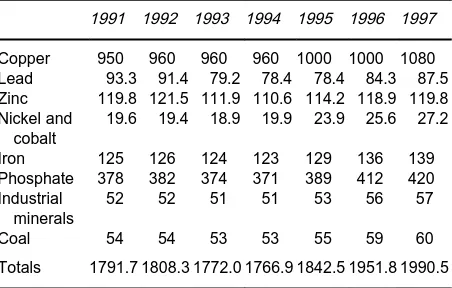
Froth Sotation is a widely used technique in the mineral processing industry as an early step in the process of concentrating a valuable material from an ore. It is preceded by crushing and grinding and may be followed by leaching/(ion exchange) electrowinning or smelting. In data cited by Merrill and Pennington from a US Bureau of Mines survey for 1960 nearly 200 million tons of raw material were processed annually by Sotation in the USA from which 20 million tons of concentrates were recovered. These consisted of 34 different commodities which, al-though principally metallic and non-metallic ores and coal, also currently reSects an increasing interest in recycling waste material.
Table 1 World-wide flotation tonnages (millions of tons), 1991}7
1991 1992 1993 1994 1995 1996 1997
Copper 950 960 960 960 1000 1000 1080 Lead 93.3 91.4 79.2 78.4 78.4 84.3 87.5 Zinc 119.8 121.5 111.9 110.6 114.2 118.9 119.8 Nickel and
cobalt
19.6 19.4 18.9 19.9 23.9 25.6 27.2
Iron 125 126 124 123 129 136 139
Phosphate 378 382 374 371 389 412 420 Industrial
minerals
52 52 51 51 53 56 57
Coal 54 54 53 53 55 59 60
Totals 1791.7 1808.3 1772.0 1766.9 1842.5 1951.8 1990.5
Calculated based on the tonnages of pure metal produced; the mine production of ores are based on the following data: Copper: average grade 0.8% Cu mined, at a processing recovery of 90%
Lead: average grade 3.0% Pb mined, at a processing recovery of 95%
Zinc: average grade 5.7% Zn mined, at a processing recovery of 82%
Nickel: average grade 1.6% Ni mined, at a processing recovery of 85%.
Source: Bowes (1997) Personal communication, Anglo-American Research Laboratories, Crown Mines, South Africa.
processing recovery refers to theSotation operation only. Where other recovery techniques are used such as leaching of nickel laterites and the recovery by leaching and solvent extraction of by-product cobalt from copper mining, theseRgures have not been in-cluded. Lead and zinc are often mined together and the separate tonnages reported forSotation process-ing may be overstated. The Rgures given for iron, phosphate, industrial minerals and coal are based on the percentages of the total tonnages. It is felt that particularly for iron and phosphate theRgures may be excessive.
Overall the total ores processed annually using froth Sotation given in Table 1 are consistent with the Rgure of 2 billion tons given by Fuerstenau in 1996. It is expected that signiRcant growth will be seen in the next decade with Sotation processing of copper ores rising to 1.6 billion tons per annum which represents 55% of the total tonnage antici-pated.
FrothSotation has proved itself to be an important process in the mineral industry and will only become more important in the future.
Non-mineral Processing Recycling
This includes deinking wastepaper, separating indi-vidual components from plastic wastes, and efSuent treatment of textile and smelter wastes.
Wastepaper deinking The growth of production has increased rapidly in recent years from 5.9 million tons per year in 1981 to 17.6 million tons per year in 1991. It is estimated that by 2001 the production of deinked waste will have increased to 31 million tons/year.
The objective of wastepaper deinking is to rid the grey repulped waste stock of unwanted particulates, usually inks. The reSectance of sheets of paper pro-duced from the retreated waste pulp to light at 457 nm gives a measure of the brightness. However, changes in brightness are themselves not necessarily a complete description of the effectiveness of the separation of ink, as brightness changes are also asso-ciated with the presence of white inorganicRllers.
Prior to Sotation the wastepaper is repulped in water at about a 15% suspension ofRbre in water, in the presence of either a sodium soap or an anionic surfactant such as sodium dodecyl sulfate (SDS). These provide detergency, liberating the ink particles from their associatedRbres. In some deinking plants this pulp is diluted to about a 1%Rbre suspension, before being fed to aSotation separator in which the grey pulp suspension is aerated using cell designs similar to those in the mineral industry. The product stream from these cells is an inky foam, which is the reject, and a non-SoatedRbre suspension below the froth level which is the deinked product.
Although this process has some resemblance to minerals Sotation there are signiRcant differences. SpeciRcally these relate to the properties of theRbre suspension. Their settling rate is low in any event, but asSocculated agglomerates they can trap small bub-bles which give them a buoyancy that makes them easily entrainable in the water associated with the air bubbles forming the foam. This can result in the reject stream being as much as 10% of the feed, although the ink and its associated print vehicle oil will only account for between 1 and 2% of the feed Rbre. Of this 1}2% only 10}20% is cellulose the rest being the oil/vehicle required for printing.
mentioned earlier, this is becoming an increasingly expensive option and a scheme is envisaged where the individual components, polyethylene terephthalate (PET), polyethylene (PE), polyvinyl chloride (PVC) and polypropylene (PP), can be separated and hence become reusable.
PVC and PET can be separated from the others by gravity separation and by using 190 ppm of a surfac-tant, methyl iso-butyl carbinol (MIBC), at pH 11 in a 1% suspension of the solids, the PVC can be re-moved in aSotation froth giving high recoveries and purities, leaving pure PET in the unSoated tailings. This process, although at an early stage, offers a promising recycling opportunity.
Recovery of metals from reVnery efWuents It is pos-sible that these may also respond to the use of froth
Sotation in transforming environmentally hazardous discharges into economically attractive sources of raw materials.
It is clear that considerable development work will be required in all the new applications and while it is sensible to make use of the extensive knowledge of the minerals industry of this separation technique, solving the special problems associated with each new application will most proRtably be done by applica-tion of scientiRc fundamentals.
Water and Waste Treatment
Removal of contaminants from domestic water The technique of dissolved airSotation (DAF) is used as an alternative to sedimentation afterSocculation in the preparation of water for domestic consumption. The bubbles are generated byRrst saturating a frac-tion of the treated raw water with air under pressure and then depressurizing in the total water. After de-pressurization the bubbles rise through the bulk solu-tion, where they will be entrapped by theSocculated impurities. The bubble-Soc aggregates rise to an
over-Sow where they are removed. DAF differs from min-eral Sotation in that the bubbles are very small and are not stabilized by added surfactants, and there is no selective attachment. The justiRcation for its use is that the aeratedSocs rise faster than the settling rate of ordinary Socs whose density is close to that of water and whose structure favours a high resistance to settlingSow.
Separation of dispersed oil from production water The processing of oil from offshore wells involves the removal of suspended solids from the oil and the separation of an oil}water mixture. Both the solid particles and the dispersed oil droplets are veryRne; in the region of 10}50m. The processing involves
the concentration of oil from a 5}50% by volume in water to 95}100% oil. This may involve a multistage operation particularly for very wet crudes, with a sec-ond concentrator stage treating the oil-rich product from the Rrst stage to achieve the desired Rnal oil purity.
If there is a second stage its water-rich waste stream is recycled to theRrst stage feed. The waste product from theRrst stage is water containing up to 0.1% oil by volume dispersed as ultraRne droplets. Before this water can be discharged, its oil content has to be reduced to comply with strict environmental stan-dards both with respect to its oil content and the biological oxygen demand (BOD). FrothSotation has been used particularly inRnal clean-up units because of the small droplet size. DAF has been used as the bubbles coming out of solution following a reduction in pressure are thought to nucleate directly on the droplets. Unfortunately, the rise velocity of these air}droplet aggregates is so slow that extremely large cells are required. Their operation is in turn adversely affected by the pitching motions ofSoating rigs. In-duced gasSotation (IGF) has also been used when the air is added to the feed stream at the throat of a Venturi nozzle. These have higher recovery rates but lower oil removal efRciencies than the DAF units. These reasons, together with the perceived high chemical costs, have favoured the use of liquid}liquid hydrocyclones in these situations.
Quantitative Measure of Flotation
Performance
The performance of any separation unit is usually deRned in terms of the fractional recovery (removal)
R of the valuable product (contaminant) and its purity (concentration) in the product (waste) streamG.
Grade^Recovery Curves for Mineral Bene\ciation
To characterize theSotation step in the beneRciation of a mineral ore, it is necessary to postulate that the mixture consists of at least two distinct particle popu-lations, one largely valuable and the other principally waste (gangue). The gangue will invariably consist of several different mineral types, the presence of each being undesirable in the valuable mineral. Each popu-lation is characterized by a size distribution, and the amount of undesired material it contains. The frac-tion of misplaced material in a particular populafrac-tion can almost invariably be reduced by a sequence of size reducing steps usually consisting of primary and secondary crushing followed byRne grinding.
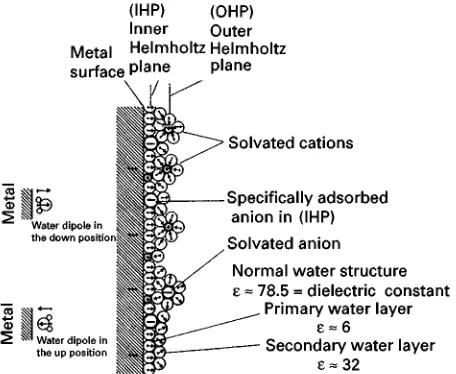
Figure 1 Model of a metal electrolyte interface showing film of water dipoles. Reproduced with permission from Leja J (1982) Surface Chemistry of Froth Flotation. New York: Plenum Press. component. This will result in increasing the fraction
of the desired component in the valuable mineral recovered and reducing its amount in the gangue. While liberation of the valuable component is clearly desirable, overgrinding will increase the power con-sumption of the mills, and as observed by Klimpel, also possibly introducing difRculties into theSotation process and subsequent downstream processing.
It is important to have a measure of the effec-tiveness of separation before an optimal solution can be identiRed. From a systems viewpoint, theSotation operation in mineral processing will separate a feed stream, F, into two product streams, a concentrate stream, C, containing an increased fraction of the valuable component and a tailings stream,T, contain-ing a reduced amount of the valuable component. The following overall mass balance will apply:
FxF"CxC#TxT [1] where xF, xC and xT are the mass fractions of the valuable component in the feed, concentrate and tail-ings, respectively. The performance measurement is characterized by two parameters. The fractional re-covery R of the valuable component in the concen-trate:
R"CxC FxF
[2]
and its purity (grade) in the concentrate stream. The grade may simply be the mass fractionxCor can be normalized between 0 and 1:
G"1!1!xC 1!xF
[3]
The upper limit, G"1, clearly follows from the concentrate mass fraction of valuables,xC"1, while the lower limit, G"0, presumes that the worst sys-tem performance is associated with no upgrading of the valuable mass fraction in the concentrate with respect to its concentration in the feed, although negative grades are mathematically possible.
Attainable Regions
The grade}recovery curve divides the grade}recovery space, 0)G, R)1.0, into attainable and non-attainable regions. The grade}recovery curve is a function of a set of operational controls of which theRneness of grind of the feed is one. The others are actions that affect the selective attachment of the valuable component to air bubbles and the preferen-tial drainage of the waste material back from the
froth. The optimal performance of the Sotation operation is deRned in terms of the minimum cost of achieving a particular grade}recovery target.
Pulp Microprocesses
Wetting of the Particles’ Surfaces
The particles are always dispersed in water and the nature of the wetting of their surfaces is critical for the effectiveness of theSotation separation.
Figure 1shows the concept of an attached water
Rlm in which water dipoles are held by van der Waals forces together with ions held by electrostatic interac-tion with charges on the particle surfaces.
The stability of the adsorbed waterRlm on the solid surfaces is clearly fundamental to the selective attach-ment of bubbles. Qualitatively for hydrophilic par-ticles the waterRlm is strongly bound to the solid, and hence is stable; conversely for hydrophobic solids the waterRlm is weakly bound and will fail more readily. The attachment of hydrophobic particles to bub-bles is usually considered to consist of two sequential stages. First, the particle must collide with (intercept) the bubble. The second stage after interception has two components: (a) a bubble}particle contact time and (b) an induction time which is that required for the waterRlm between the particle and bubble to thin to a point of failure at which point attachment is presumed to occur.
a non-polar end. Ideally, they will strongly attach to the valuable particles through their polar ends, with their non-polar ends confer an increased hydropho-bicity. For the waste particles no attachment is con-sidered to take place and consequently no hydropho-bic increase will occur.
Clearly the choice of a suitable reagent is critical and is highly speciRc to a particular separation. Al-though the choice of reagent(s) for a particular separ-ation usually has evolved with experience, the search for ever more effective reagent mixtures is an area of continuing research and development. A sound basis for these investigations is to develop an understand-ing of the free energy changes at the solid}water and bubble}water interfaces, consequent on changes of the reagent types and conditioning procedures.
Particle Surface Hydrophobicity
Theoretical basis for estimation To describe bubble}particle attachment after interception mathematically it is necessary brieSy to review the nature and magnitude of the forces acting across the various interfaces.
After the initial interception, the particle and bubble will be separated by a waterRlm. TheRlm will become thin because of the forces of attraction be-tween particle and bubble. The rate of thinning is determined by the dissipation of the kinetic energy of the particle on impact, associated with a resultant of long-range London}van der Waals molecular attrac-tion (dispersion forces), capillary forces generated by the distortion of the bubble surface during the im-pact, electrostatic interactions between the uncom-pensated surface charges on the solid and those in the adjacent water layer, and as has been shown by Xu and Yoon, an additional force of attraction which appears to exist between two hydrophobic surfaces.
If theRlm thins to a critical value, failure will occur that will result in a successful attachment event. Both the thinning process and the critical thickness of the
Rlm must clearly depend on the interaction energy of the particle}water interface.
For the van der Waals forces of attraction, a treat-ment of the dispersion energy between a single gas-eous atom and a slab of inRnite extent is outlined by Adamson as:
(hx)atom}slab"!
6nC1
h3
x
[4]
where C1"34h02 and (hx)atom}slab is the
poten-tial energy of interaction in ergs/molecule at a sepa-ration distancehx(cm), N0 is the Avogadro number
(6.02;1023molecules
/g mol wt) for water from
Adamson,h0"18 eV ("18;10\12ergs),
(polar-izability)"1.46;10\24cm3. Since w density of
liquid water g cm\3 and n"N
0w/18"3.34;1022
molecules/cm3 using these Rgures C
1"28.8;10\60
ergs cm6.
The dispersion energy between two inRnite Sat surfaces after integration is:
(hx)slab}slab"!
12
(n2C 1)
h2
x
[5]
where(hx)slab}slabis in ergs cm\2.
Fowkes has equated (hx) of eqn [5] to ds, the dispersion component of the total energy for water. As will be shown later, he has linked this dispersion energy with the physical adhesion energy at the inter-face between two different phases.
The dispersion energy for liquid water,d
w, is cal-culated from eqn [5] to be 35.8 ergs cm\2 using the
values given above and a value of 2.76 A> for the average intermolecular distance. This is somewhat higher than the experimentally determined value of 21.8 ergs cm\2 from contact angle measurements,
but nevertheless it is valuable as it gives a theoretical basis for the forces of attraction at the interface be-tween two immiscible phase surfaces. This is relevant to studies where the adsorption of a surfactant (col-lector) on a solid surface is used to modify the sur-face’s hydrophobicity.
Eqn [5] is usually written in terms of, A, the Hamaker constant, which is speciRc for a given separ-ation; for water A"2n2C
1"0.3;10\12, and on
average is of the order of 10\12ergs:
(hx)slab}slab"!
1 12
A h2
x
[6]
The attraction stress between the two surfaces is:
(hx)slab}slab
hx
"6A
h3
x
(dynes cm\2)
For a condensed system involving different phases the potential energy of interaction is still given by eqn [6] but with a modiRed Hamaker constant.
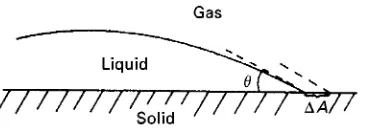
Figure 2 Contact angle of liquid droplet on a solid surface. which is the effective range of the van der Waals
attractive forces. The bubble will have a layer of surfactant on its surface which will be orientated with its polar end in the water and the hydrophobic end in the air.
The interaction energy is expressed in terms of a net Hamaker constant,A132, which is approximated
by Adamson as a simple linear relationship:
A132"A12!(A13#A23!A33) [7]
The binary Hamaker constants expressed above refer to two-surface interactions only. Some of these are physically difRcult to interpret, but are neverthe-less useful in formulating a conceptual understand-ing. With these reservations, A12 is the interfacial
energy between a solid particle and a bubble separ-ated by a vacuum andA33 is the interaction energy
between water molecules.
A13andA23are the Hamaker constants
represent-ing the particle}water and bubble}water interaction energies. If these energies are low with respect to the mutual interaction energy of the water molecules then
A132 will be greater than the interaction A12. The
enhanced attraction between the particle and the air bubble in the presence of water reSectshydrophobic bonding.
Leja quotes interaction energy potentials and Lon-don dispersion forces for various conRgurations fol-lowing integration of atom}atom interaction ener-gies. The dispersion force of attraction between two spheres of radiusR1andR2, for example, is given by:
athxR1,R2, F"
AR1R2
6h2
x(R1#R2)
[8]
Experimental characterization of hydrophobicity
+contact angle Interfacial energies for liquids may be measured by surface tension, while those for solid}liquid interfaces may be inferred from contact angle measurements.
If a liquid is placed on a solid surface it will form a droplet (Figure 2). The droplet will have a deRnite angle of contact, , with the surface. The change in the free energyG0of the three-phase contact surface
if the area of contact,AS, between the droplet and the surface were to change slightly is:
G0"A
S[(SL!0SV)#LVcos( ! )] [9]
whereSL,LVand0
SVare the interfacial energies for solid}liquid, liquid}vapour and solid}saturated vapour. At equilibrium this leads to the Young
equation:
limG
0
AS
"0, SL!0
SV#LVcos "0 [10] Bangham and Razouk observed that as 0
SV repre-sented the energy of a surface in contact with a saturated vapour of partial pressurep0, there must
be present on the surface aRlm of condensed vapour with its own surface energy 0. The total surface
energy of the solid is thus: S"0
SV#0 [11]
Substituting for0
SVin eqn [10] gives:
LVcos "S!SL!0 [12]
The interfacial energy of the solid}liquid interface SL, can also be expressed as the sum of the surface energies of the individual phases separately, where S is the surface energy of the solid, and LV is the surface energy of the liquid in contact with va-pour, andwSLVis the work of adhesion which has to be subtracted:
SL"S#LV!wSLV [13] The work of adhesion for the three-phase contact is then obtained from the Young equation after substi-tuting forSLfrom eqn [12] into eqn [13]:
wSLV"LV(1#cos )#0 [14] Equation [14] is a form of the DupreH equation that relates an increasing contact angle to a reduction in the adhesion energy between the solid surface and water, or alternatively to an increase in the hydropho-bicity of the solid surface.
and liquid:
SL"S#LV!2((dSdL) [15] (is commonly taken as unity).
Fowkes applied eqn [15] to eqn [12], to express a relationship between the contact angle and the dispersive energy of the solid surface, d
S,
this being considered to be a parameter most characteristic of the inSuence of the nature of the surface on the interface phenomena important in
Sotation:
LVcos "!LV#2((dSdL)!0
[16] cos "!1#2(d
S
(d L LV
!0
LV
The dispersion forces in a particular solid,d S, can therefore be estimated by using contact angle measurements with different liquids obviously of known surface dispersion dL. Linear plots of cos against the ratio of dispersive energies of the liquids conRrm the validity of eqn [16] and the slope of the line gives(dS.
Experimental characterization of interfacial energies
+adsorption studies Adsorption data may be used to estimate which reSects changes in interfacial energies. These require knowledge of the adsorption isotherm, relating, the mols of vapour adsorbed per square centimetre of solid surface withp, the partial pressure of the solute in the gas.
Bangham and Razouk derived an expression for by integrating the Gibbs equation. This states that:
d"!RTd lnp
from which:
"!
d"RTd lnp"S!SV"RT
p
0
d lnp [17]
0"S!0
SV"RT
p0
0
d lnp
Harkins by deRningSVas being equal toSL#LV related the energyof the adsorbed liquidRlm to the
surface activities:
"S!(LV#SL) [18] By substituting forSLfrom eqn [15], Fowkes ob-tained an expression which linksd
Swith as deter-mined from adsorption studies:
"2((dSdL)!2LV [19] The derivation assumes that the adsorption of va-pour is determined solely by dispersion forces (phys-ical adsorption):
d S"
(#2LV)2
4d L
[20]
It is clearly of interest to compare the surface free energiesd
Sdetermined from gaseous adsorption stud-ies with those obtained from contact angle measure-ments. Fowkes quotes an average value of 122 ergs cm\2for the dispersive energy of a graphite
surface,dS, from the adsorption of N
2and n-heptane,
which compares well with the value of 109 ergs cm\2 from contact angle measurements of a water
droplet on a graphite surface ( "85.73 and 0"19 ergs cm\2).
The surface free energies can also be experi-mentally determined from heats of immersion Hi since:
SL!S"LV!2((dSdL)
Hi"(SL!S)!T
dSLdT
[21] Hi"LV!2(dSdL
!T
dLVdT!2(
d LV
d(d S dT !2(
d S
d(d LV dT
Experimental characterization of interfacial energies
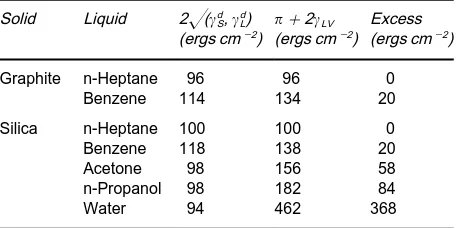
+heat of immersion Equation [21] can be used with heats of immersion measured calorimetrically to de-termine the contribution of polar interactions be-tween the solid and the liquid into which it has been immersed. If dispersion forces only were signiRcant at the interface, then the equality of eqn [19] should hold. Deviations from the equality of eqn [19] refer-red to as the excess by Fowkes are a measure of the strength of the polar interaction:
Table 2 Polar interfacial interactions at solid}liquid interfaces
Solid Liquid 2((d S,dL) (ergs cm\2) #
2LV (ergs cm\2)
Excess (ergs cm\2)
Graphite n-Heptane 96 96 0
Benzene 114 134 20
Silica n-Heptane 100 100 0
Benzene 118 138 20
Acetone 98 156 58
n-Propanol 98 182 84
Water 94 462 368
Reproduced with permission from Fowkes FM (1964) The Inter-face Symposium.Industrial and Engineering Chemistry 56(12), 40I52, Table IX.
Table 2 shows polar interactions at some solid}liquid interfaces in terms of the excess.
From the limited data reproduced in table it can be seen that the adsorption of hydrocarbons both on graphite and silica is principally through dispersion forces while that of n-propanol and water on silica show signiRcant polar interactive forces. Clearly, the presence of these strong attractive forces will result in very stableRlms.
The Forces Between a Charged Particle Surface and an Ionic Solution
Origin of particle surface charge The attraction be-tween a charged surface and a concentration of counterions in the diffuse double layer adjacent to the particle surface will be the source of increased inter-action energies. The charge density on the surface of the solid particles, and hence the potential gradients in the diffuse double layers, is determined by the degree to which the intermolecular forces at the crys-tal surface are non-compensated. These are related to the structure of the crystal lattice and to the orienta-tion of the cleavage planes at the surface.
As a consequence of a surface charge, to a greater or lesser extent hydrated ions will be adsorbed, the energy of attachment being related to the charge density on the particle surface. As both orthorhombic sulfur and graphite exhibit comparatively weak resid-ual surface forces with strong non-polar bonds being localized within the unit cells of the crystal lattice, the attachment energy of hydroxyl and hydrated ions will be low giving the surfaces their hydrophobic character.
On the other hand, for ionic crystals the uncom-pensated electrostatic forces at the surface may be high and can lead to strong attachment of water. As the electrostatic forces operate over signiRcantly lon-ger distances than do the London}van der Waals
forces they will give hydrated layer thicknesses of the order 20}60 A>. According to Klassen and Mokrousov who quote Derjaguin and Derjaguin, Karasiev and Zorin, the hydrated layer has an increased viscosity over that of the bulk water and the change in viscosity is discontinuous.
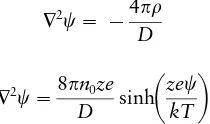
Diffuse boundary layer To illustrate the previous observations consider a plane surface with a uniform charge density0in contact with water with a bulk
ionic concentration n0. If the solid}water interface
has a positive electrical potential,0, the potential in
the solution will decrease to 0 as one proceeds in a normal direction away from the surface into the solution. Close to the positively charged surface, however, there will be an excess of negative ions. If
n#andn\are the concentrations of the positive and negative ions, of equal and opposite charge,#zand
!z, respectively, at a point in the solution then the net charge densityat that point in the solution will be:
"ze(n#!n\) [23] Using the Boltzmann factor, the ionic concentra-tions can be linked to the local potential at a point in the solution:
n\"n0exp
ze
kT
and:
n#"n0exp!
ze
kT
from which:
"!2n0zesinh
ze
kT
[24]The integral ofto inRnity will give the total excess charge in the solution per unit cross-sectional area which is equal to but opposite in sign to the charge density on the surface . The situation is that of a double layer of charge, the one localized on the solid surface and the other in the diffuse region.
Figure 3 The diffuse double layer. Reproduced with permission from Adamson AW (1982)Physical Chemistry of Surfaces, 4th edn. New York: John Wiley.
density at that point:
2"!4
D
2"8n0ze
D sinh
ze
kT
[25]where2is the Laplace operator andDis the
dielec-tric constant of the medium (for water"78). For small values ofzewith respect tokT, eqn [25] can be expressed as:
2"2
2"8n0z2e2
DkT [26]
The treatment for a plane charged surface is due to Gouy and Chapman (after deRning):
y"ze
kT and y0" ze0
kT [27]
Eqn [26] can be written as: d2y
d2x" 2sinhy
with the boundary conditions at:
x"R,y"0 and dy
dx"0 [28]
For the case where y0 is small, for example for
univalent ions at room temperature,0(25 mV, the
solution of eqn [28] reduces to:
"0exp!hx [29]
settingx"hxas the separation distance.
The quantity 1/ is the distance from the surface where the potential in the solution reaches 1/e
("0.3679) of its value at the surface; the plane 1/is used to represent the thickness of the diffuse layer adjacent to the surface. The charge density of the solid surface can be obtained from a knowledge of (x) vsxsince:
0"!
0
dx"D
4
0
d2
dx dx
"!
D4
d dx
x"0[30]
For small potentials, the diffuse double layer can be likened to an electrical condenser of charge density 0and a plate separation of 1/.
Figure 3shows very interesting relations between (x) andxand between0and. Figure 3(A) shows
the exponential decay in the solution potential for a surface whose potential 0 is 25 mV, while
Figure 3(B) shows that increasing the concentration of the bulk solution of univalent ions, from 0.001 to 0.01 M signiRcantly reduces the dispersion layer thickness from almost 200 to less than 40 A>.
surface charge density (e/100 A>2) and the surface
potential0.
Conversion to SI units requires a conversion constant, the permittivity (of vacuum),0"8.859;
10\12coulombs
/(metre volt). The conversion in cgs/ esu to SI units of the potentialand the chargeeis given in eqn [31]:
cgs/esu"SI;(40)1/2 and ecgs/esu"
eSI
(40)1/2
[31] To illustrate the use of the conversion constant, the intercharge energies between two charged surfaces, as given by Coulomb’s law, are:
in CGS units (ergs)"q1q2
hxD
[32] in S.I. units (Joules)" q1q2
40h
xD
The equivalent equation in SI units to eqn [26] then becomes:
2"2n0z2e2
0DkT"
2 [33]
To illustrate the magnitude of , consider a 1 mM solution in water of a uni-univalent solute. In this case the number of molecules,n0, of solute per cubic
metre is just the Avogadro number,N0"6.02;1023.
Note also that 0D, sometimes written only as D,
is"6.91;10\10coulombs
/(volt metre). Substituting parameters for this case in the relationship for im-plied in eqn [33], a value for of 1.0;108m\1 is
obtained, or 1/"10 nm.
The Stern treatment of the electrical double layer The Gouy}Chapman treatment gives absurd answers for small values of hx when 0 is large. Adamson
illustrates this point with the example for 0"300 mV:
y0"
300
25.69"12 [34] if n0"0.001 M thenn\"0.001;e12"160 moles/
litre! This is due to the treatment of the charges as point sources by neglecting the ionic diameters.
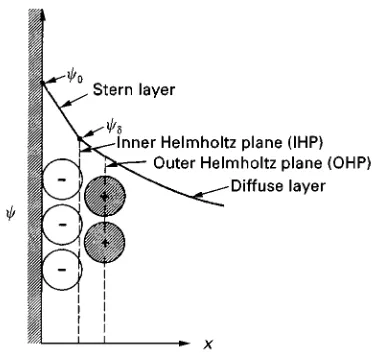
Stern suggested that the region in the liquid ad-jacent to the surface be divided into two parts, an inner compact layer consisting of ions or hydrated
molecules which are Rrmly attached to the surface, and an outer diffuse layer in which the ions were less
Rrmly bound. The key to his analysis is the estimation of the extent to which solute molecules will enter the compact layer, which requires them to displace water dipoles, in particular.
IfS0is the number of occupiable sites on the surface
then the maximum charge density for the compact layer is 0"zeS0. In the presence of a dilute solute
phase, however, the ratio of the sites occupied by the solute to those potentially occupiable is proportional
to,NS, the mole fraction of solute. In dilute solution,
Stern linked this fraction and the potential
Bat the
outer surface of the compact layer to a charge density S in the compact layer, with allowing for any additional chemical adsorption potential. This ap-proximates to:
S 0
" NSexp[!(zeB#)/T] 1#NSexp[!(zeB#)/T]
[35]
This suggests that the charge S in the compact layer can be linked to the potential at its outer bound-ary
B, using eqn [30] with the approximation:
!ddx
0
+0!B
hence S+
D
4(0!B) [36] whereis its thickness andDis an apparent dielec-tric constant for the layer.
In the diffuse layer as one proceeds outwards from the surface a potential at positionxcan be calculated using eqn [29] with B replacing 0. The ions are
mobile in this layer and the layer is characterized by a thickness"1/.
The electrodynamic potential() A charged surface experiences a force in an applied electricReld. As it moves the boundary of the water moving with it is the shear plane of thickness 1/, which has a potential (1/), commonly referred to as the zeta-potential ().
The potential of the shear plane can be experi-mentally determined by electrophoresis. If for a spherical particle of radiusRp, the charge density of the diffuse layer up to the shear plane isD, the force exerted on it in an electricReld ofFS(V m\1) will be:
Figure 4 The Stern layer. Reproduced with permission from Adamson AW (1982)Physical Chemistry of Surfaces, 4th edn. New York: John Wiley.
of radiusRp, moving at a velocityvis given by:
fS"6Rpv which gives v"
2DFSRp
3 [38]
The relation between the charge density,D, of the diffuse layer and the potential at the shear plane treated as a parallel plate condenser with plates 1/ apart in SI units is:
D"0D (coulombs m\2) [39]
If the -potential of a spherical particle, of radius 1m moving in an external Reld of 1 V cm\1
is 25 mV, then the velocity calculated from eqns [38] and [39] is 1.15;10\6m s\1. Data quoted
by an equipment manufacturer gives a velocity
v"2.0;10\6m s\1, for the same conditions.
The charge densityDof the diffuse layer follows from the-potentials measurements. The charge den-sity of the surface,0, follows as the sum of the charge
densities of the compact layerSandD.
Collectors
General A collector is a surface-active chemical which has a polar and a non-polar group. The work of adhesion of a collector to a solid surface has been separated into three components by Leja:
wSLV"wd#wh#wi [40] where wd is the dispersive component, wh is the energy associated with polar adsorption of water at non-ionic sites and wi is the contribution through electrostatic interactions with the Stern layer asso-ciated with the solid surface (Figure 4).
The collector molecule must beRrmly attached to the solid surface through its polar group and must be able to confer sufRcient hydrophobicity to the surface through the non-polar component to facilitate bubble attachment. It appears that for effective at-tachment, multilayer adsorption is required. Fuer-stenau and FuerFuer-stenau have suggested that the multi-layer arise from the dispersive interactions between the non-polar parts of the molecules; they have refer-red to the resulting structure of the adsorbed layer as hemimicelles.
The attachment of a bubble to the solid ultimately involves an interaction between the polar groups ad-sorbed on the bubble surface and the multilayered collector on the particle’s surface. As the science of the interactions is still imperfectly understood it is
necessary brieSy to review the nature of the collector in speciRc separations.
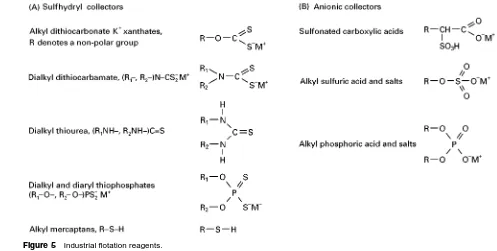
Thiol collectors The discovery of xanthates in the 1920s caused a rapid increase in theSotation process generally, but speciRcally with nearly all the sulRde ores. While they confer hydrophobicity on sulRde minerals, they do not affect theSotation of silicates, aluminosilicates, oxides or mineral salts. However, to achieve selective separation between sulRdes within the same ore-body careful choice of reagent and con-trol of operating conditions is required.
Although there appears to be a wide range of these sulfur-bearing compounds, they are derived from a restricted number of oxygen-bearing compounds through the substitution of sulfur for the oxygen. The great majority are derived from carbonic, carbamic and phosphoric acids, urea and the alcohols. They are usually surface-active with respect to the liquid}solid interface, but less so at the bubble}liquid surface. Some of the most important of these sulfhydryl collec-tors are discussed below, with their structures given in Figure 5(A). In all cases R denotes a non-polar group.
Figure 5 Industrial flotation reagents.
Dialkyl dithiocarbamate (R1}, R2})N}CS\2M# These are selective collectors for Cu or Cu-activated Zn from FeS2. They are sparingly soluble and are used as
emulsions in the pH range 4}9. The non-polar group R1is usually CH3or C2H5while R2is either propyl or
butyl.
Dialkyl thiourea (R1NH}, R2NH})C"S These are selective collectors for Cu, Pb and Ag ores and have been used in theSotation of complex Cu}Pb}Zn ores. They are not water soluble and have to be used as dispersions in water.
Dialkyl and diaryl thiophosphates (R1}O},R2}O})
PS\2M# The di-ethyl and di-sec-butyl derivatives are used as collectors for Au, Ag and Cu. The dicresyl derivative is used for Ag, Cu, Pb and Zn. Generally, the dithiophosphates (DTP) reagents are more selec-tive than the xanthates particularly in preventing the
Sotation of iron sulRdes. The alkyl derivatives are water-soluble and are used in 5}20% solutions over the pH range 4}12. The most common alkyl homo-logues are diethyl and dibutyl. The alkyl derivatives are essentially non-frothing.
The aryl derivatives are dicresyl and exhibit froth-ing behaviour. They are not water soluble and are used undiluted.
Alkyl mercaptans R}S}H Only homologues higher than C12 have been used. Dodecyl mercaptan is
a powerful non-selective collector particularly for Cu. The mercaptans are not water soluble and are
used either in an organic solution or as a liquid emulsion.
Xanthate derivatives R}O}S\2M# These are used mainly in CuSotation. They are water insoluble and are used either as an aqueous emulsion or as an organic solution. They are effective over a wide pH range.
Anionic collectors These are ionizable non-thio compounds derived from carbonic, sulfuric, phos-phoric, phosphonic and arsonic acids (Figure 5(B)). They are anionic, depending on the pH of theS ota-tion pulp and are used to collect a wide range of oxide, silicate and salt-type minerals. These minerals usually have positive -potentials and consequently bind OH\ ions giving them a hydrophilic character. For the adsorbed surface to become hydrophobic the non-polar part of the anionic collector molecules must have longer carbon chains than those of the thiols. Their attachment is primarily through electrostatic in-teractions between the polar group of the collector and the particle surface while dispersive interactions be-tween the non-polar groups of adjacent collector mol-ecules increase the hydrophobicity of the surface by producing multilayered adsorbedRlms.
Unsaturated molecules are preferred. At alkaline pH the metal salts are soluble in water. They are used for theSotation of apatite, calcite,Suorspar and barite. Because of the electrostatic nature of their adsorption they are very powerful collectors for surfaces with positive-potentials but selectivity is difRcult to effect and requires careful control of the chemical environ-ment which usually requires the use of depressants.
Alkyl sulfuric acid and salts R}O}SO\3M# These are stronger acids than the fatty acids and exist in an ionized water-soluble form above pH 1}2; the alkyl radical is usually C12and saturated. Organic sulfates
and sulfonates are used toSoat oxides and silicates such as iron ores, chromite, garnet, beryl and zircon. As the bonding with the solid surface is primarily electrostatic, pH control is critical, especially for the shorter chain length alkyl groups, as it affects their intermolecular dispersive bonding.
Alkyl and aryl sulfonic acid and salts R}SO\3M# A typical collector of this type is sodium dodecyl ben-zene sulfonate C12H25}C6H4}SO3}O\Na# which is
a strong acid and will operate in pulps with pH values above 2.
Alkyl phosphoric acid and salts (R1O},R2O})PO\2M# R1and R2can be either aliphatic or aromatic. Dialkyls are more strongly frothing than the monoalkyls. They are used in separations from quartz gangue, in par-ticular for the separation of heavy minerals from glass sands. They have also been used inSotation of tung-sten, uranium and phosphate ores. They are not selec-tive in the presence of apatite, calcite, Suorspar or barite.
Cationic collectors This group consist of amines which below ceratin pH values exist in the cationic form, RNH2, R1R2NH, R1(R2)2N. The amines are
insoluble in the free base form but are treated by acids such as acetic or hydrochloric to solubilize them. They ionize in aqueous solutions as follows:
RNH2(aq)#H2O"RNH#3 #OH\
Typical collectors of this type are a primary aliphatic amine, n-amylamine (C5H11NH2), a primary
aro-matic amine, aniline (C6H5NH2), and pyridine
(NC5H5), nitrogen in a benzene-like nucleus.
Particularly important are the quaternary am-monium salts, R1(R2)3N#X\, which ionize strongly
and are water soluble. The collecting action of this group is based on being strongly attached to sur-faces with negative-potentials and are consequently rarely selective but are effective over a wide pH
range. Important collectors of this type include alkyl propylenediamine, (RNH2(CH3)3NH3)2#2X\, and
tetradecyltrimethylammonium bromide (TTAB), CH3(CH2)13}(CH3)3}N#Br\.
Cationic collectors are used to separate sylvite (KCl) from halite (NaCl) in brine and are also used in the separation of silica from phosphate and in the
Sotation of zinc carbonates and silicates.
The Mechanism Associated with the Flotation of Some Important Ores
SulVdes + recovery of galena + effect of collectors Most data are associated with theSotation of the lead ore galena PbS, which has been studied extensively. Although the tonnage of lead ore processed is only a tenth of the amount of the copper ores processed (Table 1), the fact that it exists in only one valence state simpliRes data interpretation. The overall mech-anism for copper sulRde ore processing is accepted as being similar to that of lead despite the copper val-ence change under oxidizing conditions. Both copper and lead areSoated with sulfhydryl collectors and it is of interest to review the concepts associated with the collector action. It is often the case that, despite the high selectivity of the sulfhydryl collectors for sulRdes in the presence of oxide and silicate gangues, that further selectivity between different sulRde min-erals is required. It is consequently not necessarily sufRcient to determine optimum recovery for a
speci-Rc collector, but it is also necessary to investigate its effect on the simultaneous recovery of an undesired sulRde mineral.
The effect of oxygen on the -potential and KEtX adsorption on a galena surface In the absence of oxygen the adsorption density of ethyl xanthate is independent of pH and remains constant at a level of 2;10\6g moles
/g of galena, which corresponds to effectively a coverage of a monolayer assuming one xanthate ion adsorbed at one lead site on the surface. The area occupied by an anion of amyl xanthate disposed perpendicularly to the surface of a mineral is given by Klassen and Mokrousov to be 28 A>2.
This adsorption area should be independent of the length of the hydrocarbon chains of normal xanthates.
In the presence of 1;10\3molar ethyl xanthate
the-potential remains steady at!40 mV over the pH range of 4}12.
This seems to indicate that the attachment is due to the chemisorption of the alkyl part of the xanthate molecule on the galena surface, presumably after dis-placing H3O# or OH\ ions. The unchanged outer
negatively charged compact surface layer is asso-ciated with the polar end of the molecule.
In the presence of oxygen, but without xanthate, the -potential vs pH differs signiRcantly from the previous case. Over the pH range from 4 to 6 the -potential vs pH curve is convex upwards with a maximum of just under #20 mV at pH 6. At increasing pHs the -potential falls to 0 at pH 6.9, the PZC; from 6.9 to 12 it falls from 0 to!40 mV. It should be noted that for the previous case of no oxygen and no xanthate the pH at the PZC is 2.6.
In the presence of 1;10\4mol L\ethyl xanthate
and oxygen, the -potential}pH curve is again elec-tronegative over the range 4}12, as with the case for xanthate without oxygen, but is no longer constant, falling from!20 mV at pH 4 to!40 mV at pH 12. There are conSicting explanations for the effect of oxygen on the galena surface. One plausible theory is that, in the presence of oxygen, the surface is oxidized to thiosulfate and sulfate. As air also con-tains CO2, lead carbonates may also form displacing
the sulfates. Some of these surface compounds may move into the inner compact layer in the solution. In the presence of xanthates, a signiRcant xanthate frac-tion may react directly at the surface, possibly with the sulfates, forming a strong bond with the lead mineral. The rest of the xanthate will displace the sulfate from the inner to the outer compact layer, causing the potential at the outer compact layerBto remain electronegative.
It is further postulated that with excess xanthate, metathetic replacement of the sulfate will occur pro-ducing uncharged hydrophobic, insoluble lead ethyl xanthate. This process is clearly kinetic requiring diffusion of the unreacted sulfate at the surface through the compact layer. Multiple layers of the insoluble lead ethyl xanthate will confer increased
Sotability on the galena. Finkelstein, Allison, Lovell and Stewart reported improved Sotation recoveries for galena using ethyl xanthate in terms of the thick-ness of the lead ethyl xanthate layers expressed as monolayers. The recovery increased from zero with no ethyl xanthate to 70% for a single monolayer increasing to 95% withRve monolayers.
Selective Wotation of galena + effect of depressants Reagents which, to a greater or lesser degree depress
recoveries of sulRdes (depressants), include OH\, S2\and chromate.
Fuerstenau in 1982 reported 100% recovery of galena, using 1;10\5mol L\1ethyl xanthate in the
presence of oxygen, over the pH range 2}10. How-ever, if the lead content (grade) of the concentrate is required to be low in the presence of other sulRdes, which are themselves being Soated by the 1;10\5mol L\1 ethyl xanthate, this requires a
re-duction (depression) of the galena recovery simulta-neously with a smaller reduction in the recovery of the desired sulRde.
Depression of galena using hydroxyl is effected at pH values greater than 11, due to the formation of HPbO2, which is the unhydrated form of Pb(OH)\3,
in the Stern compact layer, this causes the galena surface to become hydrophilic with consequent re-duction in lead recovery.
The depression of galena using sodium sulRde is much greater than that of all other sulRde minerals. Additions of sodium sulRde to a galena suspension in xanthates will cause an insoluble hydrophilic lead sulRde rather than lead xanthate to form at the solid surface according to the reaction:
PbS(s)#2EtX\"Pb(EtX)2(s)#S2\
In the presence of chromate the adsorption of xan-thates does not decrease, but when lead chromate forms on the surface, the hydration of the chromate is so strong that the collector hydrophobicity is signiR -cantly reduced.
Grade-recovery of copper ores In view of the eco-nomic importance of chalcocite (Cu2S) and
chal-copyrite (CuFeS2) their selective recovery from ores
containing undesired pyrites will be brieSy reviewed.
Depression of pyrite}Effect of pH. Flotation of pyrite will be possible with short-chain xanthates such as potassium ethyl xanthate at pHs below 11. At addition rates of 2;10\4mol L\1 of KEtX, 100%
recovery is possible. The recovery is thought to be due to the adsorption of dixanthogen on the surface. However, at high pH values xanthate oxidation to dixanthogen does not occur according to the reaction shown below, thus depressing the pyrite recovery:
2X\#1
2O2(ads)#H2O"X2#2OH\
pyrite are still present in the concentrate even up to pH 10. However, with a KCN addition of 6.0;10\3mol L\1, recovery is signiRcantly
depress-ed at pH 4 and completely depressdepress-ed above pH 7.
Effect of pyrite depressants on copper recovery
To assess the selective separation of copper ores from pyrite it is necessary to see how the copper Soats under conditions identical to those reported for pyrite depression.
Chalcocite will Soat completely at up to pH 10 using 5.0;10\5 ethyl xanthate. The mechanism of
Sotation in the presence of amyl xanthate is similar to that of galena, with a chemisorbed cuprous amyl xanthate after which further xanthate additions form multilayers of cuprous xanthate in the compact layer, increasing the overall hydrophobicity.
At pHs between 8 and 10, the addition of sodium sulRde will depress pyrite without signiRcantly alter-ing the chalcocite recovery. The most effective de-pressant for this separation does however appear to be potassium cyanide which hardly affects the chalco-cite recovery between pH 8 and 12 while virtually completely suppressing the pyrite over this range.
Chalcopyrite willSoat at 100% recovery over the pH range 2}12 both with 1;10\5mol L\1 ethyl
xanthate and 1.3;10\5mol L\1 dixanthogen. No
depression in recovery is observed up to pH 13. From this it may be inferred that at these high pHs it is the stability of the cuprous ethyl xanthate which effectsSotation.
As chalcopyrite contains iron it is to be expected that it will to some extent be affected by the pyrite depressants but will be less sensitive to NaCN addi-tions than the pyrite. For example, in a system where 60.9% pyrite recovery was achieved simultaneously with 90.5% chalcopyrite recovery with no depressant at pH 8.8, the addition of 0.04 kg ton\1 NaCN
changed these Rgures to 26.1% pyrite recovery and 84.2% chalcopyrite recovery. Further additions of cyanide reduced the pyrite recovery to 15.6%, but also cut the chalcopyrite recovery to 31.0%.
Finally, it should be noted that sodium sulRde will depress chalcopyrite more than pyrite. This is due to the preferential formation of cupric sulRde over that of cuprous ethyl xanthate.
Flotation of oxides and silicates Oxides and silicates are the most abundant minerals in the earth’s crust. TheirSotation behaviour is important both because of their inherent value and because they act as gangue in the Sotation of other minerals. Once again only a sample of the separations of interest can be dis-cussed. ConsiderRrstly the separation of quartz from haematite in iron ore processing.
Fuerstenau and Healy have suggested six possible procedures, four of which have been successfully em-ployed in industry. These are based on the-potential for haematite being positive in the pH range 2}4 with a PZC in the region of pH 6, while for quartz over the same range the-potential is negative with a PZC at pH 2.
These procedures are:
E Flotation of haematite using an anionic sulfonate collector, for example sodium dodecyl benzene sul-fonate which will adsorb on the positively charged haematite surface but not on the negatively charged quartz.
E Flotation of the haematite by the chemisorption of a fatty acid collector at pH 6}8. Chemisorption on the quartz will not occur because of its large nega-tive -potential at this pH.
E Reverse Sotation of quartz at pH 6}7 using a cationic collector, for example, amylamine which will adsorb on the highly negatively charged quartz but not on the essentially uncharged haematite.
E ReverseSotation of quartz activated with calcium ions, with a long-chain fatty acid collector and the haematic depressed through the addition of starch. The hydrophilic starch molecules will chemisorb on the haematite through their carboxyl groups. Without the starch the haematite would alsoSoat under these conditions.
The successful implementation of these separations is clearly consistent with the electrostatic theory of col-lector adsorption.
Further thoughts on the electrostatic model ofS o-tation. For collectors to function through physical interactions they must be present as counterions in the compact layer. Under these conditions the net charge on the outer boundary of the diffuse layer is reduced and hydrophobic interactions with the non-polar surfactants on the bubble surface can occur. Iwasakiet al. reported very interesting results relating to the Sotation of goethite (FeOOH). Goethite has a PZC at pH 6.7 and they measured
Sotation recoveries, in a laboratory Hallimond tube, as a function of pH using 1.0;10\3mol L\1of the
anionic collectors sodium dodecyl sulfate and sodium dodecyl sulfonate and the cationic collector dodecyl ammonium chloride. They achieved effectively 100% recoveries up to pH 6.0 using the anionic collectors with the recovery falling effectively to zero above pH 7.0.
The recovery of goethite vs pH using the 1.0;10\3mol L\1 cationic dodecylammonium
pH 8 and 12.2 when the recovery fell to zero because the quaternary ammonium salt hydrolysed to the parent amine.
The increasedSotation response at lower pHs with the anionic collectors is associated with an increased charge densitySin the compact layer which causes larger amounts of collector to be present as counter-ions. The increased concentration of their non-polar groups in the compact layer will increase the particle’s hydrophobicity.
Modi and Fuerstenau reported tests on corundum (Al2O3), which has a PZC at pH 9, at four different
pH values using an anionic collector, sodium dodecyl sulfate, at concentrations ranging between 10\7and
10\1mol L\1.
At pH 4.0, 100% recovery was achieved with 0.5;10\4mol L\1, but it required 10 times that
con-centration for 100% recovery at pH 6.0, while at pH values of 9.3 and 11.0 the highest recovery achieved was only 30% at a reagent concentration of 10\3mol L\1.
Effect of the length of the hydrocarbon chain on the collector performance. Data have been reported for theSotation of quartz (PZC at pH 2.0) at pH 6}7, using the cationic alkylammonium acetates, with the alkyl chain length varying between C4and C18.
Incipi-ent Sotation occurs from about 10\8mol L\1 for
C18to 10\1for C4. Similarly high rates are observed
at 10\6mol L\1 for C
18 to 0.5 mol L\1 for the C4.
The onset of the highSotation rates are equated to the onset of hemimicelle formation.
Frothers
Chemical types A frother is a surface-active chem-ical whose principal function is to increase signiR -cantly the dispersion of air at a given aeration rate in the pulp phase of a Sotation machine by producing small bubbles; this is done through the reduction of the surface tension at the air}water interface. If the pressure of the dispersed air isp0and the hydraulic
pressure in the liquid at the aerator is ph then the bubble radiusRbwill be:
Rb+ 2 (p0!ph)
[41]
Laskowski has reviewed the mechanism of the ac-tion of surface-active reagents in Sotation. He said that frother molecules have an uneven distribution of polar and non-polar groups which cause them prefer-entially to orientate at the air}water interface with the polar groups forming a liquid Rlm around the bubble by hydrogen bonding with the water and the non-polar groups forming a gaseous Rlm within
the bubble. They may be classiRed intoRve groups: 1. Aliphatic alcohols with a single hydroxy group
R}OH, where R is either a straight-chain alkyl group with Rve to eight carbon atoms or a bran-ched chain with six to sixteen carbon atoms. Typi-cal of the branched alcohols are methyl iso-butyl carbinol (MIBC), di-acetone alcohol and 2-ethyl hexanol. These frothers produce Rne-textured, fairly selective froths.
2. Cyclic alcohols. These are represented by pine and eucalyptus oils of which the active components are the terpene alcohols typically -terpineol. These are traditional frothers and are still used usually in combination with other frothers and collectors in 30% of the world’s copper concentrators. 3. Phenols of which cresylic acid a mixture of cresols
and xylenols, is the most commonly used. 4. AlkoxyparafRns of which the most successful is
1,1,3-triethoxybutane, have come into use in
sul-RdeSotation as they seem also to have collector speciRcity.
5. Finally the polyglycols, particularly poly-propylene glycol, these are available as commer-cial products with the general formula R(X)nOH, where R is either H or CnH2n#1 and X is either
ethylene oxide (EO) }CH2CH2O}, propylene
oxide (PO)}CH2CH(CH3)}O}or butylene oxide
(BO) }CH2CH2CH(CH3)}O}. In the PO and BO
frothers the propylene and butylene groups are hydrophobic and the ether oxygen and the hy-droxyls are hydrophilic. Varying the relative length of the hydrophobic to hydrophilic groups in the molecule permits tailoring the molecule to a speciRc application.
Bubble stability in pulp The crucial property of a bubble in an aerated Sotation cell relates to its ability to survive the collision and attachment of a particle without bursting. Although it is possible to observe that the addition of frothers does increase the stability of a single bubble, a coherent quantitative stability model does not exist. This will need to relate to the ability of its waterRlm surrounding the bubble to withstand local disturbances. This ability is thought to be related to dynamic changes in surface tensions in the Rlm following the local decreases in frother concentration after distortion has occurred following impact with a particle.
Figure 6 Single particle trajectory in the region of a rising bubble. Reproduced with permission from Flint and Howarth (1971) The collision efficiency of small particles with spherical air bubbles.Chemical Engineering Science 26, 1155}1168. agent,aits activity in the bulk solution andLVis the bubble}liquid interface energy:
"! a
RT;
LV
a [42]
This implies that a decrease in a, the surfactant activity, at the gas}liquid interface following local surface increases, will be associated with a very sensi-tive surface tensionincrease.
Bubble^Particle Collision Dynamics
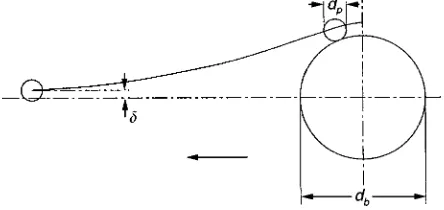
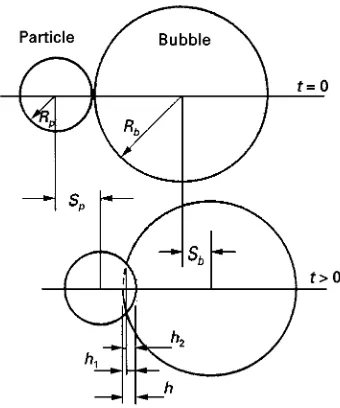
Interception efVciency+single bubble+particle col-lision Flint and Howarth observed that for a ra-tional basis forSotation cell design to be achieved it is necessary that methods for the prediction of bubble}particle collision and subsequent adhesion be available.
For a single particle falling under gravity in the path of a single rising bubble, they provided a general deRnition of collision efRciencyE, as the ratio of the number of particles which collide with the bubble to the number that would have collided if the liquid streamlines had not been diverted by the bubble. Their analysis is based on calculating the trajectories of single particles, initially remote from the bubble, and which are a distancefrom the centreline of the path of the rising bubble (Figure 6). Although all the liquid will pass around the bubble, particles on streamlines which pass closer to the bubble than the radius of the particle, are deemed to have come into contact with the bubble.
Calculation of single particle trajectories The bubble and particle are both assumed to be spherical, with the bubble of radiusRbrising vertically at a velo-city U, and the particle of radius Rp falling under gravity. The trajectory calculation begins at a point where the lateral components of theSowReld ahead
of the rising bubble begin to induce a sideways motion of the particle. At this point the particle is considered to be offset by a distance, , from the centreline of the rising bubble.
The consequence of theSowReld assumed by the authors is that the trajectory is deRned by the initial. A grazing trajectory is deRned where for particles with an initial offset0, the trajectory passes at a
dis-tanceRpfrom the bubble shell on its horizontal dia-meter. For particles at smaller offsets, contact will be made at some point on the bubble shell, while those with'0 will make no contact.
The collision efRciency then follows:
E"
2 0
(Rb#Rp)2
[43]
The particle trajectories under the inSuence of gravity and the Sow pattern ahead of the rising bubble can be computed by integrating eqn [44] with the initial offsetas a boundary condition. The liquid
Sow Reld ahead of the rising bubble is described in two dimensions,y(vertical) andx(horizontal), by its local velocity components uy and ux (assuming axisymmetric Sow) using either the Stokes’ or the potentialSow stream functions. As the particles are very small (Rp(100m) consideration of the inter-action between theSowRelds of particle andSuid is not necessary. The motion of the particle is described by its velocity componentsvyandvx.
The velocity components are normalized by divid-ing by U and setting the dimensionless time
tH"tU/Rb. The equations can then be expressed in terms of the dimensionless parameters K and G, whereK"(2PR2pU)/(9FRb) which is directly related to the ratio of inertial to drag forces on the particle whileG"(2[P!F]R2
pg)/(9FU) represents the ter-minal settling velocity of the particle in an undistur-bed fluid:
KRvHx
RtH"uHx!vHx
[44]
KRvHy
RtH"!G!uHy#vHy
Although this treatment greatly oversimpliRes the
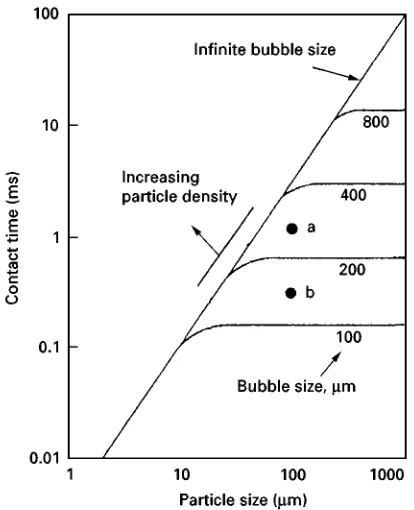
Sow processes in a highly aerated well-stirred suspen-sion of particles in water, it does make interesting statements about the effects of bubble size on the efRciency of collection of a single particle of a given size and density.
Figure 7 Bubble}particle contact time. Reproduced with per-mission from Ye and Miller (1988) Bubble/particle contact time in the analysis of coal flotation.Coal Preparation 5, 147}166. according to:
E" G
G#1 [45]
The upper limit of K"0.1 corresponds for example to a situation of 20m particles in an aerated suspension of 0.2 mm bubbles. Bubbles of this size will rise through still water at
U"5 cm s\1.K for silica, chalcopyrite and galena
under these conditions is respectively 0.06, 0.095 and 0.17; the corresponding G values are 0.028, 0.055 and 0.11.
Using eqn [45], the respective collision efRciencies are 0.027, 0.052 and 0.10. If the bubbles in the aerated suspension were larger, the collision efR cien-cies would drop. For example for 0.4 mm bubbles whose rise velocity U"10 cm s\1, the K values
would fall further below 0.1 and theGvalues would also fall to 0.014, 0.027 and 0.055 with correspond-ingEvalues of 0.014, 0.026 and 0.052.
Thus, while 0.4 mm bubbles are probably satisfac-tory forSoating chalcopyrite and galena, it might be necessary to generate smaller bubbles to Soat silica selectively. However, 60m silica particles will be efRcientlySoated with 1 mm bubbles. The bubble size required for the effective Sotation of 60m chal-copyrite and galena need be no smaller that 5 mm.
These observations are obviously of both technical and economic importance, as while it is unnecessary to generate small bubbles for medium-size sulRde mineral particles, for light silicate mineral particles it may be necessary for selective separation to aerate the pulp suspension down to 100m microbubbles. Bubble+particle contact time + general Following initial interception of the particle by the bubble, two possible modes of contact have been proposed.
First, the bubble shell is considered to deform elas-tically and for the particle either to attach to the bubble, or ultimately to be expelled from the shell under the elastic forces. The contact time is that lapsing between the moment of initial contact when the surface begins to deform, to the time when itRrst regains its original undistorted shape, subsequent oscillations being ignored.
In the second technique the particle after collision with the bubble is assumed to remain in contact with an undeformed surface, while being swept around from the point where it initially made contact, until it approaches the bubble’s wake, where it is detached from the shell. The contact time according to this method is the time lapsed between the original con-tact to