Effect of molecular-scale surface morphology on the surface melting of liquid crystals
on self-assembled monolayers
Jong-Ho Son, Soo-Dong Kim, Jagdish K. Vij, and Jang-Kun Song,
Citation: Appl. Phys. Lett.105, 251601 (2014); doi: 10.1063/1.4904823
View online: http://dx.doi.org/10.1063/1.4904823
View Table of Contents: http://aip.scitation.org/toc/apl/105/25
Effect of molecular-scale surface morphology on the surface melting
of liquid crystals on self-assembled monolayers
Jong-Ho Son,1,2Soo-Dong Kim,2Jagdish K. Vij,3and Jang-Kun Song2,a)
1
Samsung Display Company, Yong-in, Gyeonggi-do 446-811, South Korea
2
School of Electronic and Electrical Engineering, Sungkyunkwan University, Suwon, Gyeonggi-do 440-746, South Korea
3
Department of Electronic and Electrical Engineering, Trinity College, University of Dublin, Dublin 2, Ireland
(Received 16 October 2014; accepted 6 December 2014; published online 22 December 2014)
We devised liquid crystal cell substrates with different surface roughnesses at the molecular scale by controlling the density of two types of trichlorosilanes with different alkyl chain lengths. We investigated surface melting of liquid crystals on these surfaces by observing the anchoring transition (change in the direction of alignment) that usually accompanies surface melting. Surface melting was observed only on substrates that had undulating surface morphologies due to either a low molecular density or interspersed arrangement of the two types of trichlorosilanes. We attributed the surface melting to the influence of molecular-level surface roughness on liquid crys-tal order parameters near the surface.VC 2014 AIP Publishing LLC.
[http://dx.doi.org/10.1063/1.4904823]
Surface, which is the end of continuity of a material, gives rise to various interesting phenomena such as surface plasmons in optics,1 surface magnetism in ferromagnets,2 and pretransitions in fluid systems.3Both molecular ordering and phase changes of thermotropic liquid crystals (LCs) are also significantly influenced by surface effects. LCs near the surface are exposed to “surface fields,” and transit to nematic phase above the bulk isotropic to nematic phase transition temperature (TNI_B), which is commonly called
“pre-wetting.”4 When the free energy difference between two thermally consecutive phases is small, the surface field influ-ences the bulk phase transition temperature as well, as reported by Manna et al. who examined the shift in bulk phase transition temperature of tilted smectic LC phases in thin cells.5 Sheng explained the prewetting phenomenon based on the Landau-de Gennes theory by assuming strong anchoring of ordered LC molecules near the surface,6,7and observed surface ordering of LC molecules over the entire range of temperatures. Boamfaet al.showed experimentally that surface ordering persists in the range of 10–26C above the TNI temperature depending on the surface anchoring
energy. Thus, the phase transition temperature near the sur-face (TNI_S) is thought to be higher than TNI_Bdue to
restric-tion in the degrees of freedom or hindered thermal vibrarestric-tions at the surface. However, this is not universally true. LCs on certain surfaces have a lower TNI_S than TNI_B.8–10
Yokoyamaet al.investigated the shape of isotropic droplets within the nematic phase and the shape of nematic droplets within the isotropic phase near TNIon various surfaces.10As
the preference of the surface for a nematic (or isotropic) droplet became stronger, the contact angle of the nematic (or isotropic) droplet became smaller. Pre-wetting and surface melting may occur when the preference of the surface for ne-matic or isotropic phases, respectively, is extremely large. Yokoyama and colleagues found that SiO layer and bare
glass (silica 72%) weakly preferred the isotropic phase to ne-matic phase, and recently, Ayaet al.reported that the surface transition in a LC mixture with silica (SiO2) nanoparticles
occurred several degrees below the bulk transition tempera-ture.8Evanset al.and Sonet al.used another type of surface to exhibit surface melting: a self-assembled monolayer (SAM), which has long alkyl-chains that are also found in polymer alignment layers.9,11SAM has proven to be an im-portant method for achieving vertical alignment of liquid crystals on glass substrates and indium tin oxide (ITO)-coated glass substrates.9,12Surface melting in these cases is thought to be due to the disordering effect of certain types of surfaces. However, the mechanism of surface melting is still not understood, particularly for SAM surfaces composed of alkyl chains.
Detection of pre-wetting and surface melting is also a challenging task, because the surface phase is extremely thin and its material composition is almost identical to that of the bulk material. Leeet al.directly observed that surface-induced nematic ordering on a rubbed polymer layer reached up to about 20 nm or less above the polymer surface using an in-house optical nanotomographic method.13Boamfa et al.used precise field-induced birefringence measurements,14 and Aya
et al.used highly sensitive differential scanning calorimetry to detect the surface phase transition temperature.7Recently, Son
et al.reported that surface melting in certain cases was accom-panied by an anchoring transition - a transition from vertical alignment of LCs to planar alignment of LCs.9Nematic LCs on the boundary bordering the isotropic phase exhibited planar alignment with no azimuthal anchoring owing to the slippery boundary. Surface melting accompanied by the anchoring tran-sition was readily discernible because of an abrupt change in birefringence observed by polarized optical microscopy (POM). Surface melting can therefore be monitored by detect-ing the anchordetect-ing transition.
In this work, we studied the surface melting of LCs on various SAM layers by detecting the anchoring transition. In
a)
E-mail: [email protected]
particular, we examined the effect of controlling the molecular-level morphological roughness of these layers by changing the densities of two SAM compounds with different molecular lengths on surface melting. The molecular-level roughness was obtained as follows. A uniform morphology was first achieved by depositing short SAM alkyl chains (C8) on the substrate. This arrangement was inter-dispersed with long chain SAM (C18). This caused density modulation of surfaces due to the presence of alkyl chains with varying chain lengths on the surfaces. The morphology of surfaces therefore ranged from uniform to undulating. We found that molecular-level roughness exerted a significant influence on the surface melting phenomenon, although direct detection of molecular level roughness was challenging. We designed our study to determine how molecular-level surface morphology affected the melting of LCs on surfaces at the N-I transition and how the melting phenomenon was related to surface mo-lecular order parameters.
Bare glass substrates were cleaned in piranha solution (70 vol. % H2SO4þ30 vol. % H2O2) for 1 h and
subse-quently rinsed with distilled water. First set of SAM sub-strates (SAM1) were prepared by dipping the rinsed bare glass substrates into a 2 mM octadecyltrichlorosilane [CH3(CH2)17SiCl3, C18, Aldrich] anhydrous toluene solution
for various times ranging from 1 min to 1 h. Substrates were washed with toluene followed by ethanol, dried with nitro-gen, and annealed at 125C for 20 min. Contact angles of water droplets and friction force were measured on each sur-face to investigate how the sursur-face was covered and its molecular-level morphology. SAM layer with long chain alkylsilane had a low surface energy and exhibited moder-ately high contact angles. As shown in Fig.1, the change in water contact angle over time indicated that the glass surface was gradually covered by C18 as immersion time increased, and that coverage reached a saturation level after a 30-min immersion. Friction force measured using an AFM tip increased for low immersion times and deceased again with a further increase in immersion time (Fig.1). Surface rough-ness at the molecular scale is likely to vary according to surface SAM coverage, as described in Fig.2.
A cell was constructed with SAM1 as the bottom sub-strate and a planar-aligned polyimide-coated subsub-strate as the top substrate. The two substrates were separated by a 3.75lm spacer. A LC mixture (MLC-7026–000, Merck Advanced Technologies Ltd., Seoul, South Korea) was used in the cell. A LC droplet was injected into the cells by capil-lary action. SAM layer usually induces vertical alignment of LCs. Surface packing density and morphology of SAM are important factors for aligning LC molecules on the sur-face.9,15 LC alignment was examined as a function of increasing temperature (near TNI) by POM. The shape of
iso-tropic phase appears differently depending on the SAM den-sity on the surface of the substrate at the phase transition temperature. At low and high densities of SAM, isotropic bubbles appeared and the size of the bubbles expanded with increasing temperature. The presence of bubbles indicated that the bulk LCs had transited to isotropic phase. However, for the mid-range of densities, an anchoring transition was observed on the surface prior to the phase transition, as shown in the POM image in Fig. 2(a). The anchoring
transition was due to surface LC melting on the SAM1 sub-strate, as illustrated in Fig.2(a). In the boundary between the nematic and isotropic phases, liquid crystal molecules in the nematic phase are likely to align in a planar rather than a ver-tical manner, resulting in an anchoring transition from verti-cal to planar alignment. Bulk phase transition occurred after the anchoring transition as the temperature increased. The bulk transition was confirmed by the appearance of isotropic bubbles, as shown in the inset image in the middle of Fig.
2(a), which was taken at a temperature ca. 2C higher than the temperature the larger image was taken at.
Surface melting is likely to be affected by molecular order parameters on the surface. When LC molecular order-ing is sufficiently high, LCs near the surface are likely to maintain nematic ordering, even at temperatures higher than the bulk TNI, which is the origin of the prewetting
phenom-enon. In contrast, when LC molecular ordering is low, LCs near the surface are likely to transit to an isotropic phase at temperatures even lower than TNI_B, which is surface
melt-ing. The temperature difference (DTS_B) between surface
melting and the bulk transition was measured and plotted in Fig.2(c). Interestingly, surface melting appeared only in the middle range of SAM concentrations, implying that molecu-lar order parameters at the middle range of SAM densities were relatively low.
These findings indicated that LC molecules near the SAM surface in the middle range of SAM densities were dis-ordered. Two different mechanisms can account for this. The first mechanism is illustrated schematically in Fig.2(b). It is intuitively apparent that when the SAM density is in the mid-dle range, the long alkyl chains are entangled, which increases molecular-level surface roughness. As the SAM density increases further, roughness decreases due to packing effects.16In this way, molecular level surface roughness may influence LC order parameters.
[image:3.612.323.553.52.199.2]The second potential mechanism is the surface energy difference between the glass and SAM layer due to variation in surface coverage by SAM molecules according to immer-sion time. The glass substrate and SAM layer have different surface energies, which gives rise to different LC alignments on the two substrates.9 LCs on a bare glass substrate are likely to align in a planar manner, while those on a SAM layer are likely to align vertically. This explains why the
FIG. 1. DI water droplet contact angles (square data) and AFM friction forces on SAM1 substrates with various C18 densities (circle data).
POM images for the 1-min immersion cell exhibited brighter luminance due to the presence of a pretilt angle than cells immersed for longer periods of time. Hence, in the middle range of SAM densities, planar-aligned LC molecules and vertically aligned LC molecules coexisted on the surface, which may have reduced molecular order parameters.
To elucidate which of the two mechanisms described above was the dominant mechanism underlying surface melting, we designed another set of experiments. We pre-pared a new set of SAM substrates by following the same processes we used to generate the SAM1 substrates except that a shorter alkyl chain (C8 trichlorosilane) (SAM2-A) was used. SAM2-A substrates were coated with different den-sities of C8 SAM, as illustrated in the top of Fig.3(a). Then, substrates were dipped again into a toluene solution of 2 mM C18 trichlorosilane for 240 min at 30C, washed with tolu-ene followed by ethanol, dried with nitrogen, and annealed at 125C for 20 min (SAM2-B). Unlike the SAM1 sub-strates, the SAM2-B substrates were fully covered by C8 or C18 SAM molecules, and no glass was exposed to the liquid crystal layer, as illustrated in the top of Fig.3(b). However, surface roughness was determined by immersion time in C6 trichlorosilane solution. Because of the chain length differ-ence between C8 and C18 trichlorosilane molecules, surface roughness was determined by the relative ratio of C8 to C18
molar concentrations. When the surface was covered by only one of the two molecules, the surface was very even. However, when the two molecules were distributed at similar concentrations, the surface was rough.
Contact angles of a water droplet and a diiodomethane (DIM) droplet were measured on the surfaces of SAM2-A and SAM2-B substrates, and surface energy was calculated using the Owens-Wendt method.17 As shown in Fig. 3(a), the pattern of variation of the contact angle and surface energy of SAM2-A according to different densities of C8 was similar to that observed for the SAM1 layer. However, the variation of the surface energy of SAM2-B is much less than that of SAM2-A, as shown in Fig. 3(b), because all areas that remained uncovered after C8 treatment were cov-ered by C18 molecules during the second immersion. The DI contact angle decreases at short C8 immersions and increases again as the C8 immersion time increases further. As a result, the surface energy is relatively high in the mid range of immersion time.
We made a LC cell using SAM2-B substrates and per-formed POM observations of different cells. Similar to the
FIG. 3. (a) DI water and DIM droplet contact angles and surface energies at different C8 densities for SAM2-A and (b) for SAM2-B. A schematic illus-tration of each surface is shown.
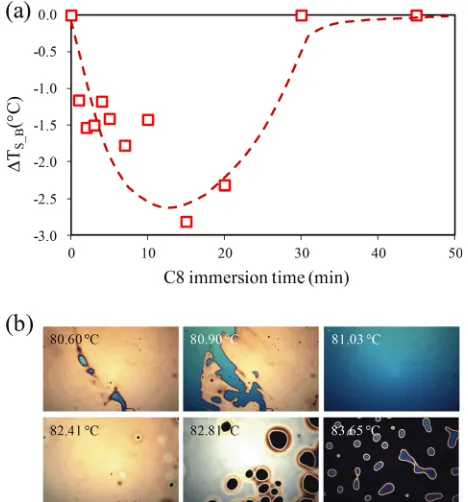
[image:4.612.58.289.53.386.2] [image:4.612.329.551.70.463.2]results for the SAM1 cells, surface melting was observed only in the middle range of C8 immersion times. An example of surface melting in a cell made by immersing the substrate for 20 min in C8 solution is shown in Fig.4(b). We measured the temperature difference (DTS_B) between the surface
melting and bulk transition for the SAM2-B cells. As shown in Fig.4(a), the shift in surface phase transition temperature was similar to that observed for SAM1 substrate cells, which implies that the main mechanism underlying surface melting of LCs is surface roughness conferred by variations in molecular-scale spatial undulation of different alkyl chains, but not exposure to two heterogeneous surfaces. The cell used in Fig.4(b)was a thick cell with more than 10lm, and a planar alignment was used on the other surface to clearly observe the surface melting. As the temperature increased, blue domain appeared. The blue color indicates a large bire-fringence. The blue color expanded into all area of the cell, and the color changed gradually into brown and again white indicating low birefringence. The brown and white colors at 82.41C and 82.81C indicate the decrease in thickness of bulk nematic phase.
The DI water contact angle and the surface energy shown in Fig.3(b)qualitatively match with the shift in sur-face phase transition temperature in Fig.4(b). However, nei-ther polarized ellipsometric measurements, AFM friction force measurements, nor AFM adhesive force measurements gave reasonable discrimination for molecular-scale rough-ness (data not shown) of the SAM2-B substrates. Direct mea-surement of molecular-scale roughness remains a challenging task.
In conclusion, we found that the anchoring transition is an excellent way to quantitatively detect the surface melting
of liquid crystals on surfaces. We controlled the surface roughness at molecular scale using two types of trichlorosi-lanes with different alkyl chain lengths. The surface rough-ness at molecular level directly caused the surface melting. Recently, it was reported that the surface roughness at larger scales (approximately hundreds nm) influences the macro-scopic alignment of liquid crystals.18On the other hand, the surface roughness at molecular scale influences the order pa-rameter of liquid crystals.
This work was supported by the National Research Foundation of Korea (NRF) Grant funded by the Korea Government (MSIP) (No. 2012R1A1A1012167). J.K.V. stay in SKKU in 2012-13 was funded by WCU program.
1W. L. Barnes, A. Dereux, and T. W. Ebbesen, “Surface plasmon
subwave-length optics,”Nature424, 824 (2003). 2
S. Alvarado, M. Campagna, and H. Hopster, “Surface magnetism of Ni(100) near the critical region by spin-polarized electron scattering,”
Phys. Rev. Lett.48(1), 51 (1982). 3
M. R. Moldover and J. W. Cahn, “An interface phase transition: Complete to partial wetting,”Science207(4435), 1073 (1980).
4
K. Miyano, “Wall-induced pretransitional birefringence: A new tool to study boundary aligning forces in liquid crystals,”Phys. Rev. Lett.43(1), 51 (1979).
5
U. Manna, J. K. Song, G. Power, and J. K. Vij, “Effect of cell surfaces on the stability of chiral smectic-C phases,” Phys. Rev. E 78(2), 021711 (2008).
6P. Sheng, “Phase transition in surface-aligned nematic films,”Phys. Rev.
Lett.37(16), 1059 (1976). 7
S. Aya, Y. Sasaki, F. Araoka, K. Ema, K. Ishikawa, A. V. Emelyanenko, and H. Takezoe, “Observation of two isotropic-nematic phase transitions near a surface,”Phys. Rev. Lett.106(11), 117801 (2011).
8
S. Aya, Y. Sasaki, F. Araoka, K. Ishikawa, K. Ema, and H. Takezoe, “Isotropic-nematic transition at the surface of a liquid crystal embedded in an aerosil network,”Phys. Rev. E83(6), 061714 (2011).
9
J. H. Son, W. C. Zin, H. Takezoe, and J. K. Song, “Alignment of liquid crystals using a molecular layer with patterned molecular density,”Adv. Mater.24(45), 6105 (2012).
10H. Yokoyama, S. Kobayashi, and H. Kamei, “Boundary dependence of the
formation of new phase at the isotropic-nematic transition,”Mol. Cryst. Liq. Cryst.99(1), 39 (1983).
11
S. D. Evans, H. Allinson, N. Boden, T. M. Flynn, and J. R. Henderson, “Surface plasmon resonance imaging of liquid crystal anchoring on pat-terned self-assembled monolayer,”J. Phys. Chem. B101, 2143 (1997). 12
M. R. Vengatesan, S.-H. Lee, J.-H. Son, M. Alagar, and J. K. Song, “In situself-assembled photo-switchable liquid crystal alignment layer using azosilane monomer-liquid crystal mixture system,”Liq. Cryst.40(9), 1227 (2013); S.-H. Lee, J.-H. Son, W.-C. Zin, S. H. Lee, and J. K. Song, “Self-constructed stable liquid crystal alignment in a monomer-liquid crystal mixture system,”ibid.39(9), 1049 (2012).
13J.-H. Lee, T. Atherton, V. Barna, A. De Luca, E. Bruno, R. G. Petschek,
and C. Rosenblatt, “Direct measurement of surface-induced orientational order parameter profile above the nematic-isotropic phase transition tem-perature,”Phys. Rev. Lett.102(16), 167801 (2009).
14M. I. Boamfa, M. W. Kim, J. C. Maan, and T. Rasing, “Observation of
sur-face and bulk phase transitions in nematic liquid crystals,” Nature 421(6919), 149 (2003).
15
M. R. Vengatesan, S. H. Lee, J. H. Son, J. K. Lim, and J. K. Song, “Effect of molecular structure and packing density of an azo self-assembled monolayer on liquid crystal alignment,”J. Colloid Interface Sci.407, 310 (2013). 16
H. S. Lee, D. H. Kim, J. H. Cho, M. Hwang, Y. Jang, and K. Cho, “Effect of the phase states of self-assembled monolayers on pentacene growth and thin-film transistor characteristics,” J. Am. Chem. Soc.130(32), 10556 (2008).
17
D. K. Owens and R. C. Wendt, “Estimation of the surface free energy of polymers,”J. Appl. Polym. Sci.13(8), 1741 (1969).
18S. Kundu, M. H. Lee, S. H. Lee, and S. W. Kang, “In situhomeotropic
alignment of nematic liquid crystals based on photoisomerization of azo-dye, physical adsorption of aggregates, and consequent topographical modification,”Adv. Mater.25(24), 3365 (2013).
FIG. 4. (a) Surface melting temperature range at different C8 densities for SAM2 LC cells and (b) microscopic images of surface melting. Here, we used an opposite side substrate with planar alignment layer and a large cell thickness (about 20lm) to better discern surface melting.
[image:5.612.57.291.472.723.2]