PROOF COPY 003302JFG
Andreas Ruhrmann
Xin Zhang
Aeronautics and Astronautics, School of Engineering Sciences, University of Southampton, Southampton SO17 1BJ, UK
Influence of Diffuser Angle
on a Bluff Body in Ground Effect
The forces and pressures on a generic bluff body in ground effect were investigated. The bluff-body model was equipped with interchangeable underbody diffuser ramps and side plates. Five different diffuser angles were tested: 5, 10, 15, 17, and 20 deg to the hori-zontal. The experiments were undertaken in a low-speed wind tunnel equipped with a moving ground. Load cells, pressure taps, and surface flow visualization were the tech-niques used to evaluate the flow field. The flow field is characterized by vortex flow and three-dimensional flow separation. A region of hysteresis was found for the 15, 17, and 20 deg diffusers. As the ride height is varied, five different flow types can be identified with three subtypes within the region of hysteresis. The force reduction phenomenon was found to be caused by both vortex breakdown and flow separation. 关DOI: 10.1115/1.1537252兴Introduction
A symmetrical body in ground effect will generate aerodynamic force pointed to the ground 共downforce兲. The flow between the body and the ground is accelerated leading to reduced pressure. Introducing camber to the body in the form of an upswept ramp at the rear creates a diffuser between the ground and the body. Since the diffuser exits to the base pressure of the model, the flow under the model accelerates to a greater degree than without the diffuser. This increase in downforce is accompanied by complex flow physics within the diffuser. The upsweep initiates three-dimensional flow separation which leads to vortex formation and possible flow reversal. This area of research is especially impor-tant in the automobile industry with respect to performance and safety. A complete understanding of the complex fluid flow phys-ics is essential for the development of flow control measures.
Currently there is only limited research published in the field of diffuser flow in ground effect,关1– 6兴. The general principle of how a diffuser functions in ground effect is described by Sovran关3兴. It is likened to a venturi, with the flow rate under the model gov-erned mainly by the efficiency of the diffuser. As the diffuser efficiency is increased, the flow rate increases and the static pres-sure under the model drops leading to a rise in the level of down-force. The study completed by Cooper et al.关4兴found that as the ride height is reduced down to a critical ride height, the downforce increases. Below the critical ride height, the downforce reduces rapidly. It was surmised that at this ride height, the ground and model boundary layers form a substantial proportion of the flow into the diffuser. Senior and Zhang关6兴found that for a bluff body with a 17-deg diffuser, the rapid reduction in downforce was not due to the increased influence of the boundary layers as changes in the Reynolds number did not influence the critical ride height. They also found that one of the two counterrotating vortices that form in the diffuser disappears below the critical ride height re-sulting in an asymmetric flow pattern with flow reversal on one side. Four different types of force behavior were identified through a range of ride heights.
The goals of the present research is to further the understanding of the complex three-dimensional flow field to aid the develop-ment of improved diffuser design and methods of flow control. To aid in the understanding of the complex flow phenomena, several different diffuser ramp angles were studied to investigate the ef-fects of area ratio, pressure gradient and ground proximity. The diffuser ramp angles investigated were 5, 10, 15, 17, and 20 deg to the horizontal. The various angles are tested to establish a
data-base of results for comparison with computational fluid dynamics and from which flow control methods could be developed. The range of angles includes lower angles 共5 and 10 deg兲where no flow separation occurs in two dimensional planar diffusers. These will hopefully show the influence of the separation bubble on the force-ride height characteristics of the diffusers with larger diver-gence angles.
Experimental Setup
The experiments were undertaken at the University of Southampton in the low-speed closed-circuit wind tunnel with test section dimensions of 2.1 m⫻1.5 m. The wind tunnel is equipped with a moving ground measuring 3.5 m in length and 1.5 m in width. The experiments were run at a wind and ground speed of 30 m/s at a freestream turbulence level of 0.2%. There is a bound-ary layer removal system ahead of the moving ground. It consists of a slot through which the boundary layer passes and a perforated plate just ahead of the belt 共moving ground兲 through which the remainder of the boundary layer is sucked. The velocity reaches freestream values 2 mm above the belt. Further details can be found in Senior关7兴.
A schematic of the wind tunnel setup is shown in Fig. 1. It is mounted on a motorized main strut and tail wire共a free pivoting, thin carbon strut兲 configuration. The motorized struts are each powered by a stepper motor allowing the model to be moved up to a maximum ride height of 180 mm. The lowest ride height is constrained by a minimum safety clearance above the moving ground.
The bluff body of the model is constructed of carbon fiber. Using different diffuser ramps, the angle of the diffuser can be varied. The ramps are constructed of 3-mm steel sheets. The angles tested are 5, 10, 15, 17, and 20 deg. This range of angles was chosen to create a better understanding of different flow phys-ics which occur at the different ride heights. By varying the dif-fuser angle, the significance of the blockage between the ground and the model underbody can be investigated as the various flow types will occur at a different ride height for each diffuser angle. Transition on the model is fixed using a 0.4-mm diameter wire placed at 100 mm from the nose of the model.
The tests conducted include force measurements, surface pres-sure meapres-surements, and oil-streak flow visualisation. The forces are measured using a two component load cell共vertical and hori-zontal forces兲on the base of the main strut and a single compo-nent load cell共vertical force兲on the top of the tail wire. A total of 186 pressure taps are arranged on the underside and base of the model to give both centerline pressures and spanwise
measure-Contributed by the Fluids Engineering Division for publication in the JOURNAL OFFLUIDSENGINEERING. Manuscript received by the Fluids Engineering Division July 16, 2001; revised manuscript received October 7, 2002. Associate Editors: J. Bridges and J. Katz.
ments. The pressures were measured using a zero operate calibrate
共ZOC兲 system. A mixture of titanium dioxide and light oil was used to visualize the surface streak lines.
Applying the procedure described by Moffat 关8兴 the single-sample uncertainties in the experiment were calculated. The ride height was kept to within⫾0.1 mm and the yaw angle was set to
⫾0.05 deg. The forces were averaged over 15 seconds at each ride height, with a one-second delay between ride height changes. The pressures on the ZOC were sampled for ten seconds on each of the two banks, also with a one second delay between ride height change. For the 20-deg diffuser at 90-mm ride height, the uncertainties in the CL and CD measurements are⫾0.0016 and ⫾0.0008, respectively. The uncertainty in the pressure measure-ments in the previous configuration for a CPof⫺2.0 is⫾0.0188.
This uncertainty incorporates the quoted accuracy of the equipment.
Results and Discussion
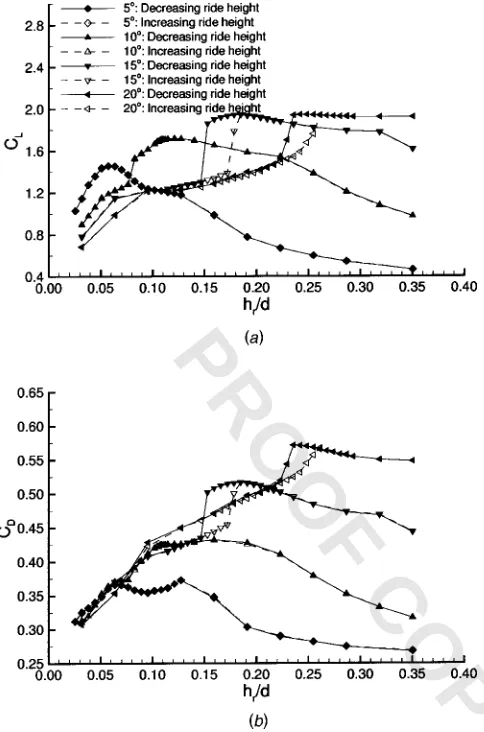
Definition of Flow Regimes. The downforce and drag curves in Fig. 2 demonstrate that there are two different types of flow regimes dependent on the diffuser angle. The curves for the 15, 17, and 20 deg共high angle兲diffusers have similar characteristics as do the 5 and 10 deg共low angle兲diffusers. The 10-deg diffuser appears to be more of a transition angle between the two types as it contains characteristics of both. As the height above the moving ground is varied, the slopes of the curves change indicating changes in the flow physics. The high angle diffusers demonstrate
the same characteristics as found by Senior and Zhang关6兴. Utiliz-ing the movUtiliz-ing strut, one additional flow type along with exten-sions to three of the existing flow types in the region of hysteresis were identified. All flow types are described in Table 1. The dif-ferent flow regions are shown on the downforce curve for the 15-deg diffuser in Fig. 3. Starting the wind tunnel with the model at a fixed height within the region of hysteresis, the flow always reverted to the curve of lower downforce. The high downforce portion of the hysteresis loop was found to be unstable, as any disturbances would trigger it to fall onto the low downforce curve. During the 15-second sampling period of the forces, a real time display of the measured forces indicated that the flow was un-steady in this region. The real time display of the measured forces suggested that most of region b and all of regions c, d, d⬘, and e were unsteady as well.
Comparing the downforce curves of the low angle diffusers to those of the high angle diffusers, distinctions between the two sets are identifiable. Although the curves are similar, the closer prox-imity to the ground introduces differences. There is no hysteresis loop and the sudden reduction in downforce is not as pronounced. Type a and b flow still exist, however, there is a pronounced increase in downforce through the lower portion of region b. This is clearest for the 5-deg diffuser. Type c and d flow exist only to a very limited extent for the 10-deg diffuser. Due to the lower ride heights, it is assumed that both the underbody and ground bound-ary layers form a considerable proportion of the flow entering the diffuser at these ride heights, causing the direct transition into type
PROOF COPY 003302JFG
e flow. The underbody boundary layer is predicted to be (O)0.096 d from flat plate theory, although this value will cer-tainly change with the favorable pressure gradient and increased flow velocity under the model. Measurements by Senior关7兴using laser doppler anemometry supports our assertion.
Maximum Downforce. Reducing the normalized ride height with the diffuser angle, it becomes apparent that the maximum downforce occurs at similar values of hr/(d⫻)共Fig. 4兲, where
is the divergence angle of the diffuser in radians. The maximum
occurs at approximately 0.7 hr/(d⫻). Using this, the diffuser
angle共or length兲could be optimised with regard to expected ride heights.
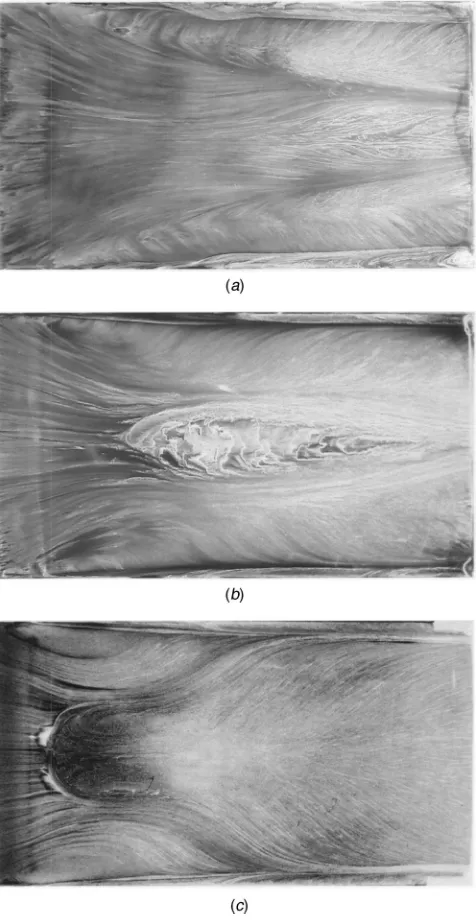
Flow visualization on the ramp surfaces taken at maximum downforce as shown in Fig. 5, demonstrate some of the differ-ences between the low and high angle diffusers. There is no sepa-ration bubble on the 5-deg ramp, although towards the end of the diffuser, the flow appears to be slow and unsteady. The flow on the 10-deg diffuser ramp demonstrates a closed separation bubble. The bubble forms somewhat downstream of the inlet and closes just ahead of the diffuser exit. Upstream of this point, the vortices appear to become wider, with a reduced swirl indicating the onset of vortex breakdown. The open separation bubble forming on the 20-deg diffuser ramp is very similar to those found on the 15 and 17 deg diffuser ramps. From the surface flow patterns downstream of the primary separation line, there appears to be only a small region where the flow is reversed. The separated flow is entrained into the vortices reducing the axial momentum. The reduced swirl of the vortices downstream of the primary separation line are an indication of vortex breakdown. In comparison to the the 10-deg diffuser, the primary flow separation line is closer to the inlet at the center of the ramp. For the 15 and 17 deg diffuser ramps, the primary flow separation line moves closer to the inlet below the maximum downforce ride height up to the point where the flow becomes asymmetrical.
Variation of Ride Height. At larger ride heights 共type a flow兲, the adverse pressure gradient along the diffuser centerline is relatively weak共Fig. 6兲. The ratio of exit area to inlet area is low.
Fig. 2 Force curves: 30 mÕs; „a… downforce coefficient, „b…
[image:3.612.62.304.36.402.2]drag coefficient
Table 1 Flow types in high angle diffusers
Type Direction Description„see Fig. 3…
a both increasing downforce with reducing ride height b both almost constant region high downforce, slight increase
with reducing ride height
b⬘ down an extension of b when the ride height is decreasing, downforce starts to reduce c up rapid increase in downforce with ride height c⬘ down rapid downforce reduction with a small decrement
in ride height
d both an almost flat region of low downforce
d⬘ up an extension of d when the ride height is increasing, slow increase in downforce
e both a further reduction in downforce at flow ride heights Regions b⬘and c overlap共in terms of ride heights兲, as well as d⬘and c⬘.
Fig. 3 Flow types for high angle diffusers: 15 deg diffuser,CL, 30 mÕs
Fig. 4 Downforce coefficients: renormed ride heights, 30 mÕs
[image:3.612.318.549.537.713.2] [image:3.612.61.299.596.721.2]No quasi-two-dimensional flow separation occurs in the center of the diffuser ramps. As the ride height is reduced through this region of type a flow, the area ratio共ratio of exit to inlet area of the diffuser兲 increases along with the effect of moving closer to the ground. The flow speed under the model rises共reduced static pressure, see Fig. 6(a)) resulting in increased downforce. The flow is dominated by two counter rotating vortices which prevent or limit the formation of a separation bubble. The pressure at the inlet of the diffuser reduces with ride height. Low pressure regions form in the corners of the diffuser where the vortices originate
共Fig. 7兲. Figure 8 shows that the average base pressure of the model remains fairly constant throughout this region, although for the 5-deg diffuser, the base pressure begins to drop at a higher ride height (hr/(d⫻)⫽2.2) indicating a change in the flow physics.
Reducing the ride height further in region b for the large angle diffusers, the flow field starts to change. The average base
pres-sure of the model drops quickly共Fig. 8(a)) indicating a loss of pressure recovery within the diffuser. Drawing a parallel to two-dimensional planar diffusers, a reduction in pressure recovery is generally associated with the onset of flow separation. In the case of the high angled diffusers, this is the case. The flow starts to separate at the inlet in the center of the diffuser. This separation bubble ceases to exist downstream as the vortices grow in
diam-Fig. 5 Surface flow visualization on the ramp at maximum downforce, 30 mÕs. Flow from left to right. Picture area corre-sponds to the ramp area.„a…5-deg diffuser:hrÕ„dÃ…Ä0.657, „b… 10-deg diffuser hrÕ„dÃ…Ä0.694, „c… 15-deg diffuser—
moving down:hrÕ„dÃ…Ä0.584.
Fig. 6 Centerline pressure coefficients: 30 mÕs.„a…20 deg dif-fuser,„b…5 deg diffuser.
Fig. 7 Surface pressure coefficients: 20 degree diffuser,
[image:4.612.62.300.37.497.2] [image:4.612.312.553.545.704.2]PROOF COPY 003302JFG
eter. However, in the case of the 5-deg diffuser, no such flow separation is apparent. The cause of this reduction in pressure recovery may be due to the onset of vortex breakdown. As a vortex begins to breakdown, the axial velocity of the core reduces. This effectively reduces the area ratio of the diffuser as the lower speed in the cores of the vortices essentially decreases the exit area of the diffuser. The velocity of the air between the vortices down the centerline appears to increase as the centerline pressure coefficients along the length of the diffuser ramp reduce 共Fig. 6(b) when moving from an hr/(d⫻) value of 1.095 to 0.730.
The second set of vortices present at 1.241 hr/(d⫻) at
approxi-mately z/d⫽⫾0.4 towards the end of the diffuser diminish in strength to 0.730 hr/(d⫻) 共Fig. 9兲. The vortices at the edge of
the ramp increase in strength.
In the case of the 5-deg diffuser, the minimum base pressure occurs at the onset of type b flow. The peak in the drag curve at this point is due to the large base area of the model in this con-figuration. The lower diffuser angle and ride heights limit the strength and size of the vortices in the diffuser resulting in lower induced drag relative to the higher angled diffusers, as a result, the pressure drag becomes increasingly significant. An increase of base pressure beyond this point indicates that the boundary layers entering the diffuser are beginning to influence the flow to a larger degree. Whereas with the 17-deg diffuser the base pressure re-duces to a minimum at the point where the hysteresis loop closes at the lower ride height, the base pressure for the 5-deg diffuser
increases beyond the maximum downforce. As the boundary lay-ers make up an increasing proportion of the diffuser inlet, the flow rate under the model decreases reducing the importance of the diffuser, moving towards the limiting case of zero ride height where no air passes under the model or through the diffuser.
The vortex observed in the current study is similar in characters to the leading edge vortex studied by Polhamus 关9兴 using a leading-edge suction analogy and by Wentz and Kohlman关10兴in a wind tunnel model test. In Fig. 10 evidence of vortex breakdown can be seen. As described in an earlier work of Lambourne and Bryer关11兴, the surface streaklines change downstream of the vor-tex bursting point. The swirl becomes less evident and the vorvor-tex becomes wider. This may also be a contributing factor to the en-suing asymmetry of the flow at lower ride heights. The apparent unsteadiness of the flow field may result in the bursting point of one vortex to move further upstream momentarily, causing a dis-turbance to the pressure field resulting in the asymmetric flow of region d.
The importance of the separation bubble in the center of the diffuser inlet can be seen in Fig. 10. Just before the hysteresis loop
Fig. 8 Mean base pressures, 30 mÕs;„a…20 deg diffuser,„b…5 deg diffuser
[image:5.612.330.531.33.284.2]Fig. 9 Pressure contours: 5 deg diffuser, 30 mÕs; „a… hrÕ„d Ã…Ä1.241,„b…hrÕ„dÃ…Ä0.730
Fig. 10 Surface flow visualization on the ramp: 20 deg dif-fuser,hrÕ„dÃ…Ä0.694, 30 mÕs. Flow from left to right. Picture
area corresponds to the ramp area.
[image:5.612.315.552.547.696.2]closes, at the lower end of region b⬘, the separation bubble has almost reached the inlet of the diffuser. At the point where the hysteresis loop is closed at the lower end moving through region c⬘, the flow becomes asymetrical as shown in Fig. 11. Once the separation point reaches the inlet it cannot travel further upstream due to the favorable pressure gradient ahead of the inlet. Due to the extremely low pressures to either side of the inlet共Fig. 12兲, any disturbances will cause the large asymmetry in the flow to occur. The separation bubble gets swept to one side and a large recirculation region forms.
The direction of the asymmetry occurred randomly, but once established did not switch sides. This gives further indication that the type b flow is unstable. As found in experiments with high speed flows over axisymmetric bodies, any slight imperfection on the surface can cause asymmetries in the vortex flow field. As slight movement of the model may trigger the asymmetry in the flow field to take one direction over the other.
Progressing downwards through region d, the focus point close to the inlet of the diffuser on the side of the recirculating region
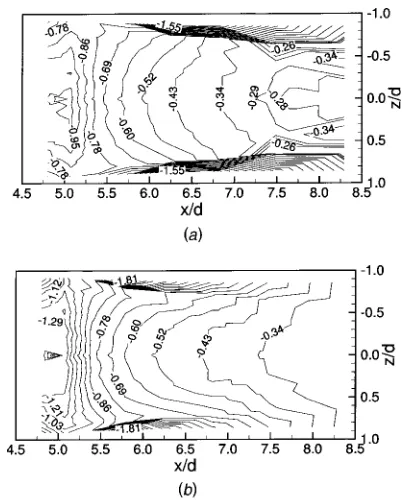
共Fig. 11兲 moves downstream and towards the center of the dif-fuser. The region of recirculating flow is easily identifiable in the pressure contour plot of the 20-deg diffuser within type d flow in Fig. 13 as the large region of constant pressure. The pressure coefficients indicate that the remaining longitudinal vortex is not as strong as those at higher ride heights.
Flow type e is characterized by a steepening of the downforce curve. For the large angle diffusers this appears to occur when the ride height reaches the order of magnitude of the expected bound-ary layer thickness. From the pressure coefficient contour plot in Fig. 14 at a ride height of 0.091 hr/(d⫻) it is clear that the flow
is separated over the majority of the diffuser ramp. The slight asymmetry in the contours is caused by a weak vortex forming on one side of the inlet. The centerline pressures from Fig. 6(a) show that the pressure spike is reduced dramatically and occurs
Further Discussion
The plot of drag variation with ride height for the 5 and 10 deg diffusers共Fig. 2(b) show two peaks, although the trough is better defined for the 5-deg diffuser. As can be seen with the pressure plots from the 5-deg diffuser in Fig. 9, at 1.241 hr/(d⫻) or
0.108 hr/d there is a second set of vortices present, inboard of the
first. These are no longer present on the pressure plot at 0.730 hr/(d⫻) or 0.064hr/d. The ouboard votices appear to
increase in strength as the minimum CPdrops with reducing ride
height. Between these two ride heights, the centerline pressure coefficients共Fig. 6(b)) also drop along the length of the diffuser, with a larger difference at the inlet and approaching the same value at the exit. Figure 8(b) shows an increase in the mean base pressure between these ride heights. The weakening of the inboard vortices, and the ensuing increase of the axial velocity through the diffuser cause an increase in the downforce. As the inboard vorti-ces burst, the initial increase in downforce due to the strengthen-ing of the outboard vortices is gradual. As the ride height is re-duced, the flow through the diffuser becomes increasingly two-dimensional in nature as the aspect ratio (2d/hr) of the inlet
increases to a value of 31.4 at 0.730 hr/(d⫻). The expansion of
the axial flow region through the center of the diffuser improves the pressure recovery of the diffuser, creating the peak in the downforce at 0.730 hr/(d⫻). It is surmized that the dip in the
drag curve is caused by the increasing base pressure and by a reduction in the induced drag due to the diminishment of the inboard vortices. The increase in drag below the trough is most likely caused by the increase of strength in the outboard vortices and the accompanying increase of induced drag. The base pres-sure in this region does not increase as rapidly as when the the drag reduces.
A map of diffuser performance, Fig. 15, shows the different operating regions of the different diffusers angle with respect to
Fig. 12 Surface pressure coefficients: 20 deg diffuser,hrÕ„d
PROOF COPY 003302JFG
area ratio. The shift from steady symmetric flow共type a兲 to un-steady and symmetric共type b兲occurs as similar area ratios for all diffuser ramp angles, indicating that it is primarily governed by the adverse pressure gradient. The narrowing of the unsteady-symmetric region towards the larger diffuser angles indicates that the streamwise adverse pressure gradient along the diffuser is not the driving factor for the transition to asymmetric flow. From the negative slope of this boundary it is clear that the underbody and ground boundary layers are not an important aspect of this transi-tion. If the boundary layers were an influencing factor, the shift would occur at lower area ratios for the lower diffuser ramp angles as the effective inlet area would be reduced. Supporting evidence of the above observation can also be found in the wing in ground study of Zerihan and Zhang 关12兴 and the high angle diffuser study of Senior and Zhang关6兴, where fixed ground tests were also performed. We have also performed fixed ground tests for all the angles. These fixed ground tests produced essentially the same observations. The effect of a fixed ground was first pointed by Burgen et al.关13兴using, among other things, a bluff body in ground effect. The use of a fixed ground generally results in a downward shift in the downforce curve because of an effec-tive reduction on mass flow rate between the ground and the model. An additional factor is the reduction in the effective ground height due to the displacement effect of the boundary lay-ers. A change in the fundamental force characteristics does not occur above flow region e.
Summary
1 It is surmized that for the lower angled diffusers, vortex breakdown is the primary cause of force reduction. A combination of flow separation and vortex breakdown causes the force reduc-tion for the high angle diffusers.
2 The underbody boundary layers do not appear to change the force characteristics of the diffuser at ride heights above region e, the onset of which approximately corresponds to the estimated boundary layer thickness. This occurs at a much larger ride height for the fixed ground case,关6兴.
3 A region of hysteresis occurs over the force reduction region for the 15, 17, and 20 degree diffusers.
4 The flow through the low angled diffusers is influenced by the underbody, and presumeably ground, boundary layers. Espe-cially the formation and breakdown of the vortices.
5 The flow is unsteady in regions b, c, d, and e.
Acknowledgments
Andreas Ruhrmann wishes to thank British American Racing for providing a scholarship. The authors wish to thank Willem Toet and Andrea Senior for their help and suggestions.
Nomenclature
CD ⫽ drag coefficient, D/q⬁S CL ⫽ downforce coefficient, L/q⬁S CP ⫽ pressure coefficient, ( p⫺p⬁)/q⬁
D ⫽ drag
L ⫽ downforce
M ⫽ pitching moment
p ⫽ static pressure
p⬁ ⫽ freestream static pressure
q⬁ ⫽ freestream dynamic pressure,⬁U⬁2/2
U⬁ ⫽ freestream velocity Re ⫽ Reynolds number,⬁U⬁l/
S ⫽ model frontal area
d ⫽ model half-width measured in y -direction
hr ⫽ model ride height l ⫽ length of model
x, y ,
z ⫽ cartesian coordinates: x⫹ve downstream, y⫹ve up, z
⫹ve to port
⬁ ⫽ freestream density ⫽ viscosity
⫽ diffuser expansion angle
References
关1兴George, A. R., 1981, ‘‘Aerodynamic Effects of Shape Camber, Pitch, and Ground Proximity on Idealized Ground Vehicle Bodies,’’ ASME J. Fluids Eng., 103, pp. 631– 638.
关2兴George, A. R., and Donis, J. E., 1983, ‘‘Flow Patterns, Pressures, and Forces on the Underside of Idealized Ground Effect Vehicles,’’ Proceedings of the ASME, Fluids Engineering Division, 7, ASME, New York, pp. 69–79. 关3兴Sovran, G., 1994, ‘‘The Kinematic and Fluid-Mechanic Boundary Conditions
in Underbody Flow Simulation,’’ Proceedings of the CNR-Pininfarina Work-shop on Wind Tunnel Simulation of Ground Effect, Turin, Italy, May. 关4兴Cooper, K. R., Bertenyi, T., Dutil, G., Syms, J., and Sovran, G., 1998, ‘‘The
Aerodynamic Performance of Automotive Underbody Diffusers,’’ SAE Paper No. 980030.
关5兴Cooper, K. R., Sovran, G., and Syms, J., 2000, ‘‘Selecting Automotive Diffus-ers to Maximize Underbody Downforce,’’ SAE Paper No. 2000-01-0354. 关6兴Senior, A. E., and Zhang, X., 2001, ‘‘The Force and Pressure of a
Diffuser-Equipped Bluff Body in Ground Effect,’’ J. Fluid Eng., 123, pp. 105–111. 关7兴Senior, A. E., 2002, ‘‘An Investigation of a Generic 3D Diffuser in Ground
Effect,’’ Ph.D. thesis, University of Southampton, Apr.
关8兴Moffat, R., 1988, ‘‘Describing the Uncertainties in Experimental Results,’’ Exp. Therm. Fluid Sci., 1, pp. 3–17.
关9兴Polhamus, E. C., 1971, ‘‘Predictions of Vortex-Lift Characteristics by a Leading-Edge Suction Analogy,’’ J. Aircr., 8共4兲, pp. 193–199.
关10兴Wentz, Jr., W. H., and Kohlman, D. L., 1971, ‘‘Vortex Breakdown on Slender Sharp-Edged Wings,’’ J. Aircr., 8共3兲, pp. 156 –161.
关11兴Lambourne, N. C., and Bryer, D. W., 1962, ‘‘The Bursting of Leading-Edge Vortices—Some Observations and Discussion of the Phenomenon,’’ Aeronau-tical Research Council, Reports and Memoranda No. 3282.
关12兴Zerihan, J., and Zhang, X., 2000, ‘‘Aerodynamics of a Single Element Wing in Ground Effect,’’ J. Aircr., 37共6兲, pp. 1058 –1064.
关13兴Burgin, K., Addey, P. C., and Beatham, J. P., 1986, ‘‘Wind Tunnel Tests on Road Vehicle Models Using a Moving Belt Simulation of Ground Effect,’’ J. Wind. Eng. Ind. Aerodyn., 22, pp. 227–236.
Fig. 15 Different flow regimes