i
CHARACTERISATION OF THE FUNCTIONAL
ROLE OF OCTN1 IN THE PATHOGENESIS OF
COPD
by
Caoimhe Geraldine Clerkin, B.A. Pg.Cert.
A dissertation submitted for the degree of Doctor of Philosophy
at the
University of Dublin, Trinity College
This research was conducted in the School of Pharmacy and
Pharmaceutical Sciences, Trinity College, Dublin 2, Ireland
Under the direction and supervision of
Dr. rer. nat. Carsten Ehrhardt
ii
iii
Declaration
I declare that this thesis has not been submitted as an exercise for a degree at this or any other university and it is entirely my own work.
I agree to deposit this thesis in the University’s open access institutional repository or allow the library to do so on my behalf, subject to Irish Copyright Legislation and Trinity College Library conditions of use and acknowledgement.
iv
Summary
The organic cation transporter (OCTN1) has been reported to play a role in the pathogenesis and development of inflammatory diseases. However, this association remains conflicting. Without fully elucidating the physiological function of OCTN1, the link between the transporter and these diseases will never be understood.
For the first time this research has identified the functional role of OCTN1, through the uptake and transport of Ergothioneine (ET) in the bronchial epithelial cell line, NCI-H441. Three novel single nucleotide polymorphisms (SNPs) of the gene responsible for the coding of OCTN1 i.e. SLC22A4 in the cell line NCI-H441 were identified. However, the functional impact of these mutations on the functional activity of OCTN1 is not yet fully understood. Furthermore, the transport of ET, the physiological substrate of OCNT1, was determined to be pH and temperature dependent. The antioxidant potential of ET was confirmed by counteracting reactive oxygen species (ROS) production intracellularly. It is suggested that ET carries out its cytoprotective properties by stabilising the intracellular pH.
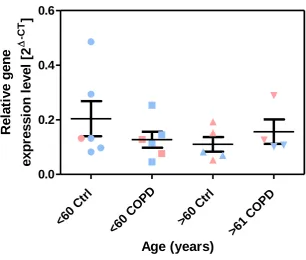
Once characterisation of OCTN1 in vitro was completed it was important to investigate its expression in patients suffering from Chronic Obstructive Pulmonary Disease (COPD). Bronchial epithelial samples were isolated and SLC22A4 was quantified by quantitative reverse transcriptase polymerase chain reaction (qRT-PCR). It was identified that risk factors such as age, weight and cigarette smoking, upregulated the expression of the gene. Further, upregulation of the gene also occurred with reduced lung capacity, a key determinant of the pathogenesis and severity of COPD. This research for the first time has identified a significant association of OCTN1 function with COPD in the Irish population.
v cigarette smoke extract (CSE). It was identified that ET is converted to hercynine (EH) and ergothioneine sulfonic acid (ESO3H). However, in vitro, only ESO3H was detected in a
concentration dependent manner. The remaining presence of ET suggests an alternative mechanism of action. ET was identified to undergo phase II metabolism by reacting with 1-chloro-2,4-dinitrobenzene (CDNB), to form dinitrophenyl-ergothioneine (DNP-ET). DNP-ET formation was identified to be catalysed by glutathione s-transferase (GST). However, there is some suggestion that alternative enzymes may play a role in this formation. The conjugate, DNP-ET was further identified to be effluxed from the cell by multi-drug resistant related protein (MRP) transporters. Hence, ET behaves in a similar way to glutathione (GSH) by carrying out its antioxidant properties.
vi
Contents
Summary ... iv
Chapter 1 ... 1
Introduction ... 1
1.1 Chronic Obstructive Pulmonary Disease ... 2
1.1.1How cigarette smoke leads to the development of COPD ... 3
1.1.2 Patient Symptoms of COPD ... 6
1.2 Drug Transporters ... 9
1.2.1 Organic Cation/Carnitine Transporters ... 10
1.2.2 Organic Cation Novel Transporter 1, OCTN1 ... 10
1.2.2.1 OCTN1 Tissue Distribution ... 11
1.2.2.2 OCTN1 Expression in the Human Lung ... 12
1.3 Ergothioneine ... 13
1.3.1 The Role of OCTN1 in vivo ... 15
1.4 Expression of OCTN1 in NCI-H441, primary cells and mouse lung tissue ... 21
1.5 Aims of the Thesis ... 23
Chapter 2 ... 24
The functional activity of OCTN1 in distal lung epithelial cells, NCI-H441 ... 24
Abstract ... 25
2.1 Introduction ... 26
2.2 Materials and Methods ... 29
2.2.1 Cell culture ... 29
2.2.2 Sequencing of OCTN1 in the cell line NCI-H441 ... 31
2.2.3 Quantification of ET intracellularly by LC-MS/MS ... 33
2.2.4 Uptake studies ... 36
2.2.5 Kinetic analysis for uptake studies ... 36
2.2.6 Transport studies ... 37
2.2.7 Cytotoxicity of CSE and ET ... 38
2.2.8 Contribution of CSE and ET towards oxidative stress response ... 39
2.2.9 Contribution of CSE and ET towards intracellular pH ... 39
2.2.10 Assessment of cell motility in response to ET and CSE ... 40
2.2.11 Statistical analysis ... 40
2.3 Results ... 41
2.3.1 Sequencing of SLC22A4 in NCI-H441 ... 41
2.3.2 Analysis of the functional activity of OCTN1 ... 42
2.3.2.1 Uptake of ET into NCI-H441 cells ... 42
vii
2.4 Discussion ... 53
2.5 Conclusions ... 61
Chapter 3 ... 62
Characterisation of OCTN1 in patients with COPD ... 62
Abstract ... 63
3.1 Introduction ... 64
3.2. Materials and Methods ... 69
3.2.1 Quantification of SLC22A4 expression ... 69
3.2.2 Data Analysis ... 71
3.3. Results ... 72
3.3.1. RNA Purity ... 72
3.3.2. Patient characteristics... 73
3.3.3 Gene Expression of SLC22A4 in healthy and COPD patients. ... 74
3.4 Discussion ... 81
3.4 Conclusion ... 85
Chapter 4 ... 86
The Mechanism of Xenobiotic Detoxification by ET in vitro. ... 86
Abstract ... 87
4.1 Introduction ... 88
4.2Materials and Methods ... 92
4.2.1 General procedures ... 92
4.2.2.Instrumentation ... 92
4.2.3 Chemical Synthesis ... 93
4.2.4 Quantification of ESO3H, EH, ET and DNP-ET. ... 96
4.2.5 Cell Culture ... 96
4.2.6 Quantification of oxidised ET products in vitro ... 98
4.3.7 Quantification of DNP-ET in vitro ... 98
4.2.8 Cytotoxicity of DNP-ET adduct in the presence/absence of GST inhibitor and MRP inhibitor ... 99
4.2.9 Formation of DNP-ET in the presence/absence of GST inhibitors and MRP inhibitor . 99 4.3 Results ... 100
4.3.1 Synthesis of ESO3H, EH and DNP-ET ... 100
4.3.2 Quantification of ESO3H and EH by LC-MS/MS ... 106
4.3.3 Oxidation states of ET in vitro. ... 108
4.3.4 Formation of DNP-ET in vitro ... 109
4.4 Discussion ... 114
viii
Chapter 5 ... 119
RT-PCR analysis of transporters in NCI-H441 cell line and freshly isolated human alveolar epithelial cells in primary culture ... 119
Abstract ... 120
5.1 Introduction ... 121
5.2 Materials and Methods ... 124
5.2.1 Cell culture ... 124
5.2.2 Quantitative RT-PCR analysis of transporters expressed in NCI-H441 and hAEpCs. 126 5.3 Results ... 129
5.3.1 RNA purity... 129
5.3.1 RT-PCR analysis of ABC, SLC, SLCO transporters and AQP Channels ... 129
5.4 Discussion ... 137
5.5 Conclusions ... 158
Chapter 6 ... 160
General Conclusions ... 160
Appendices ... 166
I Acknowledgements ... 167
II List of Abbreviations ... 169
1
Chapter 1
Introduction
Parts of this chapter have been published in:
S Nickel, CG Clerkin, MA Selo, C Ehrhardt, Transport mechanisms at the pulmonary
2
1.1 Chronic Obstructive Pulmonary Disease
Chronic Obstructive Pulmonary Disease (COPD) affects 329 million people worldwide (8). Each year, 2.5 million people die from this disease, a similar mortality to HIV/AIDs (8, 9). In Ireland, 440,000 people suffer from COPD, with over 180,000 patients having moderate to severe form of the disease (10). With the Irish death rate over twice the EU average and the highest in West Europe (11), it is evident that a need for new treatments and methods of prevention are required for COPD.
Misdiagnosis of COPD is a common occurrence in patients. In reality, patients diagnosed often have simple deconditioning less common lung conditions. Similarly, many patients are not diagnosed until the disorder is advanced and interventions become less effective. Regardless, COPD sufferers usually present with an ongoing cough that produces a lot of mucus, shortness of breath, wheezing or whistling when breathing and chest tightness. Based on these signs and symptoms, diagnosis depends on pulmonary function tests (PFTs), which measure the total volume of air inhaled and exhaled out of the lung, typically spirometry, a chest x-ray may also be requested to provide information on any constriction of the airways and finally, arterial blood gas tests may also reveal if oxygen therapy is required to counteract the acidic nature of high concentrations of carbon dioxide. Patients are also asked to provide information on their lifestyle.
3 cancer more frequently than cardiovascular diseases such as ischaemic heart disease or ischaemic haemorrage stroke (13).
1.1.1
How cigarette smoke leads to the development of COPD
COPD is a progressive obstructive lung disorder symptomised by chronic airflow limitation and an inability to breathe out fully (14). However, cigarette smoke remaining the major aetiological factor for its development and progression. Irritants like smoke activate lung epithelial cells to release chemotactic factors. However, the exact mechanism still requires further evaluation.
Cigarette smoke contains a complex mixture of variable components that orchestrate chronic lung inflammation and destructive lung remodelling. One major component of cigarette smoke is free radicals with an estimation of 1015 free radicals per puff (15). A radical can be defined as a highly reactive atom or group of atoms with one unpaired electron. Radicals are detected during the burning of a cigarette, within the tar of a cigarette and the aqueous extract of a cigarette (16).
When a cigarette is ignited, the components are burned in excess oxygen known as combustion. The result is the formation of oxygen or carbon radicals that are highly reactive that they react with each other and so are short lived. Their estimated life time is fractions of a second and so, do not have sufficient time to reach the deep bifurcates of the lung (15). The principal radical found in the tar of cigarettes is the conjugated quinone (Q), semi-quinone (QH.) and hydroquinone (QH2) (16). These radicals stem from melanin, a by-product
of the oxidation of tyrosine to dihydroxyphenylalanine (DOPA). Q, QH. and QH2 exist in
4 concentrations in the lung (16), by reducing molecular oxygen (O2) to superoxide (∙O2-). This
will eventually lead to the production of hydrogen peroxide (H2O2) (Scheme1.2).
Scheme 1.1: Illustration of quinone, semi-quinone and hydroquinone in equilibrium balance with each other (20).
Scheme 1.2: The complete reduction of molecular oxygen. The production of reactive oxygen species by single electron additions (e-) facilitated by quinone (Q), and hydroquinone (QH2) and/or metals. This scheme is adapted from Bartz et al. (21).
Hydrogen peroxide can be further reduced to the hydroxyl radical in the presence of a transition metal such as iron (Fe) (Scheme 1.2). Through the reduction of H2O2, iron becomes
itself oxidised from Fe2+ to Fe3+, by process of the Fenton reaction. Interestingly, O2* and tar
can later reduce Fe3+ to Fe2+ (15), allowing it to become widely available for further reductions of H2O2 as in Scheme 1.3. Further, as high as 42 g of iron has been quantified per
5
Scheme 1.3: Oxidation and reduction of iron by hydrogen peroxide (H2O2) and superoxide
(O2
∙-) respectively (23).
Radicals found in the gaseous phase have longer lifetimes (10-1 sec) than those radicals (10-9 sec) previously discussed, with their lifetimes in parenthesis (24). Detection of these radicals at high concentrations was carried out by electron spin resonance spin trap (ESPR) (25). It can therefore be concluded that gaseous radicals are constantly formed and destroyed. The radicals produced by the gaseous phase are small oxygen and carbon centred with higher reactivity than others. In each cigarette, there are high levels of nitric oxide (NO) detected, which react with molecular oxygen (O2) to form nitrogen dioxide (NO2) (Equation 1.1). NO2
is more potent to the lung epithelium that NO and is detected as high as 300 ppm in smoke compared to 1 ppm in smog (15). When reacted with isoprene, an alkyl free radical forms (Equation 1.2) that can later combine with O2 yielding a peroxyl radical as illustrated by
Equation 1.3. This peroxyl radical can now react with more NO to form the alkoxyl radical to further the production of NO2 (Equation 1.4),giving rise to a viscous chain cycle of oxidants.
6 antioxidants themselves, an imbalance between the levels of oxidants and anti-oxidant gene products results (26). This is known as oxidative stress.
NO + ½ O2 NO2
NO2 + (R.)
R. + O2 ROO.
ROO. + NO RO. + NO2
Another key feature of COPD is emphysema, the damage and enlargement of the air sacs causing breathlessness. Emphysema can be explained by the inhibition of an Alpha 1-antitrypsin Protease Inhibitor (A1PI) (15, 16). A1PI is a serum anti-protease that controls 90% of the anti-elastase activity (16). By inhibition of this enzyme, an unchecked activity of neutrophil elastase results, causing emphysematous lesions and eventual loss of activity (15). However, this is not as a result of a direct inhibition of the enzyme but the result of the formation of an inactive form, containing an oxidised methionine residue (16). Inhibition can be protected by the enzyme catalase, however, superoxide dismutase (SOD) and hydroxyl radical scavengers are too reactive to reduce the methionine residue and are deemed unsuitable (16). Inactivation of A1PI can occur by oxidants stimulated by phagocytes and smoke. Peroxynitrite/peroxynitrate formation as illustrated in Equation 1.4 can cause fast inactivation of A1PI that lasts only a few seconds. However, protection of A1PI by catalase, results in a slower inactivation, thereby prolonging the duration of A1PI activation and thus preventing damage to the air sacs (15)
1.1.2 Patient Symptoms of COPD
COPD may affect those who have never smoked, however, cigarette smoke is the major risk factor, featuring in 85% of patients (27). Research has shown that smoking cessation is the
7 most important preventive step for COPD with an improvement in lung function in mild-moderate COPD sufferers (28). However, despite great preventive efforts for smoking cessation, the prevalence and mortality of COPD continues to rise.
Once cigarette smoke triggers the release of chemotactic factors from the lung epithelium, an inflammatory immune response leading to elastin degradation, emphysema, mucus hypersecretion and small airway fibrosis, results (29, 30). Consequently, these physiological changes cause air to become trapped within the alveoli and/or physically restrict air from being inhaled or exhaled, instigating great difficulty in breathing (Figure 1.1).
Although cigarette smoke is the major risk factor for the development of COPD, only a small minority of people develop clinically relevant diseases. Therefore, genetic differences are most likely explanations for an increased susceptibility in patients to COPD.
8
[image:16.595.94.451.65.559.2]9
1.2 Drug Transporters
Drug transporters belong to two main transporter families: the solute carriers (SLC) and the ATP binding cassette (ABC). These transporters can either facilitate transmembrane translocation or further enhance barrier function by extruding their relevant substrates (35). Biological membrane barriers that obstruct the accessibility for drugs to intracellular targets, deeper tissue layers or into the pulmonary systemic circulation, nevertheless, were rarely considered in pulmonary drug delivery.
ABC transporters are a superfamily of membrane proteins that can transport a wide variety of substrates across biological membranes in an energy-dependent manner. The ABC genes in the human genome are divided into eight subfamilies based on amino acid sequence similarities and phylogeny, which have been characterised by genome sequencing (36). Many of these transporters act as drug efflux pumps and so the expression of ABC transporters in the lung suggests that they are pivotal in the protection against endogenous or exogenous toxic compounds. ABC transporters such as P-glycoprotein (P-gp), multidrug resistance-related protein 1-8 (MRP1-8), and breast cancer resistance protein (BCRP) are highly expressed in lung tissue.
10 mention a few, while the physiological function of many of these proteins to date still remains obscure (37-39).
1.2.1 Organic Cation/Carnitine Transporters
Organic cation transporters (OCT1-3) and the novel organic cation transporters (OCTN1, 2) belong to the SLC22 gene-family of organic cation/anion/zwitterion solute carriers, which comprise more than 20 members (37-39). OCT/Ns mediated, bi-directional transport is either membrane potential sensitive (OCT) or pH-dependent (OCTN). Physiological substrates of OCT/N include acetylcholine (ACh) - the most potent physiological broncho-constrictor, nutrients, hormones like prostaglandin E2 (PGE2), neurotransmitters (e.g. dopamine),
antioxidants such as L-ergothioneine (ET) and a number of molecules e.g. [14 C]-tetraethylammonium (TEA) (37, 39, 40). The OCT/N transporters have been detected in a great variety of tissues such as in liver, intestine, kidney, brain, blood-brain barrier, heart and also in the lung (38, 40). In the airway, one physiological role of OCTs is non-neuronal ACh transport, thus they play a possible role in asthma (41-44). A recent study also identified OCTN1 as an ACh transporter (45), but an involvement in airway ACh release still needs to be shown. Since a great variety of pulmonary administered drugs, e.g. β2-adrenergic agonists
or anti-muscarinics for the treatment of asthma and COPD are either cations or bases, the relevance of OCT/Ns for drug absorption in the lung have been hypothesised in the last decade.
1.2.2 Organic Cation Novel Transporter 1, OCTN1
11 TEA (49). In addition, cells lacking OCTN1, by blockage or inactivation with inhibitors like cimetidine, procainamide, pyrilamine, quinidine, quinine, verapamil, or alternatively by knock down OCTN1 (OCTN1-/-), did not accumulate ET to high levels demonstrating a specific role of OCTN1 in the uptake of ET (49-51).
OCTN1 is a product of the gene SLC22A4 (solute carrier family 22, member 4) and is found on chromosome 5q31. Interestingly this gene is found in close proximity to functioning genes of the inflammatory response. Further, it is abundantly expressed in macrophages and monocytes (46-48, 52) and so correlates with data collected about ET and its antioxidant role in human respiratory epithelial cells exposed to oxidative stress and hence inflammation.
1.2.2.1 OCTN1 Tissue Distribution
12 kidney tissue, with moderate expression in skin, intestine and lung and lowest expression in testis, brain and thymus tissues (53). In all three species, OCTN1 was in highest abundance in the kidney (55) with localisation of the protein to the cortex-medulla junction of rats, where efflux occurs (56). Tamai et al. further identified the uptake of TEA from renal epithelial suggesting OCTN1 to behave as an antiport system. Both Tamai and Yabuuchi determined OCTN1 to be localised to the apical membrane of human kidney tissue (46, 57).
1.2.2.2 OCTN1 Expression in the Human Lung
OCTN1 has been detected in rat, mouse and human lung tissue with moderate expression (48, 54, 58). A number of reports also detail the presence of mRNA in normal human nasal epithelia and polyps (59). In human airway epithelia of human trachea and parenchyma, mRNA and protein were detected by qRT-PCR and immunofluorescence (IF), respectively (60). By IF, OCTN1 protein was predominantly localised to the apical portion of epithelial cells of human trachea with lower levels detectable in the alveolar epithelia (60). Slitt et al.
found the tissue distribution of Octn1 by qRT-PCR in rats to be similar to that of humans (53). Moderate expression was detected in the lungs with localisation of the protein occuring to the apical membranes (46, 57). Similarly, OCTN1 was found in mice but with lower mRNA expression compared to human and rat tissue (54, 58).
13
1.3 Ergothioneine
A method to control oxidative stress is through homeostasis, a complex process in which a physiological redox balance is maintained. Cells are equipped with various antioxidants, like SOD, catalase, glutathione peroxidase (GPx), glutathione (GSH), to help eliminate excess
reactive oxygen species (ROS) and consequently their effects. Similarly, we can enrich our bodies with antioxidants through diets rich in vitamins and minerals, like fruit and vegetables, to help prevent the effects of cellular and tissue damage.
GSH is an important antioxidant in many species. However, during oxidative stress the thiol group present within glutathione becomes oxidised forming the thione (Figure 1.2a) and consequently, compromises the antioxidant potential of this amino acid. Zeng et al.
demonstrated that GSH levels were down regulated in the sputum and plasma of COPD patients (62), leading to an increased imbalance between oxidants and antioxidants in the airway. Similar data was established for superoxide dismutase (SOD) and glutathione peroxidase (GPx)in the same study (62).
14 The exact mechanism of action of ET remains nebulous. However, ET has been shown to provide protection against p38 MAPK and Akt activation through inhibition of phosphorylation, which is critical for the activation of NF-κB, a transcription factor for pro-inflammatory cytokine release from epithelial cells (66). Pretreatment of A549 cells demonstrated the complete inhibition of interleukin-8 (IL-8) release and its transcriptional activation mediated through NF-κB (64). Similarly, inhibition of tumour necrosis factor-alpha (TNF-α) release from macrophages has been detected upon treatment with ET (67) and finally, ET treatment demonstrated an anti-inflammatory role in interleukin 1 beta (IL-1β) and interferon insufflated rats (68).
Therefore, ET treatment could be effective in the progression of COPD (67)
Figure 1.2a: Reduced and oxidised forms of glutathione (6).
15
1.3.1 The Role of OCTN1
in vivo
As a result of the toxic presence of oxidants, the immune system is stimulated to release cytokines from cells (e.g. macrophages, dendritic cells, mast cells) (69). Activation of macrophages is the predominant secretor of these small proteins, even though the mechanistic pathway remains unclear (70, 71). Yang et al. previously determined that pro-inflammatory cytokines, i.e. TNF-α, IL-1β, interferon-gamma (IFN-γ), increased both intra and extracellular ROS production in a time/concentration manner, initiating a vicious chain cycle. It has been established, that release of cytokines is prevented or completely inhibited when mice are administered ET. One such cytokine, TNF-α is a potent pro-inflammatory mediator, which is tightly linked to the persistence of inflammation, characteristic of COPD (72). IL-1β, a mediator for inflammation and apoptosis, was also found to be released at significantly lower concentration when incubated with ET (67).
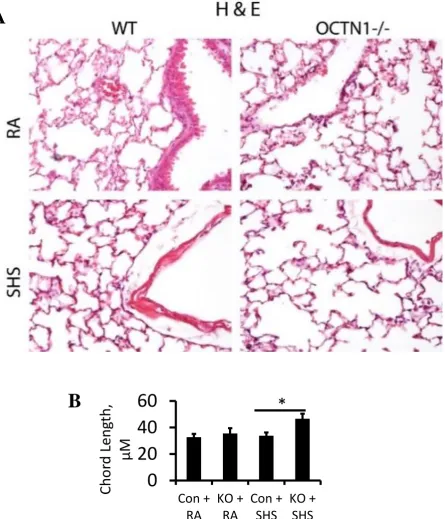
A recent collaboration with Brigham Young University (Provo, UT), has allowed for the further investigation of the protective role of Octn1 in whole mouse lung. Their initial studies investigated the effect of second hand smoke (SHS) on the lung structure of wildtype and
16
0
20
40
60
Con +
RA
KO +
RA
Con +
SHS
KO +
SHS
Chor
d
Leng
th,
µM
*
Figure 1.3: Histology of wildtype (WT) and silenced Octn1 (Octn1-/-) mouse lung exposed to room air (RA) and second-hand smoke (SHS). A,B) Illustrates a qualitative and quantitative simplification of lung tissue in Ocnt1-/-mice when exposed to SHS, respectively. Graphs represent mean ± SD (n=3).
B
)
A
[image:24.595.79.525.57.577.2]17
B
)
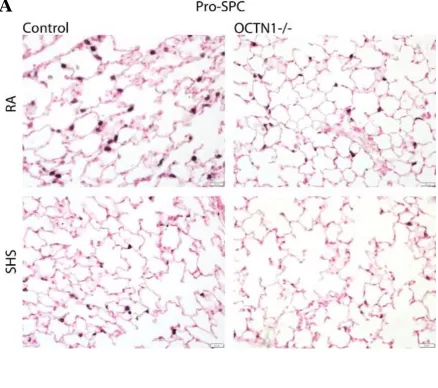
Figure 1.4: Histology of wildtype (WT) and silenced Octn1 (Ocnt1-/-) mouse lung exposed to room air (RA) and second-hand smoke (SHS). A,B) Identifies a depletion of AT-II cells in knockout Octn1 mice exposed to SHS by staining for Pro-SPC, a protein secreted by AT-II cells. Graphs represent mean ± SD (n=3), P<0.05.
[image:25.595.72.511.69.457.2]18 Alveolar type II (ATII) and alveolar type I (ATI) cells cover 5% and 95%, respectively, of the alveolar epithelium, cellular damage was studied by staining for ATII cells with Pro-SP-C. Their research identified a significant decline in the level of actin present in the lung tissue and as a result when calculating pro-SPC/Actin ratio an increase is observed (Figure 1.4). This is representative to a decline in the number of ATII cells, in the presence of SHS,when the transporter was silenced. Hence, there is a strong suggestion that OCTN1 plays a protective role against cigarette smoke exposure.
Further investigation was carried out to identify the degree of protection by OCTN1 during cell damage. Total cell counts were performed in broncho-alveolar lavage fluid (BALF), as a marker for inflammation. As predicted, a significant increase in cell number occurred when mice (both wildtype and knockout) were exposed to SHS. This rise in number was further enhanced when Octn1 was silenced. This study further investigated the release of pro-inflammatory leukocytes, specifically, polymorphonuclear (PMN) cells, to which a similar
Figure 1.5: Octn1 protects against inflammation. A) Increase in total cell count occurs in Octn1 knockout mice exposed to SHS. B) Increase in polymorphonuclear leukocytes was seen in Octn1 silenced mice exposed to SHS. Graphs represent means ± SD (n =3), P<0.05.
A
)
19
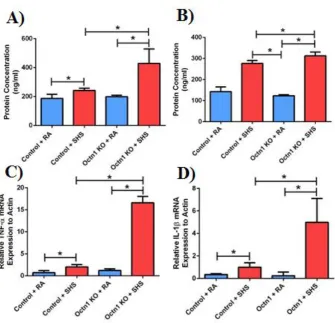
Figure 1.6: Octn1 protects against the release and expression of pro-inflammatory mediators. A) Increase in TNFα release occurs in OCTN1 silenced mice exposed to SHS.
B) Increase in IL-1β occurs in OCTN1 silenced mice exposed to SHS. C, D) Increase in TNFα and IL-1β also occurred, respectively, in the total cell matrix. Graphs represent means ± SD (n = 3), P<0.05.
trend occurred. A strikingly significant increase in the number of PMNs occurred in mice exposed to SHS when Octn1 is depleted. These data are illustrated in Figure 1.5.
[image:27.595.118.454.166.489.2]21
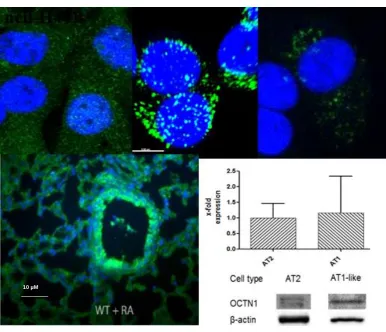
Figure 1.7: Immunolabelling of OCTN1 in NCI-H441, human alveolar epithelial cells (hAEpC) AT-II and hAEpC ATI-like differentiated cells. Monolayers were grown on Transwell filters. B) Immunolabelling of Octn1 in whole mouse lung. Staining for OCTN1 (green) is shown by confocal laser scanning microscopy. Nuclei were counterstained with DAPI. Bar 500 μm. C) Gene expression of OCTN1 by qRT-PCR in AT-II and ATI-like differentiated human alveolar epithelial cells.
1.4 Expression of OCTN1 in NCI-H441, primary cells and mouse
lung tissue
Together with colleagues from Brigham Young University, our research group has also successfully identified the presence of OCTN1 by Confocal Laser Scanning Microscopy (CLSM) in cell types: NCI-H441, AT-II and ATI-like primary cells, and lung tissue specimens from wildtype mice exposed to room air (RA) as shown in Figure 1.7. This was similar to findings previously established by Salomon et al. (73).
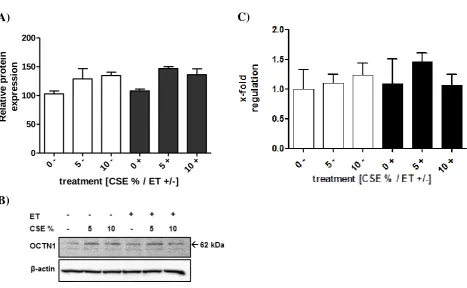
[image:29.595.91.478.277.609.2]22 Finally, expression of OCTN1 has more recently been quantified by our research group in the presence and/or absence of CSE and ET. Upon incubation with CSE a slight increase in the expression of the transporter, both at gene and protein level is observed (Figure 1.8). No such change is seen when cells are exposed to ET.
Figure 1.8: A,B) Western blot analysis of OCTN1 in NCI-H441 cells exposed to various conditions of CSE and ET C) Relative gene expression profile of OCTN1 in NCI-H441 cells exposed to various conditions of CSE and ET. Graph represents means ± SEM (n = 3).
A)
B)
C)
0 - 5 - 10 - 0 + 5 + 10 +
0 50 100 150 200
R
e
la
ti
v
e
p
ro
te
in
e
x
p
re
s
s
io
n
23
1.5 Aims of the Thesis
To date, OCTN1 has been identified as a key player in the protection of lung tissue SHS in vivo. However, a need for greater understanding of the functional role of the transporter OCTN1 and the molecular mechanism of its specific substrate ET is required. Elucidating the activity of OCTN1 and ET will be discussed in this thesis and may be the basis for a novel therapy of COPD.
The aims of this research will be to:
1. To investigate the functional activity of OCTN1 in the cell line NCI-H441. SNPs associated with the transporter in the cell line NCI-H441 will be highlighted. Uptake and transport studies of OCTN1 in NCI-H441 cells and hAEpCs will be performed to determine the localisation of OCTN1 in bronchiolar epithelium. Further, confirm the protective role of OCTN1 against oxidative stress in the cell.
2. To characterise the expression of the gene SLC22A4 responsible for the coding of OCTN1 in the bronchiolar epithelium of patients with COPD by RT-PCR.
3. To elucidate the mechanism of xenobiotic detoxification by action of ET under oxidative stress, ET, and its oxidative products will be studied when exposed to CSE. Further, it will be imperative to investigate whether ET can participate in phase II metabolism similar to GSH. Therefore, ET and CDNB reactions will be investigated
in vitro and whether GST and MRPs play a role in its formation and efflux, respectively.
24
Chapter 2
25
Abstract
26
2.1 Introduction
In tissues, the organic cation transporter, OCTN1 has been identified to be responsible for cellular transport of L-ergothioneine (ET) (47), and has been found to share protective properties against the toxic effects of second hand smoke (SHS). Despite the considerable amount of work done on this transporter, the real physiological function of OCTN1, as well as its conceivable role in human disease remains unclear. This could be due to the lack of data collected based on its expression under certain conditions of oxidative stress and/or, reliable methods for the measurement of its specific substrate in biological specimens.
An association between single nucleotide polymorphisms (SNP) of the gene SLC22A4, is reported to result in an increase susceptibility to chronic inflammation (74). One example of such a SNP is rs1050152, encoding the Leu503Phe variant (c1672C>T), which is responsible for altered substrate specificity, specifically ET (75, 76). Other mutations include Gly462Glu (1385C>G), resulting in the complete loss of transport of the ammonium cation tetraethylammonium (TEA) and an example of a synonymous substitution being Thr306Ile (917C>T), yielding no difference in functionality (77). Studying SNPs of the transporter will reveal mutations in the gene that may result in an increase susceptibility of developing COPD.
Past methods of quantifying ET have included coupling ET to a fluorophore, which is then detected by UV (78, 79) but this lacks the sensitivity required for accurately quantifying ET in cells. In recent years, the sensitivity and accuracy has improved with the development of hydrophilic interaction liquid chromatography tandem mass LC-MS/MS proposed by Wang
27 H441 cells by water deproteinisation treatment followed by fast high-performance liquid chromatography separation and mass tandem detection. Through its quantification the uptake and transport capabilities of OCTN1 in vitro will be determined to help determine the functional role of the transporter.
Research previously carried out by our lab investigated the expression of OCTN1 by Western blot under air interface culture (AIC) conditions and liquid covered culture (LCC) conditions of NCI-H441 cells as shown in Figure 2.1. Although statistically, no significant difference was detectable, there was evidence for a slight increase in expression of the transporter when incubated under AIC conditions. This is the first investigation to determine the expression of OCTN1 under culture conditions and could further support the hypothesis that OCTN1 plays a crucial role in the uptake of ET into epithelial cells.
ET is an unusual naturally occurring histidine derived amino thiol (81), which is exclusively synthesised by fungi and bacteria and is widely distributed in both plants and animals (82). Different physiological functions have been suggested for ET including the role as an antioxidant (79). ET is highly water soluble and appears to prevent carbonylation of water soluble proteins resembling the actions of glutathione (GSH) (83). However, ET
Figure 2.1: Western blot analysis of OCTN1 in NCI-H441 cells cultured under AIC (A) and LCC (B) conditions. OCTN1 protein expression is determined to be slightly higher under AIC conditions compared to LCC conditions. Graphs represent means ± SEM, (n =
3).
β-actin OCTN1
MRP1
Passage number 59 71 89 59 71 89
Growth conditions AIC LCC
β-actin OCTN1
MRP1
Passage number 59 71 89 59 71 89
29
2.2 Materials and Methods
2.2.1 Cell culture
Cell Maintenance of immortalised cell line
Human bronchiolar epithelium NCI-H441 (American Type Culture Collection, HTB-174, Teddington UK) were cultured at 37°C in 5% CO2 atmosphere in Gibco RPMI-1640 medium
(Biosciences, Dun Laoghaire, Ireland) supplemented with 5% foetal bovine serum (FBS), 1% sodium pyruvate, 1% penicillin streptomycin (all from Sigma Aldrich). Passages 55-85 were used for these studies. NCI-H441 cells were routinely cultured in 75 cm2 growth area tissue culture flasks (Greiner BioOne, Frickenhausen, Germany) and passaged when approximately 80% confluency. NCI-H441 cells were seeded at a density of 75,000 cells/cm2 on well plates (Greiner). Twenty-four hours prior to experimentation cells were serum starved to reduce proliferation. On the day of the experiment, cells were washed twice with warm, Krebs-Ringer Buffer (KRB) composed of 15 mM HEPES, 116.4 mM NaCl, 5.4 mM KCl, 0.78 mM NaH2PO4, 25 mM NaHCO3, 1.8 mM CaCl2, 0.81 mM MgSO4 and 5.55 mM glucose, pH 7.4.
Cell Maintenance of primary epithelial cells
Human alveolar type II epithelial (ATII) cells were obtained from the Helmholtz Institute for Pharmaceutical Research, Saarland University (Saarbrücken, Germany). They were isolated from non-tumour lung tissue obtained from patients undergoing lung surgery according to a protocol modified from Demling et al. (85). The use of human material was approved by Saarland State Medical Board (Saarbrücken, Germany).
Purified ATII cells were either used directly for protein and RNA isolation or cultured at a density of 200,000 cells/cm2 in a humidified atmosphere at 37°C and 5% CO2 using small
30 overnight with 25 µg/cm2 rat-tail collagen type I (Sigma-Aldrich) and 5µg/cm2 fibronectin (BD Bioscicences, Oxford, U.K.).
The cells were kept in culture for at least 7 days to transdifferentiation into an alveolar type I-like (ATI-I-like) phenotype.
Transduction of NCI-H441 cells with OCTN1 shRNA lentiviral particles.
This was carried out by Dr. Sabrina Nickel
31 sodium pyruvate, 1% penicillin-streptomycin, 2 µg/ml puromycin HCl). The selection medium was replaced every two to three days until resistant colonies could be observed. Colonies were picked and expanded in selection medium for another 3 weeks to ensure complete removal of non-transfected cells.
Cigarette smoke extract
Two Kentucky 2RF4 reference research cigarettes were ignited and the gaseous component bubbled through 20 ml of medium to yield 100% cigarette smoke extract (CSE) for 1.5 min. Two filters from unused Kentucky reference research cigarettes were bubbled through 20 ml medium to act as a control. All medium was sterilised by filtration before use.
2.2.2 Sequencing of OCTN1 in the cell line NCI-H441
DNA isolation from NCI-H441 cells
Genomic DNA was isolated from the immortalised cell line using Blood and Cell Culture DNA mini kit (Qiagen). Isolation occurred following the products specifications.
Quantification of DNA
32 which should be approximately 2-2.2. These ratios serve as a rule of thumb for purity assessment. All samples were diluted to 1 μl/10 μl with nuclease free water.
SLC22A4 primer selection
BLAST, NCBI allowed the determination of the exonic fragments within SLC22A4 genome and allowed for the prediction of the amino acid sequence as displayed in Figure 2.2. Based on this primers were designed for the SLC22A4 exonic fragments. The USCS genome browser was used to view the exons before selecting the primers. Once the selected region was found the sequence was submitted into the online program; primer3 plus. After submission primer3 plus returned a list of appropriate primer pair options to choose from. Suitable primers were chosen based on the different characteristics of the sequence; primer length, GC content, GC clamp, annealing temperature, target region. The chosen primer was then inserted into the online oligoDT calculator to test possible sequence hairpin loops or primer dimer formation. Primer Blast on NCBI was then used to determine if the primer target sequence is found in many genes to ensure amplification of only the targeted sequence. Selected primers were named accordingly and ordered.
PCR and sequence analysis
Exonic fragments of the gene SLC22A4, which codes for OCTN1 were generated using the primer sequences shown in Table 2.1. Amplification was performed using 12.5 µl Taqman Master Mix (Qiagen), 1.25 μl of forward and reverse primer for the specific exon (Sigma) and finally a concentration of 50 ng/μl of DNA, made up to 25 μl with nuclease free water. PCR conditions were pre-denaturation at 95°C for 5 min, followed by 35 cycles of denaturation at 95°C for 1 min, annealing for 1 min and extension at 72°C for 1 min and then a final extension at 72°C for 10 min. Annealing temperatures for the individual exons are summarised in Table 2.1.
33
Table 2.1: Primer sequence and PCR conditions used for the analysis of SLC22A4 gene encoding OCTN1 and obtained from NCBI. Reference sequence is NT_003334772.5
Purification of PCR products
Purification was performed using the Qiaquick gel extraction kit (Qiagen) following the manufacturers specifications.
Sequencing of SLC22A4 exons
The PCR products were sequenced by Eurofins Genomics (Ebersberg, Germany) in a 5’3’ direction.
2.2.3 Quantification of ET intracellularly by LC-MS/MS
Apparatus and chromatographic conditions
Chromatographic separation consisted of an Accela high pressure liquid chromatography (HPLC) system equipped with a LTQ Orbitrap Discover Mass Spectrometer detector. Sample separation was performed at a fixed flow rate of 940 µl/min with the eluent delivered gradiently with a column temperature of 25°C. Separation was investigated on a Waters T3 HSSC18 (150 mm x 2.1 mm, 1.8 µm) and a Kinetix HSSC18 (100 mm x 4.6 mm, 2.6 μm) with a mobile phase of A) water (Sigma Aldrich, Dublin, Ireland) and 0.1% formic acid
Exon Amplified
Forward primer (5’ to 3’) Reverse primer (3’ to 5’) Amplified Region Annealing
Temperature
Fragment Weight
(bp)
34 (Sigma Aldrich) and B) acetonitrile (Sigma Aldrich) and 0.1% formic acid or A) water and 0.1% acetic acid (Sigma Aldrich) and B) acetonitrile and 0.1% acetic acid, where all solvents were of HPLC grade. Samples were held in the auto sampler and the amount injected was 12 µl. Column eluents were detected by Tandem Mass Spectrometry (MS/MS) at a retention time of around 2.67 min.
35 Equation 2.1 Equation 2.2 Equation 2.3
Calibration curve
For LC-MS/MS analysis, calibration standards of ET were prepared by serial dilution of the stock solution (50 mM) with high purity water. This was prepared and analysed for each experiment.
Method validation
The validation of the current method was tested according to the Bioanalytical Method Guidelines of the US Food and Drug Administration and the International Conference of Harmonisation (ICH) (86, 87). Linearity, precision and accuracy, sensitivity and selectivity, and stability were determined according to these guidelines. Calibration curves determined linearity by demonstrating an increase in concentration with a corresponding increase in peak area. The limit of detection (LOD) was determined by investigating the lowest concentration of ET registered by the LC-MS/MS and distinguished from zero concentrations by ensuring the signal to noise ratio is 3:1 as identified by the ICH. The limit of quantification (LOQ) was determined by quantifying results that had a large degree of confidence and were registering a signal to noise ratio of 10:1 to that of a blank solution as highlighted by the ICH. The LOD and LOQ were 3 nM and 5 nM, respectively. Curves were constructed daily within the concentration range of 5 nM to 100 µM. Precision and accuracy were calculated intra- and interdaily with a variety of concentrations (Equation 2.1 and 2.2, respectively) (80). Finally, matrix effect (Equation 2.3) (80) and stability of ET was tested under a range of conditions, i.e. -20°C, 2-8°C, 21°C and 95°C.
% Precision = % Accuracy =
36
2.2.4 Uptake studies
The validated LC-MS/MS method was applied to an in vitro study of ET in distal lung epithelial cells, NCI-H441.
Uptake studies were carried out using NCI-H441 monolayers seeded on 6-well plates.
Uptake of ET was investigated at different concentrations, temperatures and pH values. Time dependency of ET was also measured by incubating the cells with various concentrations of ET and measuring the uptake at different time points (0-60 min). Concentration dependence was studied from 0-50 µM ET at 37°C and 4°C for 0-30 min. Uptake experiments were also performed in buffers of varying pH values (i.e. 5.6-8.4).
To initiate uptake of ET by OCTN1, cells were incubated with a range of ET concentrations. For concentration dependency of organic cation uptake into cell monolayers, cells were incubated with ET (0-50 μM) for 30 min to identify maximal uptake of ET. For time course analysis, cells were incubated with 50 μM ET for 0-7 days at various intervals.
Uptake experiments were stopped by washing the cell monolayer three times with ice-cold buffer. Cells were detached from the plate using 0.5 ml of 100% trypsin. The resulting solution was centrifuged at 12,000xg for 10 min before adding 1 ml of water to lyse the cells. The solution was briefly sonicated and the resulting solution centrifuged at 17,000xg for 5 min. The supernatant was removed and filtered prior to analysis by LC-MS/MS.
2.2.5 Kinetic analysis for uptake studies
Michaelis Menten constant (Km) and maximum uptake rates (Vmax) of ET can be calculated
from the Michalis Menten Model where the uptake rate is plotted against substrate concentration ([S]). (Figure 2.2a). However, with this plot, Vmax is hard to estimate as the rate
37
A) B)
intercepts at Vmax and Vmax/Km where
and (S) was [ET]. This analysis was
performed by utilising the online software ic50.tk.
2.2.6 Transport studies
NCI-H441 and human alveolar primary epithelial cells were grown on Transwell Clear filters (12 mm diameter with 0.4 µm pore size, and 6.5 mm diameter with 0.4 µm pore size, respectively) for at least 8 days with medium supplemented with 10 μM dexamethasone and 1X concentration of Insulin Transferrin Selenium (ITS) (Transepithelial Electrical Resistance (TEER)>350 ohm×cm2) (88). Before transport of ET was initiated, cells were washed once with pre-warmed fresh KRB, before incubation with KRB for 1 h at 37°C. For the actual transport, the buffer was replaced with 0.51 ml donor solution (ET) in the apical chamber and 1.5 ml KRB in the basolateral chamber. This was to behave as a model for apical-to-basolateral (AB) transport studies. In comparison, 1.51 ml donor solution was placed in the basolateral chambers with 0.5 ml KRB in the apical chamber to study basolateral-to-apical (BA) transport. The initial donor concentrations were determined by sampling 10 μl of the
38 Equation 2.5 donor solution. The cells were kept at 37°C with 200 μl samples taken from the receiver compartment every 15 min. To keep sink conditions, an equal amount of fresh KRB was returned to the receiver compartments. TEER values were recorded before and after the experiment to access cell integrity.
The utilised equation to calculate the apparent permeability coefficient (Papp) is the following:
Papp=
/(A.C0)
Where ΔQ was the change in quantity of the compound over a designated period of time (Δt), A was the nominal surface area of the cell layers (1.13 cm2) and C0 was the initial
concentration of the drug in the donor fluid and used in this study
Bioelectric measurements
The time of the cellular layers reaching confluence was determined by measuring TEER as a function of days in culture. TEER was measured daily with an epithelial volt-ohm meter equipped with STX-2 electrodes (WPI, Berlin, Germany) and corrected for the background value contributed by the Transwell Clear insert and medium.
2.2.7 Cytotoxicity of CSE and ET
39 by (FT-Fn)100 where FT is the fluorescence of the treated wells and Fn the fluorescence of the
negative controls.
2.2.8 Contribution of CSE and ET towards oxidative stress response
The ROS assay was employed to investigate the production of ROS when incubating with ET. On the day of seeding cells were incubated with 250 µM ET. A day prior to experimentation, cells were serum starved and incubated with a range of CSE concentrations. NCI-H441 cells were incubated with 2, 7 dichlorofluorescein diacetate (H2DCFDA) for 30
min in the dark at 37°C. Negative controls are treated with 1% Triton X-100 for 20 min. After incubation, the plate is read using FLUOstar Optima spectrophotometer and Optima software at an excitation of 485 nm and an emission of 535 nm. H2DCFDA-AM is taken into
the cell, where it is deacetylated by cellular esterases to be later oxidised by the presence of ROS generating a highly fluorescent compound, DCF. The fluorescence detected is related to the level of ROS present within the cells and so ROS production is calculated by (FT-Fn)
where FT is the fluorescence of the treated wells and Fn the fluorescence of the negative
controls.
2.2.9 Contribution of CSE and ET towards intracellular pH
40 incubating cells with a 10 μM final concentration of nigericin and valinomycin in the respective pH buffer (i.e. 4.5, 5.5, 6.5 and 7.5). Fluorescence was then quantified by using FLUOstar Optima spectrophotometer and Optima software at an excitation of 509 nm and an emission of 533 nm.
2.2.10 Assessment of cell motility in response to ET and CSE
To assess the motility rates of NCI-H441 cells in response to ET, cells were seeded in a 12-well plate (Greiner) and grown to confluency. A day prior to experiment, the cells were serum starved and incubated with or without 5% CSE. The cells were then scratched with a 200 l pipette tip. The scratch was washed twice with KRB and replaced with fresh serum free medium supplemented with a range of ET concentrations or CSE as required. The wound areas were monitored and photographed by phase contrast microscopy and measured using Olympus Cell^A Image Acquisition Software.
2.2.11 Statistical analysis
41
2.3 Results
2.3.1 Sequencing of
SLC22A4
in NCI-H441
Sequence analysis of the 10 coding exons of SLC22A4 from the cell line NCI-H441 were identified by DNA sequencing and resulted in the identification of 3 genetic variatants. Variants on exon 1 and 10 were novel.
Location
dbSNP
(NCBI) SNP
Amino Acid
Change Detected in cell line
Exon 1 Novel 5672C>G L75V Yes
Exon 1 188G>A R63H No
Exon 1 225C>T R75R No
Exon 1 248G>C R83P No
Exon 2 400C>A L134M No
Exon 2 rs11568511 465C>T L155L No
Exon 3 475G>A V159M No
Exon 3 494A>G D165G No
Exon 615G>A M205I No
Exon 4 774G>C M258I No
Exon 4 819G>A L273L No
Exon 5 rs272893 917T>C I306T No
Exon 5 rs750523509 1083T>C F313L Yes
Exon 6 1031T>A M344L No
Exon 7 rs272879 1182C>G T394T No
Exon 8 rs12777 1413C>G G471G No
Exon 9 1445G>A G482A No
Exon 9 1460T>C M487T No
Exon 9 1499T>A I500A No
Exon 9 rs1050152 1507C>T L503F No
Exon 9 1531G>A G462E No
Exon 10 Novel 1232A>T F528T Yes
42
2.3.2 Analysis of the functional activity of OCTN1
2.3.2.1 Uptake of ET into NCI-H441 cells
The active component of OCTN1 was investigated by temperature dependency studies at 37°C and 4°C for 30 min (Figure 2.3). At 4°C, a negligible concentration of ET was quantified in the cell, in comparison to that measured at 37°C. The active component of OCTN1 was then analysed to reveal a Km and Vmax values of 10.30 ± 6.96 µM and 0.39 ± 0.1
µ0omol/mg protein, respectively.
To investigate time dependency studies, NCI-H441 cells were incubated with 50 µM ET for 0-30 min (Figure 2.4). A linear dependency occurred within 1 min of commencement of the experiment. Cells then appeared to be completely saturated after 5 min, i.e. 0.4 ± 0.03µM/mg protein.
43
Figure 2.4: OCTN1 is time dependent as illustrated with 50 µM ET in NCI-H441 cells at 37 ºC and pH of 7.4. Cells quickly accumulated ET within 1 min of incubation before reaching their maximum concentration at 5 min, indicated by the graph plateauing at this time point. Graph represent mean ± SEM, (n = 3).
0 10 20 30 40
0.0 0.1 0.2 0.3 0.4 0.5
Time (mins)
Co
n
c
e
n
tr
a
ti
o
n
u
p
ta
k
e
(
M
/m
g
o
f
p
ro
te
in
44 NCI-H441 cell silenced of OCTN1 were chosen to confirm the uptake of ET by OCTN1 and not another transporter or passive diffusion. As a result, the uptake of ET in OCTN1 knock-down cells, rendered a significant lower accumulation of the substrate (Figure 2.5). Kinetic analysis was performed by online software (ic50.tk). The uptake of ET into NCI-H441 was a saturable process, with the kinetic parameters estimated to be Km = 23.39 ± 5.26 µM and Vmax
= 0.59 ± 0.05 µM/mg protein when concentrations of 0-100 µM ET were investigated. Further, OCTN1 has been reported to be a dependent proton/organic cation antiporter at pH 7.6 (57). Therefore, ET uptake was studied at various pH values. When the pH in the transport medium became increasingly acidic (<5.9), OCTN1 mediated transport of ET decreased to about 25% of those at neutral pH. In comparison when the pH of the transport medium became increasingly more basic (pH > 7.7), the uptake of ET was around 50% of that at neutral pH (Figure 2.6).
45
2.3.2.2 Transport of ET by OCTN1
Resistance values
NCI-H441 monolayers could form polarised, electrically tight monolayers, reaching peak TEER values of 1056 ± 121 Ω×cm2
for NCI-H441. TEER was significantly lower when cultured at an air-liquid interface. For NCI-H441 cells there was a clear peak in monolayer resistance at day 4, but no such peak was obtained for the primary cells until day 8. Primary cells cultured under AIC generated electrically tight cell layers (Figure 2.7). This observation has been previously well documented (73).
Figure 2.6: OCTN1 is pH dependent as identified through the uptake of 50 µM ET at various pH, ranging from 5.6-8.3. Graph represent means ± SEM, (n= 6), **P<0.01, ***P<0.005, where statistical analysis is comparing all data to pH 7.4
5.6 5.9 6.2 6.8 7.1 7.4 7.7 8.0 8.3
46 The bidirectional transport of ET across NCI-H441 bronchiolar and ATI-like epithelial cell monolayers were grown under air-interfaced (AIC) and liquid covered conditions (LCC), 6 and 9 days after seeding, respectively for NCI-H441 and ATI-like cells. At a donor concentration of 50 µM, the Papp from apical-to-basolateral (AB) was 8.00 ± 1.00 ×10⁻⁶ and
3.73 ± 0.50 ×10⁻⁶ cm×s-1 for AIC and LCC, respectively in NCI-H441 cells. In comparison, the Papp for basolateral-to-apical (BA) transport was 10.0 ± 0.38 ×10⁻⁶ and 3.76 ± 0.96 ×10⁻⁶
cm×s-1 for AIC and LCC, respectively (Table 2.3). Across primary cell monolayers, at a donor concentration of 50 µM, the Papp in the AB direction was 0.71 ± 0.24 ×10⁻⁶ and 0.12±
0.14 ×10⁻⁶ cm×s-1 for AIC and LCC, respectively. In comparison, the Papp in the BA direction
was 0.58 ± 0.13×10⁻⁶ and 0.63 ± 0.89 ×10⁻⁶ cm.s-1 for AIC and LCC, respectively.
A) B)
Figure 2.7: Time course of TEER development in A) NCI-H441 and B) hAEpC
47
NC I-H44
1 A IC
NC I-H44
1 LC C
Pri ma
ry A IC
Prima ry L
CC 0.00 0.02 0.04 0.06 0.08 AB BA * * ** *
Cell type and culture condition
Co n c e n tr a ti o n u p ta k e n b y c e lls n M /m g o f p ro te in
Figure 2.8: Concentration of ET uptake by OCTN1 inNCI-H441 cells and primary human alveolar epithelial cells seeded on Transwell Clear inserts and grown under AIC (A) and LCC (B) conditions for at least 6-10 days. Cells were lysed after transport studies and the intracellular accumulation of ET was quantified in NCI-H441 and primary
alveolar epithelial cells. Graph shows that uptake of ET is preferential from an apical to basolateral direction in NCI-H441 cells cultured under AIC conditions and hAEpCS under both AIC and LCC conditions. Graphs represent means ± SEM, (n = 6), *P <0.05. After 90 min of ET transport, primary and NCI-H441 cells were lysed and their intracellular ET content determined by LC-MS/MS (Figure 2.8). The uptake of ET into NCI-H441 cells in a AB direction was 0.06 ± 0.01 µM/mg protein and 0.02 ± 0.00 µM/mg protein, for AIC and LCC, respectively. In comparison, the uptake of ET in a BA direction in hAEpCs was 0.05 ± 0.01 µM/mg protein and 0.02 ± 0.01 µM/mg protein, for AIC and LCC, respectively.
Papp (×10-6 cm×s-1)
AIC LCC
Cell type AB BA AB BA
NCI-H441 8.00 ± 1.00 10 ± 0.38 3.73 ± 0.50 3.76 ± 0.96
ATI-like cells 0.71 ± 0.24 0.58 ± 0.13 0.12 ± 0.14 0.63 ± 0.89
48 This study was also performed in primary alveolar epithelial cells, which yielded an uptake of 0.04 ± 0.01 µM/mg protein and 0.05 ± 0.00 µM/mg protein, for AIC and LCC, respectively. When the BA directional study was performed, an accumulation of 0.04 ± 0.01 µM/mg protein and 0.04 ± 0.00 µM/mg protein, for AIC and LCC, respectively, resulted. Regardless of cell type and cell conditions, a significantly higher uptake from to the apical side resulted (*P<0.05).
2.3.3 The Cytoprotective Properties of ET
Cell viability of NCI-H441 cells was investigated upon exposure to mM concentrations of ET. No change in cell viability occurred upon incubation, indicating that ET does not affect cell viability but remains unchanged (Figure 2.9).
NCI-H441 cells were also incubated with 250 µM ET from day of seeding and a range of CSE concentrations incubated 24 h prior to experimentation, respectively (Figure 2.10). Cell viability was investigated and as predicted, increasing CSE concentrations causes a decline in
Figure 2.9: Uptake of high mM concentrations of ET was determined to have no effect on cell viability of NCI-H441 cells. Graph represents means ± SEM, (n = 6).
0.010.02 5
0.05 0.
1 1 2 4 6 8 10
0 50 100 150 200
Concentration of ET mM
%
C
e
ll
V
ia
b
ili
49 0
1.0 2.5 5.0
0 50 100 150 Ctrl +ET * % CSE % C e ll V ia b ili ty * * *
cell viability, by up to 50%. Upon incubation with ET from day of seeding however, a significant increase in cell viability is observed (*P < 0.05).
Figure 2.11: ET (250 µM) is counteractive against the production of reactive oxygen species (ROS) in the presence of CSE. ROS production was assessed by utilising dichlorofluorescein diacetate (DCFDA).Results are expressed as means ± SEM, (n = 9), ***P<0.001.
Figure 2.10: Incubation of 250 μM ET improves cell viability when incubated with
various concentrations of CSE. Cell viability was assessed by Alamar Blue assay. Results are expressed as means ± SEM, (n = 9), *P<0.05
0 1 2 5 10
[image:57.595.172.410.139.319.2]50
0 5 10 15 20 25 30
6.0 6.5 7.0 7.5 8.0
Time (mins) of incubation with 250M ET
In tr a c e llu la r p H
The production of ROS was also monitored in the presence and absence of CSE and ET (Figure 2.11). In a similar way, CSE lead to the increased development of intracellular ROS by up to 50%. A significant decrease in the production of ROS occurs upon incubating with ET (***P < 0.001).
The intracellular change in pH was also monitored over time. Within 15 min of incubating with ET, intracellular pH plateaued (Figure 2.12).
Figure 2.12: ET (250 µM) incubated changes the intracellular pH of NCI-H441 cells over time (0-30 min) , determined by use of pHrodo green dye. Graphs represent means ± SEM, (n = 6).
Figure 2.13: Change in intracellular pH upon incubating with a range of ET concentrations for 30 min determined by using pHrodo green dye. Graphs represent means ± SEM, (n = 6).
0 1 2 4 5 7 10 15 20 25 30
6 7 8 9 10
Concentration of ET mM
51
C- C+ 5- 5+
0 50
100 ***
%
W
ou
n
d
C
lo
s
u
re
Upon incubating with a range of concentrations of ET, the pH gradually became basic at an ET concentration of 7 mM with higher concentrations of ET resulting in a decline of intracellular pH returning to a homoeostatic condition (Figure 2.13).
Further, the intracellular pH was also monitored in the presence of CSE with/without ET (Figure 2.14). Not surprisingly, the acidity of the cytosol increases with incubation of CSE. However, in the presence of ET, the acidic nature of CSE is counteracted by returning the pH to normal physiological conditions (*P<0.05)
Figure 2.14: Role of ET on the intracellular pH was investigated when cells were incubated with CSE (0-10%) to determine the antioxidant potential of 250 µM ET against CSE. These data identify that incubation with ET returns the intracellular pH to baseline when incubated with CSE. Results are expressed as means ± SEM, (n = 6), *P<0.01
53
2.4 Discussion
Sequencing of SLC22A4 in NCI-H441 cells
Literature has reported several single nucleotide polymorphisms that code for the incorrect translation of L503F (c1672t), G462E (g1531a) and T306I (c1063t), and are associated with inflammatory diseases such as Crohn’s Disease, Irritable Bowel Disease, Rheumatoid Arthritis, Ulcerative Colitis, Colorectal Cancer (47, 75-77, 89-92). However, only the mutation L503F has been detected in the cell line NCI-H441 to date and is illustrated by Figure 2.17 (7). DNA from the cell line, NCI-H441, was amplified with primers specific to the individual coding exonic fragments, which were purified and sent for sequencing. Two novel mutations were detected, which to date have not been reported. Future studies should examine the functional activity, if any, of these mutations.
Quantification of ET by LC-MS/MS for the characterisation of OCTN1
The transport activity of OCTN1 has previously been investigated in rat, mouse and human species. However, limited data is collected on the uptake of ET by OCTN1 as previous methods of the substrates’ detection and quantification was performed by fluorescence, and
54 UV. These methods lack sensitivity when detecting ET and prevent accurate quantification of ET. Radiolabelled ET is also available with increased sensitivity in its detection. However, due to its unstable nature radiolabelled ET is not suitable for quantification. Only recently, the utilisation of liquid chromatography tandem mass spectrometry (LC-MS/MS) has been implemented.
Our studies have identified the active functional activity of OCTN1 in NCI-H441 revealing a Km value of 10.30 ± 6.96 µM and a Vmax of. 0.39 ± 0.10 nmol/mg of protein. The Michaelis
constant for ET uptake by the active component of OCTN1 is not reported in the literature. Tamai et al. investigated mouse constructs of OCTN1 in HEK-293 cells, where they showed that uptake of TEA increased linearly for up to 10 min at which time the cells reached a point of saturation (54). When human OCTN1 (hOCTN1) was cloned in HEK-293 cells, uptake of TEA increased linearly for up to 5 min, after which a steady state was obtained (46). Our studies focused on the uptake of ET in the human distal lung cell line NCI-H441, where cells appeared to be fully saturated within 5 min of incubation with ET.
ET was quantified in NCI-H441 cells to reveal a high affinity of OCTN1 for ET (Km = 23.39
± 5.26 µM). These findings are similar with Gründemann et al. who previously quantified ET, in hOCTN1 overexpressing HEK-293 cells (Km: 21 µmol/l), and later determined
OCTN1 to have low affinity for compounds of related structure such as hercynine (EH, Km:
55 The extracellular pH is an important factor to explore when investigating COPD. Patients who present with the condition, typically suffer from restrictive inhalation of oxygen and an exhalation of carbon dioxide. As a result, levels of carbon dioxide increase in the alveoli, consequently causing the pH to become more acidic. Through investigation of OCTN1, when exposed to various pH, might reveal further insight into its activity in the lung during typical hypoxic conditions of COPD patients. Previously, rat cDNA was transfected in human pigmented retinal epithelial cells (HPRE) and the uptake of TEA investigated (56). It was determined that the uptake of the substrate was influenced by extracellular pH. As pH changed from 6.5-8.0, uptake of TEA increased. However, as pH became acidic a reduction in uptake resulted. Our studies are in parallel with findings of Tamai et al. and Maegawa et al.(54, 93), where an optimal uptake at pH 7.7.occured. A significant reduction greater than pH 8.0 occurred, which could be due to initiation of cell death. Therefore, it can be concluded that OCTN1 is pH dependent and at pH 7.7, OCTN1 reaches its optimal activity.
TEER development
56 values were calculated for AIC conditions compared to LCC in both cell types. Similar to previous findings where TEER values were determined to be 3 times lower in AIC than LCC in Calu-3 cultured cells (95).
Transport activity of OCTN1
To further explore the proposal of apical localisation of OCTN1, transport stu