ABSTRACT - This study considers a scenario where single supplier supplying a finished product to single buyer. In order to ensure safe transportation for the customer, finished product is packed in returnable transport items (RTIs). Empty RTIs are retreated to the supplier and used for the next delivery. We consider the return time of RTIs is stochastic in this paper as a result of some unexpected factors. We promote the problem of incorporating the flow of both the finished product and RTIs and formulating a non-linear programming model of the closed-loop supply chain expected total costs. Secondly, we analyze the results of this paper in which the behavior of the model is revealed. Additionally, we add fuzzy to this paper in order to acquire a more appropriate result under the uncertain environment.
Index Terms—returnable transport item, supply chain, uncertain environment, closed-loop, fuzzy
I. INTRODUCTION
G
overnmental regulations have prompted many industrial companies to attach great importance to sustainability issues and public consciousness of the social and environmental responsibility in recent years. The conception of closed-loop supply chains, which expressly take account of product returns and reusable packaging material is definitely in accord with sustainable development issues and thus conduce to initiatives that concentrate on the decrease of waste generation and resource consumption.In many industrial companies, so-called returnable transport items (RTIs), such as containers, pallets or crates, are widely used to make to greener production and logistics processes. A relative study of Goellner and Sparrow (2014) on the environmental influence of disposable containers and recycled thermally controlled shipping containers impressively showed that reusable containers lead to 75%
Manuscript received November 29, 2018; revised December 6, 2018. This work was supported in part by the Department of Transportation Science, National Taiwan Ocean University. Paper title is Fuzzy Closed-Loop Supply Chain Considered Container Return Time (paper number: ICINDE_22) L. A. Chen Author is with the Department of Transportation Science, National Taiwan Ocean University, No.2, Beining Rd., Keelung City 202, Taiwan (R.O.C). (corresponding author to provide phone: 0939-939-487; e-mail: [email protected]).
L. A. Chen Author is with National Taiwan Ocean University, Department of Transportation Science, email: [email protected]
S. L. Kao Author is with National Taiwan Ocean University, Department of Transportation Science; Center of Excellence for Ocean Engineering, email: [email protected]
C. M. Su Author is with National Taiwan Ocean University, Department of Transportation Science; Center of Excellence for Ocean Engineering, email: [email protected]
M. F. Yang Author is with National Taiwan Ocean University, Department of Transportation Science; Center of Excellence for Ocean Engineering, email: [email protected]
lower CO2 emissions through their lifetime, as compared to disposable containers. As a result, appropriately coordinating the usage of RTIs and finished products in a closed-loop supply chain helps to lower the cost of disposing used packaging material and reduce unnecessary waste generation. Moreover, we assume that the return time of RTIs is stochastic due to some uncertain factors which could be the result of labor shortages, damages of RTIs or cleaning operations that have to be performed at the buyer before RTIs can be returned to the supplier. Above uncertain factors may cause delays in returning empty RTIs and lead to stock out at the supplier's side. Therefore, we programs a coordinated supply chain inventory system model by supposing that the products manufactured by the vendor are shipped in RTIs during delivery process and assuming a stock out of RTIs may occurs at the vendor and thus cause products to deteriorate. In addition, we adjust the inclusion of fuzzy supplier’s production rate to our proposed model. The purpose of this research studies how the negative effects determined by delays in returning RTIs impact the performance of whole closed-loop supply chain considered fuzzy production.
We must take the derivation of the expected total cost function with regard to n to verify the function is accordingly convex and obtain the optimal RTI lot size (n). In this case, application of the signed distance is useful for fuzzy numbers and finding the estimation of the common minimum total cost.
II. LITERATUREREVIEW
In a survey of the related literature, reusable packaging material has increasingly been the popular topic of research. Kim, Glock, and Kwon (2014) studied the scenario of a single supplier shipping a product possible of deteriorating to a single buyer. The authors assumed that the return time of empty RTIs is stochastic and exponentially distributed in this research. The results of this research clearly illustrates that increasing the return lot size of RTIs and the freight quantity of products helps to decrease the probability of backorders and related cost. Another popular topic with regard to the usage of RFID is designed to simplify tracks and disposal of RTIs (e.g. Hellstrom 2009, Ilic et al. 2009 and Kim and Glock 2014) and the prediction of RTIs return status including damage situation or quantities. (e.g. Goh and Varaprasad 1986, Kelle and Silver 1989, Klug 2011). Glock and Kim (2014) researched a single supplier shipping a product to various buyers. The authors assumed supplier used RTIs to deliver the product to the buyers, which caused two sorts of inventory that are necessary to be considered at the supplier and the buyers, that is RTIs inventory and finished products inventory. The results of this research implied that the demand rate of the buyers and their individual RTIs return times are significant for the operation of the whole supply
Fuzzy Closed-Loop Supply Chain considered
Container Return Time
chain.
Another key point of this research reviewed here studies inventory replenishment strategy under stochastic lead times. By reason of stochastic RTIs return lead times, shipments may arrive early, on time or late at the supply chain. However, whether shipments arrive early or late, it will lead to a profit reduction in the inventory system. A quite correlative model was developed by Sajadieh and Jokar (2009), whose model primarily presumed that lead times are considered to be exponentially distributed. Hoque (2013) extended this model and considered that lead times have normal distribution and programmed a more accurate formulation of the inventory holding charges of the supply chain. Another extension of these models was proposed by Sajadieh and Thorstenson (2014), who consider a second supplier and made this scenario in comparison with the case of single source. Their results implied that duplicate source is profitable particularly on condition that lead time varies extremely, shipping delays lead to very huge shortage costs, suppliers’ set up costs are low, and buyer’s carrying charges are quite higher than supplier’s.
In today’s complicated environment, fundamental inventory model unable to solve more realistic problem of inventory and supply chain and thus more and more scholars adopt fuzzy theory to inventory model, for example, H.M. Lee and J.S. Yao (1998) fuzzified both of the demand and the production to resolve the problem of economic production quantity. The results indicated that the total cost is a little higher than in the traditional model; however, it acquired a superior use of the EPQ in the crisp generating little interruption in the production and demand model. M.F. Yang, H.J. Tu and C.M. Wang (2007) modified and added fuzzy to setup cost and ordering cost in this inventory model and then adopted two methods to defuzzify and estimate the yearly total cost. C.H. Pan and M.F. Yang (2008) proposed and added fuzzy theory to demand rate and production rate, and then adopted the signed distance, a sorting method for fuzzy numbers, to calculate the general total cost in a uncertain environment. T.F. Liang, T.S. Huang, and M.F. Yang (2012) proposed a multiple fuzzy goals programming (MFGP) model to solve project management (PM) decision problems under uncertain environment. This model aimed at minimizing total costs, total execution time and total crashing costs regarding direct costs, indirect costs, contractual forfeit, period of activities and budget restriction.
III. MATERIALSANDMETHODS
To develop our proposed model, the following terminology will be used throughout this study.
3.1 Notations
supplier’s set-up cost ( $/setup)
buyer’s ordering cost ( $/order)
production rate for finished products at the supplier’s site ( kg/year)
demand rate for finished products at the buyer’s
site ( kg/year)
inventory carrying cost for finished products at the buyer’s site ( $/unit/time)
inventory carrying cost for finished products at the supplier’s site ( $/unit/time)
inventory carrying cost for RTIs at the buyer’s site ( $/unit/time)
inventory carrying cost for RTIs at the supplier’s site ($/unit/time)
shortage cost factor for finished products at the buyer’s site ( $/unit/time)
lot size of finished products (kg)
RTI lot size to delivery Q units of the finished products (an integer variable)
transport capacity of a single RTI (kg)
expected RTI return time with > 0
real RTI return time with t > 0
standard deviation of RTI return time
Triangular fuzzy number,
f (.) : probability density function of lead time
cumulative distribution function of RTI return time
The model is developed under the following assumptions: 3.2 Assumptions
This paper studies a closed-loop supply chain with a single supplier and a single buyer.
Mean return time is assumed to be stochastic.
The time and cost for loading, transporting and unloading RTIs are considered to be ignorable.
Shortages are allowed and assumed to lead to shortage cost.
Deterioration of the finished products will not occur during the production time and stockouts in RTIs at the supplier’s side.
3.3 Model development
This paper considers a scenario where a company or industry transport products to its customer by using RTIs which will be returned once they have been emptied.Thus, the return time of RTIs with mean is assumed to be stochastic and that three different cases may be determined by the realised RTIs return time :
Case 1: t ≤
RTIs are returned to the supplier before the lot of finished products has been accomplished, which makes supplier essential to store the return RTIs and leads to inventory holding charge for RTIs at the supplier. The returned shipments of RTIs reach to the supplier between times 0 and
. The estimation of total cost per cycle of case1 is expressed as follow:
where
Case 2: < t ≤ +Q/
the lot size Q exceeds the backorders quantity. The returned shipments of RTIs reach to the supplier between times and +Q/ . The estimation of total cost per cycle of case2 is expressed as follow:
where
t
Case 3: +Q/ < t <
Return shipments are late and shortage occurs, but the backorder quantity equals the lot Q. The returned shipments of RTIs reach to the supplier between times +Q/ < t< . The estimation of total cost per cycle of case3 is expressed as follow:
After concluding case1 to case3,the expected total cost of of per unit of time can be stated as follow:
where
By substituting for Q, the expected total cost of of per unit of time can be expressed by:
where
Definition 1. From kaufmann and Gupta (1991), Zimmermann (1996), Yao and Wu (2000), for a fuzzy set and ≤ ≤ , the -cut of the fuzzy set is , We can obtain the following equation.
the -cut ( ≤ ≤ ) of ’s left side and right side is given by:
, and
The signed distance of to is defined as:
Streamlined distance method is used to the defuzzification of . The expected total cost of per unit of time can be rearranged as follow:
3.4 Solving Procedure
where
By considering the case of an exponentially distributed lead time, i.e., with we can
determine an optimal solution for n.
where
Furthermore, an optimal solution for n can be found by increasing n stepwise from 1 until ETC increases for the first time. An optimal solution for has to satisfy the following condition:
≤
IV. NUMERICAL EXAMPLE
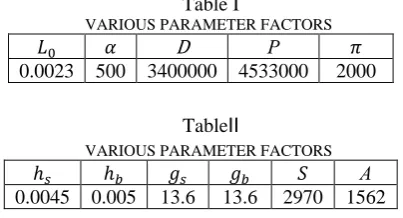
We refer to the parameters of Kim, Glock, and Kwon (2014) and analyzed the numerical results of our inventory model. The following data were acquired:
[image:4.595.43.553.52.198.2]The mean return lead time of RTIs averages 0.0023 years ( = 0.0023 years). The RTI capacity, , is 500 kg. Inventory carrying charges for RTIs and finished products at the vendor’s and retailer’s side are = $0.0045/kg, = $0.005/kg, = = $13.6 per RTI. The other model notations are stated as follows: D = 3,400,000 kg per year, = 4,533,000 kg per year, S = $2970 per setup, A = $1562 per order and = $2.5 per unit short. Additionally, we need to decide multiple sets of directly to calculate the expected total cost in an uncertain environment. All of the results would be presented in Table III.
Table I
VARIOUS PARAMETER FACTORS 0.0023 500 3400000 4533000 2000
TableⅡ
VARIOUS PARAMETER FACTORS
0.0045 0.005 13.6 13.6 2970 1562
[image:4.595.273.553.278.526.2](1) When , the total cost in traditional model is larger than in fuzzy model. That is to say if the variation between and is smaller in proposed fuzzy model, the correlated variation of ordering quantity and total cost between the fuzzy model and the traditional model will also be smaller.
TABLE III
NUMERICAL EXAMPLE RESULTS
250000 500000 0.000000218 1855 32949.2 500000 1000000 0.000000217 1856 32941.8 750000 1500000 0.000000216 1856 32933.8 1000000 2000000 0.000000216 1856 32933.8 1250000 2500000 0.000000217 1855 32941.7 1500000 3000000 0.000000219 1855 32954.8 3000000 3000000 0.000000265 1836 33279.2 2500000 1250000 0.000000258 1839 33230.6 2000000 1000000 0.000000245 1844 33138.5 1500000 750000 0.000000236 1848 33075.8 1000000 500000 0.000000229 1851 33026
500000 250000 0.000000224 1853 32991.5 (2) When , the total cost in traditional model is
lower than in fuzzy model.
(3) According to the TABLE III, we can note that the minimum of expected total cost equals 32933.8$ while
and .
V. CONCLUSION
In this proposed model we found on condition that longer return lead time would increase the probability of delays resulting in huge backorders at the retailer in returning RTIs. Apparently excessive backorders cause the production cost and shortage cost to get higher, and even make the competitiveness and operation of the supply chain decline over a long time. Relatively we could adopt an appropriate approach to decrease huge backorders by increasing the return lot size of RTIs or inspiring buyers to return RTIs on time.
[image:4.595.68.270.665.774.2]of renting time. These extensions are worth studying for related academic field.
REFERENCE
[1] C.H. Pan* and M.F. Yang, “Integrated inventory models with fuzzy annual demand and fuzzy production rate in a supply chain”, International Journal of Production Research, 46 (2008), No.3, 753-770.
[2] Goh, T. N., and N. Varaprasad. 1986. “A Statistical Methodology for the Analysis of the Life-Cycle of Reusable Containers.” IIE Transactions 18 (1): 42–47.
[3] Glock, C. H., and T. Kim. 2014. “Container Management in a Single-vendor-multiple-buyer Supply Chain.” Logistics Research 7: 112.
[4] Goellner, K. N., and E. Sparrow. 2014. “An Environmental Impact Comparison of Single-use and Reusable Thermally Controlled Shipping Containers.” The International Journal of Life Cycle Assessment 19 (3): 611–619.
[5] H.M. Lee and J.S. Yao. 1998. “Economic production quantity for fuzzy demand quantity and fuzzy production quantity.” European Journal of Operational Research, 109, 203-211.
[6] Hellstrom, D. 2009. “The Cost and Process of Implementing RFID Technology to Manage and Control Returnable Transport Items.” International Journal of Logistics: Research and Applications 12 (1): 1–21.
[7] Hoque, M. A. 2013a. “A Vendor–Buyer Integrated Production-inventory Model with Normal Distribution of Lead Time.” International Journal of Production Economics 144 (2): 409–417.
[8] Ilic, A., J. W. P. Ng, P. Bowman, and T. Staake. 2009. “The Value of RFID for RTI Management.” Electronic Markets 19 (2): 125–135. [9] J.S. Yao., S.C. Chang, and J. S. Su. 2000. “Fuzzy inventory without backorder for fuzzy order quantity and fuzzy total demand quantity.” Computer & Operational Research, 27, 935-962.
[10] Kelle, P., and E. A. Silver. 1989. “Forecasting the Returns of Reusable Containers.” Journal of Operations Management 8 (1): 17–35.
[11] Klug, F. 2011. “Automotive Supply Chain Logistics: Container Demand Planning using Monte Carlo Simulation.” International Journal of Automotive Technology and Management 11 (3): 254–268.
[12] Kim, T., C. H. Glock, and Y. Kwon. 2014. “A Closed-loop Supply Chain for Deteriorating Products under Stochastic Container Return Times.” Omega 43: 30–40.
[13] Kim, T., and C. H. Glock. 2014. “On the Use of RFID in the Management of Reusable Containers in Closed-loop Supply Chains under Stochastic Container Return Quantities.” Transportation Research Part E: Logistics and Transportation Review 64: 12–27.
[14] Maxwell, D., and R. van der Vorst. 2003. “Developing Sustainable Products and Services.” Journal of Cleaner Production 11 (8): 883–895.
[15] M.F. Yang*, H.J. Tu and C.M. Wang, “Determining the single-vender and single-buyer inventory strategy with fuzzy setup cost and fuzzy ordering cost”, Journal of Statistics & Management Systems, 10 (2007), 499-510.
[16] M.F. Yang*, “Optimal strategy for the integrated vendor-buyer inventory model with fuzzy annual demand and fuzzy adjustable production rate”, Journal of Applied Sciences, 7 (2007), No.7, 1025-1029.
[17] M.F. Yang, M.C. Lo* and T.P. Lu (2013). “A vendor-buyers integrated inventory model involving quality improvement investment in a supply chain.” Journal of Marine Science and Technology-Taiwan, 21(5), 586-593.
[18] M.F. Yang* and Y. Lin (2013). “Applying fuzzy multi-objective linear programming to project management decisions with the interactive two-phase method.” Computers & Industrial Engineering, 66(4), 1061-1069.
[19] Rosenau WV, Twede D, Mazzeo MA, Sing SP. Returnable/reusable logistical packaging: a capital budgeting investment decision framework. Journal of Business Logistics 1996; 17(2): 139–65. [20] Sharafali, M., and H. C. Co. 2000. “Some Models for
Understanding the Cooperation between the Supplier and the Buyer.” International Journal of Production Research 38 (15): 3425–3449.
[21] Sajadieh, M. S., M. R. A. Jokar. 2009. An Integrated Vendor–Buyer Cooperative Model under Stochastic Supply Lead Time.
International Journal of Advanced Manufacturing Technology 41 (9–10): 1043–1050.
[22] Sajadieh, M. S., and A. Thorstenson. 2014. “Comparing Sourcing Strategies in Two-echelon Supply Chains.” Computers & Operations Research 45: 108–115.
[23] T.Y. Huang and M.F. Yang*, “Integrated inventory decision support system with backorders and controllable lead time”, Journal of Information & Optimization Sciences 29 (2008), No.3, 513-522.