Abstract— High energy synchrotron X-ray diffraction is
widely used for residual stress evaluation. Rapid and accurate conversion of 2D diffraction patterns to 1D intensity plots is an essential step used to prepare the data for subsequent analysis, particularly strain evaluation. The conventional multi-step conversion process based on radial binning of diffraction patterns (‘caking’) is somewhat time consuming. A new method is proposed here that relies on the direct ‘polar transformation’ of 2D X-ray diffraction patterns. As an example of using this approach, residual strain values in an Al alloy bar containing a Friction Stir Weld (FSW) and subjected to in situ bending were calculated by using both ‘polar transformation’ and ‘caking’. The results by the new approach show good agreement with ‘caking’ microstrain evaluation. However, the ‘polar transformation’ technique simplifies the analysis process by skipping 2D to 1D conversion and opens new possibilities for robust 2D diffraction data analysis for strain evaluation.
Index Terms— Polar transformation, residual stress,
synchrotron X-ray diffraction
I. INTRODUCTION
ESIDUAL stresses play a significant role in defining properties and the deformation behavior of processed engineering materials [1]. They can be defined as those stresses that remain in a body after manufacturing or processing without the effects of external fields (e.g. applicable forces or thermal gradients) [2]. The technological relevance of residual stresses is that the superposition of internal and external stresses may have a positive or negative impact on the mechanical properties of materials depending on their value and sign. Thus, the knowledge of residual stress distribution can help analyze the deformation behavior based on total stress under in-service conditions, and optimize the durability of engineering components and assemblies [3].
In the last two decades, various approaches were developed connecting the conventional mechanical methods
Manuscript received April 08, 2019; revised April 19, 2019.
E.S. Statnik is with AMT, Skoltech Advanced Manufacturing Technologies, Skolkovo Institute of Science and Technology, Nobel St., 3, Moscow, Russia 121205, e-mail: [email protected]
A.I. Salimon is with CEE, Skoltech Center for Electrochemical Energy Storage, Skolkovo Institute of Science and Technology, Nobel St., 3, Moscow, Russia 121205, e-mail: [email protected]
F. Uzun is Marie Curie Post-Doctoral Fellow with MBLEM, the University of Oxford, Department of Engineering Science, Oxford OX1 3PJ, email: [email protected]
A.M. Korsunsky is Head of MBLEM, the University of Oxford, Department of Engineering Science, Oxford OX1 3PJ; e-mail: [email protected]; and with Skolkovo Institute of Science and Technology, Nobel St., 3, Moscow, Russia 121205
with modern microscopy techniques for the purpose of experimental evaluation of residual stresses and strains at the micro-scale. For the experimental estimation of residual stresses, X-ray diffraction methods (XRD) offer special benefits [4]. Firstly, XRD is a non-destructive technique which preserves material integrity during the test, unlike other destructive or semi-destructive methods which cannot be directly checked by repeat measurements. Secondly, other methods require stress-free reference samples, which are usually difficult to construct and prepare. Furthermore, their spatial resolution and depth penetration are typically orders of magnitude worse than those of XRD [5].
X-ray diffraction approach is conveniently classified into synchrotron-based and traditional laboratory XRD due to the significant differences in terms of spatial resolution, flux, energy, and penetration ability: whilst laboratory experiments are typically performed at the surfaces at mm lateral resolution, at synchrotron this can be done in transmission through cm-thick samples, whilst lateral beam sizes can be scaled down to allow micro- and even nano-diffraction experiments.
Stress is a derived extrinsic property that is defined as force per unit cross-sectional area that is not directly measurable. Consequently, all approaches of stress calculation require measurement of some intrinsic property, such as strain, or indirect deduction of force (and area). An additional benefit of the synchrotron-based method is that it can provide information about the average bulk strain over the depth of the sample, and not just from the surface as for other methods [6, 7].
Advanced, robust and convenient strain analysis approach is based on Digital Image Correlation (DIC) [8]. However, in its original ‘tracking’ form it is only capable of following the strain evolution from a reference state. In the absence of such reference, DIC is unable to determine residual stress. The use of high energy synchrotron X-ray diffraction provides the possibility of measuring residual elastic lattice strain, and then deducing stresses by using the material’s elastic properties in the generalized Hooke’s law expression. Thus, the emphasis of synchrotron diffraction data interpretation falls on strain determination from XRD scattering patterns. To streamline and speed up the interpretation of large quantity of data files, a DIC-based approach has been proposed [2]. Whilst that approach offers a reduction in effort and may speed up analysis, further alternative procedures may be proposed for the processing of 2D detector images to achieve efficient extraction of 2D strain states. This forms the core objectives and the results included in the present report.
Polar Transformation of 2D X-ray Diffraction
Patterns for 2D Strain Evaluation
Eugene S. Statnik, Alexei I. Salimon, Fatih Uzun and Alexander M. Korsunsky,
Member, IAENG
II. METHODS AND MATERIALS
A. Sample Preparation
A 4 mm-thick rolled plate of Aluminum alloy AA6082-T6 plate was used for the manufacturing of a Friction Stir Welded (FSW) joint. The welded plate was subjected to wire Electro Discharge Machining (EDM) to cut out a sample with parallel sides. The sample was then subjected to four-point bending to induce permanent plastic deformation associated with specific bending strain profile.
B. XRD Experiment
The experiment was conducted at Diamond Light Source on the Test Beamline B16. The beam energy was defined at 18keV using multi-layer monochromator. The variation of strain across the bent bar was investigated by scanning the sample across the beam (collimated to 0.1 mm square beam spot).
C. Pre-Processing and Calibration
In diffraction mode involving monochromatic beam impinging on a powder or polycrystalline sample, beams scattered from a family of crystallographic planes associated with a set of (hkl) Miller’s indices have a fixed angle with
the incident beam direction, forming cones that appear on a 2D detector as concentric Debye-Scherrer rings. All residual stress analyses based on the measurement of interplanar lattice spacings dhkl of the lattice plane with Miller's indices
using Wulff-Bragg law:
2
d
hklsin
n
,where θ – diffraction angle, λ – wavelength, and
n is a positive integer.
(1)
Defining precise residual strain values requires careful interpretation of 2D XRD patterns so that the radial peak position reaches the accuracy approaching 10-4 or even
better. Now there is a reliable and efficient approach for 2D XRD data interpretation based on radial-azimuthal binning (colloquially referred to as ‘caking’) which allows obtaining strains with high accuracy. However, this method has some drawbacks in terms of the large processing time and large number of steps required. ‘Caking’ is a multi-stage process that involves the following stages: calibration, conversion of the 2D pattern into a 1D profile, and Gaussian fitting for peak center determination to calculate strain values.
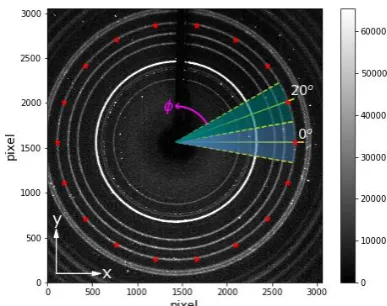
[image:2.595.327.521.53.206.2]The first experimental step is the assembly of ancillary equipment for positioning (and possibly loading) the sample, placing the detector and beam stop, calibrating the distance between, and obtaining exact information regarding the image center of diffraction patterns, and calibrating the geometrical distortion related to detector's orientation angle. Next, it is essential to collect scattering patterns from reference sample(s) and processing them via ‘caking’ to reduce 2D diffraction pattern to 1D radial functions of the azimuthal angle φ that can be visualized as line plots of scattered beam intensity against radial position R (Fig. 1).
Fig. 1. 2D diffraction pattern of calibration with selected azimuthal angle φ in 20° increments to produce 1D intensity
distributions.
In this study calibration test was applied for a non-deformed sample that enables to define the exact center position of the diffraction pattern and use this for all subsequent analyses. By indicating the approximate start point and upper and lower limits of variations of azimuthal angle, the binning sector width is defined. Then, the selected region is binned with a step of φ, and the center of the diffraction pattern found by means of ensuring 2-fold symmetry of the rings.
Due to the visible ‘shadowing’ effect of the beamstop, radial intensity distributions were found for two pairs azimuth angles: (45˚, 225˚) and (135˚, 315˚) for calibrating
X and Y directions at once. Center of calibration image was achieved by comparison of the position of the same peaks for two symmetric profiles approximated by Gaussian function. If the distance between these peak's centers exceeds 0.001 pixels the X0 and Y0 positions are changed and
‘caking’ approach is repeated again until required accuracy is reached.
[image:2.595.328.526.598.722.2]Moreover, in the process of calibration image analysis, detector saturation effect was found, illustrated in Fig. 2. Note that the peak shape of the brightest ring is flattened at the top due to the maximum threshold pixel intensity reached (65535 counts for 16-bit “TIF” format). Consequently, these points must be excluded from Gaussian fitting.
Fig. 2. The peak of a 1D intensity distribution with indicated ‘o’-blue experimental data, ‘x’-green
azimuthal angles around values of 0˚, 45˚, 90˚, 135˚, 180˚, 225˚, 270˚, 315˚, and 360˚.
Step three is fitting of most intense peak positions (Ri) as
a function of the azimuthal angle (φi) by a sine function,
namely,
sin(2(
))
i i
R
a b
c
,where a, b and c are offset, amplitude and phase shift, respectively.
(2)
The relationship between residual strain and d-spacing is defined as
0
0 0 0 0
1
1
d
d
d
a b
d
d
a
b
,where ε is an elastic residual strain, d = a + b is
d-spacing of a strained sample, and d0 = a0 + b0 is the
value of d-spacing when the sample is strain free (from calibration image).
(3)
Nevertheless, conventional ‘caking’ approach has drawbacks, as it requires defining regions, selecting directions, splitting into sectors and averaging them that are imprecise for a textured sample whose ring intensity is nonuniform or spread on ring region. This should be considered in the context of the processing time of this analysis increasing manifold for large amounts of images.
In this investigation we consider a new technique of determining residual strain based on the geometric transformation [9] of 2D diffraction pattern from a Cartesian to polar coordinate system with respect to the pattern center (Fig. 3), namely,
0 0
0 0
0
0
(
,
)
(
,
);
(
,
)
(
,
);
( );
3056
( ).
360
i i i i
i i i i
i
i
X
X Y
Y
R
I R
I X
X Y
Y
X
X
R
magnitude I
pixel
Y
Y
angle I
(4)
[image:3.595.302.540.506.755.2]Following this cartesian-to-polar transformation, Debye–Scherrer rings can be displayed as lines on the radial-azimuthal contour plot. Following this, the entire transformed intensity pattern can be fitted with a sine function (2) to determine the residual strain variation (3).
Fig. 3. The typical 2D diffraction pattern (a) and its polar transformation (b).
The main goal of this transformation is to improve the efficiency and reduce the total processing time of 2D XRD patterns, whilst preserving the accuracy of analysis.
III. RESULTS
In this study, the accuracy of a new technique based on the polar transformation of 2D XRD patterns was validated by comparison with the conventional ‘caking’ method. Programming language Python 3.7 with set standard libraries (os, numpy, scipy, matplotlib, lmfit, opencv and skimage) was used for obtaining 1D profiles from 2D patterns, Gaussian and polar transformation fitting respectively.
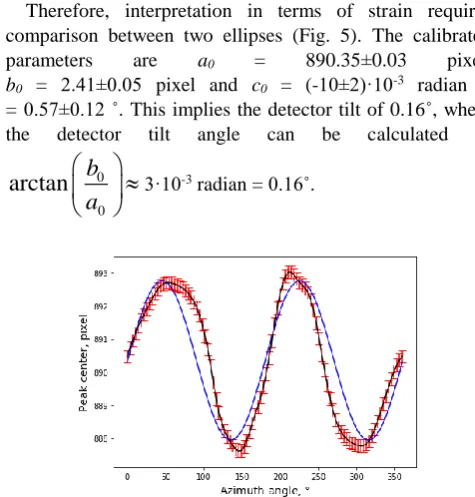
Firstly, the center of the 2D diffraction pattern of the reference sample was found with the accuracy about 0.001 pixels for (45˚, 225˚) and (135˚, 315˚) azimuthal angle pairs, respectively. According to theoretical knowledge about the stress-strain condition is that centers of two symmetrical peaks of 1D intensity plot in non-deformed material should be equal with given precision. However, fitting a Gauss function for each peak and calculating the radial position of each center led to a non-symmetrical distribution illustrated in Fig. 4. This behavior connected with deformation ring into ellipse due to two main factors. At first, the primary source of distortion of a ring into an ellipse is detector plane tilt that purely based on an oblique section of Debye-Scherrer cone. However, the strain also distorts the ring that comes from strain transformation:
1 2 1 2
( )
cos 2
2
2
where ε1 and ε2 are principal strains in principal
directions that are rotated by angle φ with respect to Cartesian axes (x, y) considering that φ = 0 is along x.
(5)
Therefore, interpretation in terms of strain requires comparison between two ellipses (Fig. 5). The calibrated parameters are a0 = 890.35±0.03 pixel, b0 = 2.41±0.05 pixel and c0 = (-10±2)·10-3 radian =
= 0.57±0.12 ˚. This implies the detector tilt of 0.16˚, where the detector tilt angle can be calculated as
0
0
arctan
b
a
3·10 [image:3.595.56.282.663.763.2]-3 radian = 0.16˚.
Fig. 5. The impact of detector plane tilt and strain on ring collapse into an ellipse.
[image:4.595.327.524.127.390.2]Next the diffraction patterns for the sample described in part IIA were processed by ‘caking’. At first, preliminary preparation of images needed to be carried out because of the supersaturation effects illustrated in Fig. 6, where run lines or weak contrast are seen.
Fig. 6. Beam position on the sample and the collage of 2D diffraction patterns with development visual defects. To overcome these effects that arise due to sample grainy nature, a sum of patterns in horizontal rows in the scan map was studied (Fig. 7).
Fig. 7. Example of summarized pattern.
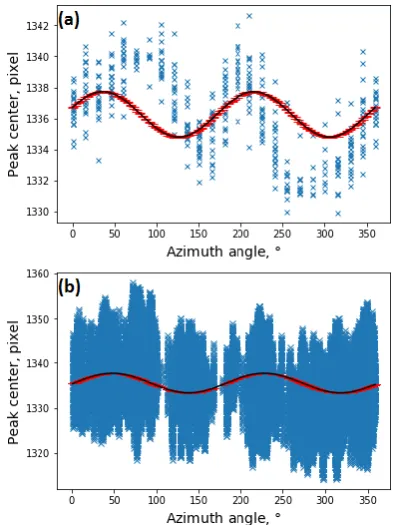
The approaches described above were applied to the series of summed diffraction patterns as a function of vertical position. Fig. 8 shows the dependence of peak center positions on the azimuthal angle. The set of experiment data of ‘caking’ significantly less than in case ‘polar transformation’. It influences essential difficulties related
with comparison two methods: the lack of experimental points for ‘caking’ approach is connected with a particular small angle range by contrast with ‘polar transformation’ where fitting the entire 360˚. At result, gets a small error for the fitting parameters, and hence strain.
Fig. 8. The dependence of peak center position against azimuth angle range on (0˚, 360˚, step 15˚) for ‘caking’ (a) and the complete revolution for ‘polar transformation’ (b): the blue ‘x’ markers are experimental data, the black solid
lines are sine fitting (with red error bars).
Fig. 9 demonstrates the correlation between data of residual elastic strains at the azimuth angles from 0˚ to 360˚ with a step equals 15˚ respectively. The ‘caking’ fit profiles are illustrated as a light blue solid line and the profiles after polar transformation are shown using an orange solid line with the associated red and black error bars respectively.
[image:4.595.78.270.335.480.2]The offered Cartesian-to-polar transformation technique does not prevent to determine all strain and consequently stress values with their directions. Defining results by a new approach show fine agreement with ‘caking’ microstrain results.
Fig. 9. Comparison of residual elastic strains obtained from ‘caking’ (blue top line) and ‘polar transformation’ (orange
[image:4.595.329.524.621.739.2]IV. DISCUSSION AND CONCLUSION
In this study, a new technique for the processing of 2D X-ray diffraction patterns from synchrotron experiments is presented that is referred to as the ‘polar transformation’ interpretation approach. The advantage of ‘polar transformation’ lies in the ability to perform fast processing of large numbers of 2D diffraction patterns without repeated binning conversions, with the specific purpose of extracting strain information.
The key benefits of the new method are:
(a) reduction of computational effort and processing time; (b) simplification of the analysis by omitting the conversion of 2D patterns to 1D profiles followed by Gaussian peak fitting;
(c) minimizing possible error sources associated with polar-radial binning (‘caking’). In particular, Fig. 8 demonstrates that ‘polar transformation’ makes use of more statistically representative data sets.
The processing time was estimated using Python timing library. The processing time for 10 summed images required ~10 minutes using the ‘caking' approach, while the ‘polar transformation’ method required only ~30% of this time. It should nevertheless be noted that binning is required at the initial stage of precise pattern center determination.
Modern data processing targets fast, operator-independent, automated procedures applicable to big data. The new technique for the processing of 2D X-ray diffraction patterns collected at synchrotrons in large volumes conforms to these requirements. Furthermore, the efficiency of the new technique may additionally facilitate near online strain mapping in engineering objects during data collection. Cartesian-to-polar transformation of 2D synchrotron X-ray diffraction patterns allows separating Debye-Scherrer rings distortions into the contributions from detector misalignment and strain, respectively.
Good match in terms of strain results was found between Cartesian-to-polar and traditional ‘caking’ approaches for the case of friction stir welded (FSW) aluminum alloy sample, with clear advantages of the new technique in terms of processing speed and automation.
REFERENCES
[1] A. M. Korsunsky, “Variational eigenstrain analysis of synchrotron diffraction measurements of residual elastic strain in a bent titanium alloy bar,” Journal of Mechanics of Materials and Structures, vol. 1, 2006, pp. 259-277.
[2] J. Lord, D. Cox, A. Ratzke, M. Sebastiani, A. Korsunsky, E. Salvati, M. Z. Mughal, and E. Bemporad, “A good practice guide for measuring residual stresses using FIB-DIC,” Measurement Good Practice Guide, no. 143, 2018.
[3] W. Reimers, “Analysis of residual stress states using diffraction methods,” Proceedings of the III Int. School and Symposium on Physics in Materials Science, vol. 96, 1999, pp. 229-239.
[4] H. J. Zhang, T. Sui, E. Salvati, D. Daisenberger, A. J. G. Lunt, K. S. Fong, X. Song, and A.M. Korsunsky, “Digital Image Correlation of 2D X-ray Powder Diffraction Data for Lattice Strain Evaluation,” Journal Materials, vol. 11, 2018, pp. 427-440.
[5] P. S. Prevey, “X-ray diffraction residual stress techniques,” Lambda Research, p. 18.
[6] A. M. Korsunsky, K. E. Wells, and Ph. J. Withers, “Mapping two-dimensional state of strain using synchrotron X-ray diffraction,” Scripta Materialia, vol. 39, 1998, pp.1705-1712.
[7] X. U. Yaowu, B. A. O. Rui, “Residual stress determination in friction stir butt welded joints using a digital image correlation-aided slitting technique,” Chinese Journal of Aeronautics, vol. 30, 2017, pp. 1258-1269.
[8] A. J. G. Lunt and A. M. Korsunsky, “A review of micro-scale focused ion beam milling and digital image correlation analysis for residual stress evaluation and error estimation,” Surface and Coatings Technology, vol. 283, 2015, pp. 373-388.
[9] OpenCV 2.4.13.7 documentation [Online]. Available: