Abstract—Tires are highly durable and non-biodegradable and have negative impacts of landfill disposal. Waste tire pyrolysis char was chemically activated using KOH for copper ions removal from aqueous solution. The scanning electron microscope, proximate analysis and x-ray fluoresce are confirmed that chemical activated of waste tire pyrolysis char took place. The adsorption result revealed that waste tire activated carbon (WTAC) was more effective than waste tire pyrolysis char (WTPC) on the removal of copper ions from aqueous solution. The optimum process variables were found to be suitable: pH of 5; adsorbent dosage of 0.25 g/100 mL; initial concentration of 400 mg/L; contact time of 100 min and temperature of 25oC. Adsorption isotherms studies revealed that the experimental data were best fitted with Freundlich isotherm model. Moreover, the adsorption kinetics was best fitted with pseudo-first order model. Adsorption thermodynamic parameter such as ∆Ho, ∆Go and ∆So were calculated and it was established that the process was exothermic spontaneous and randomness in nature.
Keywords: Waste tire activated carbon; waste tire pyrolysis char; Copper ions; Removal; Aqueous solution.
I. INTRODUCTION
opper is usually found at high concentration in wastewater, because it is considered as the most valuable and commonly used metal in many industrial applications, such as metal finishing, electroplating, plastics and etching [1, 2]. Moreover, copper is very toxic metal even at low concentration. Copper may cause many harmful damages for eye and liver and the imbalance in cellular [3]. Several treatment techniques have been used including chemical precipitation, adsorption, membrane separation, bio-electrochemical system, ion-exchange and electrochemical [3, 4]. Amongst all these techniques, adsorption of Cu2+ using activated carbon is gaining a lot of
recognition due to its high efficiency, easy operation, low cost, and energy efficiency [5]. Commercial activated carbon is the most used adsorbent for the adsorption of heavy metals due to its porosity and has high surface area. The major concern about commercial activated carbon is that it is very expensive [6]. This has led to a growing demand to
Manuscript received July 10, 2019; revised August 11, 2019. This work was supported by the Department of Chemical Engineering, Vaal University of Technology, South Africa.
J. Kabuba is with the Department of Chemical Engineering, Faculty of Engineering and Technology, Vaal University of Technology, Private Bag X021, Vanderbijlpark 1900, South Africa. Tel. +27 16 950 9887; fax: +27 16 950 6491; e-mail: johnka@ vut.ac.za.
produce low cost activated carbon for the removal of Cu2+
ions from waste water. Efforts have been made to produce activated carbon from agricultural wastes, solid wastes, and by-products form other processes. Waste tires are creating a great environmental problem throughout the world since the rate at which they are being produced continues to increase rapidly every year and it is becoming difficult to dispose them in an environmentally friendly manner. The strict regulations restricting the disposal of waste tires into landfill sites means that there is need for other alternative environmentally safe ways of disposing waste tires. Pyrolysis of the waste tires has been regarded as the most promising method for the utilization of the waste tires since the process is to reduce the weight of the waste tires by up to 90% of its original weight and it results in the production of products such as waste tire pyrolysis oil, pyrolysis char and pyrolysis gas [6]. The waste tire pyrolysis char can further be processed by activation to produce activated carbon with good adsorption properties. The activation methods include chemical and physical activation. Chemical activation involves the use of chemical reagents to produce activated carbon with superior adsorption properties and physical adsorption involves the use of oxidizing agents such as carbon dioxide and superheated steam to produce activated carbon with good adsorption properties [7]. This study aims at producing activated carbon by means of chemical activation using KOH as an activating agent and for subsequently its use the removal of copper ions from aqueous solution.
II. MATERIALS AND METHODS
Waste tire pyrolysis char (WTPC) obtained in powder form from a local company. Potassium hydroxide, sodium hydroxide, hydrochloric acid and CuSO4.5H2O were
analytical grade and were obtained from Sigma Aldrich (Pty). 100g of WTPC was firstly washed with distilled water to remove impurities. The washed sample was then placed in a drying oven for 24 hours at 100oC. Thereafter the sample
was then sieved to a particle size less than 100µm. After the sample was impregnated with 500mL aqueous solution of KOH at an impregnation ratio of 2:1 (weight of KOH: weight of char) and the mixture was stirred at 80oC for 4
hours to complete the impregnation process. The slurry produced from the impregnation process was dried in a drying oven at 100oC for 24 hours to remove moisture. The
dry sample was activated in a tube furnace at a temperature of 600oC for 1 hour using nitrogen. After the activation the
Removal of Copper Ions from Aqueous Solution
Using Activated Carbon Derived from Waste
Tire Pyrolysis
John Kabuba,
Member IAENG
sample was washed with 1M solution of HCl to remove ash and sulphur content and thereafter dried overnight. The adsorption experiments were carried out to determine the effect of process variables (pH, temperature, adsorbent dosage, initial metal concentration and contact time) on the percentage removal of copper ions from aqueous solution. After the adsorption process, the samples were filtered using 125µm filter papers. The filtrates were then diluted and analyzed using an atomic adsorption spectrometer. The percentage removal of Cu2+ (Re) from aqueous solution was
determined using Eq. (1):
i o i
C
C
C
−
=
Re
(1)Where Ci and Co are concentrations of Cu2+ before and after
adsorption process, respectively.
III. RESULTS AND DISCUSSION
A. Adsorbent characterization
A.1. Scanning Electron Microscopy (SEM)
[image:2.595.47.289.314.453.2](a) (b)
Fig. 1. SEM image of (a) waste tire pyrolysis char (WTPC) and (b) waste tire activated carbon (WTAC)
Fig. 1 shows the SEM images for WTPC and WTAC. Fig. 1 (a) shows that the morphology of the WTPC consists of large particles which are not porous on the surface of the char as compared to Fig. 1 (b) where chemical activation produced WTAC with well-developed surface morphology containing a surface with finer porous particles.
A.2. Proximate analysis
From Table 1, it can be seen that there was a slight increase in the moisture content and fixed carbon content for the WTAC while there was slight decrease in the volatile and ash content after chemical activation with KOH at 600oC.
TABLEI
PROXIMATE ANALYSIS OF THE RAW WASTE TIRE PYROLYSIS CHAR AND THE WASTE ACTIVATED CARBON
Test description (%) WTPC WTAC ___________________________________________________________
MOISTURE 3.0 3.4
VOLATILES 1.1 0.8
ASH CONTENT 15.3 12.0
FIXED CARBON 80.6 83.6 This increase can be attributed to an increase in the surface area of the activate carbon after the activation of the WTAC.
The decrease in the volatile matter and increase in the fixed carbon content can be linked to the effect of KOH during the activation process. As the volatile matter was decreased, the fixed carbon content was increased. There was a slight decrease in the ash content of the activated carbon due to the of washing the activated carbon with HCl after activation.
A.3 X-ray fluorescence (XRF)
Table 2 shows a decrease in the amount of metals which were originally present in the char. The decrease in amounts of metal can be linked to the leaching effect of HCl towards the metals during the washing process after chemical activation. The increase in the amount of Potassium (K) was due to the introduction of KOH in the activation stage. Lopez et al., [8] reported the comparable results using acid demineralization of the char before activation. It was also observed that the inorganic matter decreased drastically after the acid demineralization of the tire pyrolysis char.
TABLEII
XRF RESULTS WTPC AND WTAC
WTPC WTPC WTAC WTAC (mg/kg) (%) (mg/kg) (%) ___________________________________________________________
K 76 1.24 516 9.82
CA 306 5.00 215 4.06
TI 17 0.28 15 0.29
CR 3.1 0.05 2.06 0.04
MN 4.5 0.07 4.1 0.08
FE 711 11.62 631 12.00
CO 287 4.69 239 4.55
NI 31 0.51 <0 0.00
CU 305 4.99 261 4.91
ZN 4377 71.55 3374 64.18 ___________________________________________________________ TOTAL 6117.6 100 5257 100
B. Adsorption studies
B.1 Effects of contact time on the % removal of Cu2+ from
aqueous solution using waste tire activated carbon and char
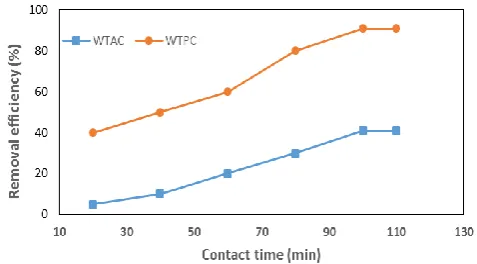
Fig. 2. Effect of contact time on the removal % of copper ions from aqueous solution (Adsorbent dosage = 0.25 g/100 mL, pH = 5, Initial metal concentration = 100 mg/L, Temperature = 25oC)
The effects of contact time on the percentage removal of Cu2+ are shown in Fig. 2. The percentage removal of Cu2+
increased with an increase in the contact time for both the WTPC and the WTAC. The notable observation was that WTPC and WTAC reached equilibrium at 100 min. It was also observed that the percentage removal of Cu2+ by WTAC
[image:2.595.311.550.499.631.2] [image:2.595.45.291.689.750.2]WTPC and WTAC were 41 and 91%, respectively. For WTPC and WTAC there was rapid increase in the percentage removal of Cu2+ at contact time to the availability
of adsorption sites on the surface of the WTPC and WTAC. Beyond 100 min the percentage removal of Cu2+ reduces
because WTPC and WTAC have limited adsorption sites.
B.2 Effects of pH on the % removal of Cu2+ from aqueous
[image:3.595.310.541.53.176.2]solution using waste tire activated carbon and char
[image:3.595.50.286.372.491.2]Fig. 3 shows that as the pH value of the solution increases, the percentage removal of copper ion also increases until the highest removal is achieved at pH 5 from which then the percentage removal starts to decrease for both WTPC and WTAC. The high removal percentages of copper ions at low pH values take place due to the presence of hydrogen atoms in solution at low pH values which complete with the copper ions for adsorption sites on the surface of the adsorbent. As the pH value of the solution is increased, there is an observed increase in the percentage removal of copper ions until the highest removal is achieved at pH 5. As the pH increases beyond pH 5 the removal percentage of copper decreased. This is because as the pH of the solution increases the copper ions present in solution start to hydrolyse and as a result they cannot be removed from solution.
Fig. 3. Effect of pH on the removal efficiency of copper ions from aqueous solution (Adsorbent dosage = 0.25 g/100 mL, Contact time = 100 min, Initial metal concentration = 100 mg/L, Temperature = 25oC)
B.3. Effect of adsorbent dosage on the % removal of Cu2+
from aqueous solution using waste tire activated carbon and char
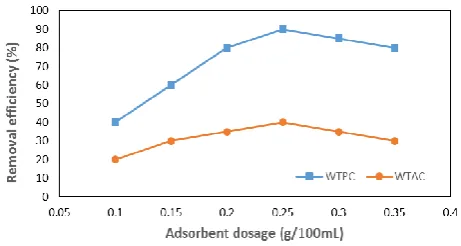
From Fig. 4, it can be seen that the percentage removal of copper ions increases gradually with an increase in the adsorbent dosage from 0.1g/100mL to 0.25g/100mL and thereafter the removal percentage remains unchanged with an increase in the adsorbent dosage from 0.25g/100mL to 0.35g/100mL for both WTPC and WTAC. The increase in the percentage removal of copper ions as the adsorbent dosage is increased from 0.1g/100mL to 0.25g/100mL is due to the availability of adsorption sites on the surface of the adsorbent to move copper ions being adsorbed onto the adsorption sites of the adsorbent. However, increasing the adsorbent dosage from an adsorbent dosage beyond 0.25g/100mL does not result in any further increase in the percentage removal of copper ions from aqueous solutions.
Fig. 4. Effect of adsorbent dosage on the removal efficiency of copper ions from aqueous solution (pH = 5, Contact time = 100 min, Initial metal concentration = 100 mg/L, Temperature = 25oC)
This behavior takes place because at an adsorbent dosage of 0.25g/100mL. An equilibrium between the adsorption sites on the surface of the adsorbent and the copper ions in solution has been reached and at this point the rate of adsorption is equal to the rate of desorption from the adsorption sites of the adsorbent which results in constant percentage removal of copper ions.
B.4. Effects of initial metal concentration on the removal of Cu2+ from aqueous solution using waste tire activation
carbon and char
From Fig. 5, WTAC achieved higher adsorption capacities for copper ions compared to WTPC and this is due to the chemical activation that took place.
Fig. 5. Effect of initial metal concentration on the removal efficiency of copper ions from aqueous solution (pH = 5, Contact time = 100 min, Adsorbent dosage = 0.25 g/100 mL, Temperature = 25oC)
For both WTAC and WTPC as the initial metal concentration increased the adsorption capacity increased until an initial metal concentration of 400mg/L. The adsorption capacity decreased gradually as the metal concentration was above 400mg/L. The increased in the adsorption capacity resulting from an increase in the initial metal concentration is due to increase concentration gradient between the bulk copper ions in solution and the availability of adsorption sites on the surface of the WTPC and WTAC [9].
B.5. Effect of temperature on the % removal of Cu2+ from
aqueous solution using waste tire activated carbon and char
In Fig. 6, as the temperature is increased from 25oC to
50oC there is a decrease in the percentage removal of copper
[image:3.595.310.544.414.527.2]From this behavior, it can be said that the adsorption of copper ions as the temperature increases is due to weakening of the attractive forces between the adsorption sites on the surface of the adsorbent and the copper ions in solution.
Fig. 6. Effect of initial metal concentration on the removal efficiency of copper ions from aqueous solution (pH = 5, Contact time = 100 min, Adsorbent dosage = 0.25 g/100 mL, Initial metal concentration = 100 mg/L)
B.6. Adsorption isotherms models
The Langmuir isotherm model is represented by Eq (2):
e L m m
e
q
q
K
C
q
1
)
1
(
1
1
=
+
(2)
Where qe and Ce are the concentrations of the copper ions
adsorbed at equilibrium (mg/g) and left in solution, respectively. qm is the maximum monolayer adsorption
capacity (mg/g) and KL is the Langmuir isotherm constant
related to the free energy (L/mg). The separation factor (RL)
in Eq. (3) is the equilibrium parameter which determines whether the model is favorable or not [9].
m L L
q
K
R
+
=
1
1
(3) The Freundlich isotherm model is represented by Eq. (4).
e F
e
C
n
K
q
ln
1
ln
ln
=
+
(4) Where KF is the Freundlich isotherm constant relatedadsorption capacity and 1/n < 1 and 1/n >1 implies that the adsorption process is favorable and not favorable, respectively [9].
The Dubinin-Redushkevich (D-R) isotherm model is described by Eq. (5).
ln q
e= ln q
m– βε
2 (5)Where qe is the amount of copper ions adsorbed (mol/L), qm
is the monolayer adsorption capacity (mol/g), β is the activating coefficient which is related to the mean adsorption energy (mol2/J2),
ε
is the Polanyi potential, and Eqs. (6) and(7) are used to calculate ε and the mean energy (E) of the adsorption process, respectively.
+
=
e
C
RT
ln
1
1
(6)
2
1
−
=
E
(7)TABLEIII
LANGMUIR,FREUNDLICH AND D-R ISOTHERM FACTORS FOR THE ADSORPTION OF COPER IONS ONTO THE ACTIVATED CARBON
WPAC WTAC
___________________________________________________________ LANGMUIR
QM (MG/G) 25.71 65.36 KL (L/MG) 0.026 0.066 R2 0.713 0.712
RL 0.073 0.130 FREUNDLICH
KF 8.051 10.05 1/N 0.268 0.423
R2 0.740 0.810 DUBININ-REDUSHKEVICH
QS(MOL/G) 21.83 48.73 E(KJ/MOL) 78.57 55.00 R2 0.740 0.710
[image:4.595.53.289.101.223.2]Figs. 7, 8 and 9 show the Langmuir, Freundlich, and D-R isotherm plots for the adsorption of the copper ions onto the WTAC and WPAC, respectively. Freundlich isotherm model showed the best fit for the experimental data achieving correlation coefficient 0.816 and 0.741 for the adsorption of copper ions into WTAC and WPAC, respectively. This implies that the adsorption of copper ions onto WTAC and WPAC is not restricted to monolayer coverage of the adsorbent onto the surface of the adsorbate and that the interaction between the adsorbents.
Fig. 7. Langmuir adsorption isotherm plot for the adsorption of copper ions onto WTAC and WPAC
[image:4.595.304.541.544.696.2]Fig. 9. Dubinin-Radushkevich adsorption isotherm plot for the adsorption of copper ions onto WTAC and WTPC
The values of 1/n were found to be 0.425 and 0.268 for the adsorption of copper ions onto WTAC and WPAC, respectively and this indicates that the adsorption process was favorable. The correlation coefficient obtained for the D-R isotherm model was 0.718 and 0.740 for the adsorption of copper ions onto WTAC and WPAC, respectively. The values calculated in Table 3 for the adsorption of copper ions onto WTAC and WTPC suggests that the adsorption process taking place is physical adsorption since the mean energies of adsorption is in the range of 16 kJ/mol < E < 80 kJ/mol.
B.7. Adsorption kinetics
TABLEIV
ADSORPTION KINETICS FOR THE ADSORPTION OF COPPER IONS ONTO WTAC
AND WTPC
WTPC WTAC ___________________________________________________________ PSEUDO-FIRST ORDER
KI (MIN-1) 0.0544 0.0353 R2
0.9829 0.9937 PSEUDO-SECOND ORDER
K2(G/MG.MIN) 0.0030 3.35E-4 R2 0.9659 0.9763
INTRAPARTICLE DIFFUSION
Q1(MG/G.M1/2) 1.6227 4.7705
C 5.1500 0.7127 R2 0.7879 0.9447
The pseudo-first order kinetic model is expressed by Eq. 8.
ln
(q
e-q
t) =
ln
q
e-k
1t (8)
Where Kt is the pseudo-first order rate constant of the
reaction (m-1). From the Table 4 it is visible that the
pseudo-first order kinetic model obtained the highest correlation coefficient for the adsorption of copper ions onto WTPC and WTAC as R2 = 0.9829 and R2 = 0.9937, respectively which
suggests that the adsorption of copper ions onto WTAC is best described by the pseudo-first order kinetic model. Ho’s pseudo-second kinetic model in Fig. 10 suggests that the rate limiting step is controlled by chemical adsorption which involves violent forces comprised of the sharing of electrons or the exchange of electrons between the adsorbent and the adsorbate. Ho’s pseudo-second order kinetic model is described by Eq. (9).
e
e
q
t
q
k
t
q
+
=
22
1
(9)
Where k2 is the pseudo-second order reaction rate constant.
The correlation coefficients obtained for the pseudo-second
order kinetic model were lower than those obtained under pseudo-first order kinetic model which suggests that the process is not controlled by chemical adsorption.
Fig. 10. Lagergren’s pseudo-first order kinetic model plot for the adsorption of copper ions onto waste tire activated carbon
Fig. 11. Ho’s pseudo-second order kinetic model plot for the adsorption of copper ions onto waste tire activated carbon
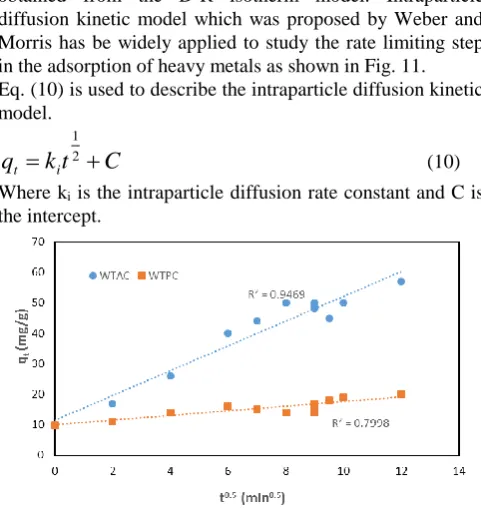
The findings are in excellent agreement with the results obtained from the D-R isotherm model. Intraparticle diffusion kinetic model which was proposed by Weber and Morris has be widely applied to study the rate limiting step in the adsorption of heavy metals as shown in Fig. 11. Eq. (10) is used to describe the intraparticle diffusion kinetic model.
C
t
k
q
t=
i+
2 1
(10) Where ki is the intraparticle diffusion rate constant and C is
[image:5.595.45.287.48.175.2]the intercept.
Fig. 12. Weber and Morris intraparticle diffusion kinetic model plot for the adsorption of copper ions onto waste tire activated carbon
[image:5.595.313.545.90.228.2] [image:5.595.306.547.449.706.2]intraparticle diffusion is not the sole rate limiting step but it might be accompanied by film diffusion.
B.8. Adsorption Thermodynamics
Adsorption thermodynamics were evaluated to determine the adsorption of copper ions onto WTAC and WTPC. Thermodynamic parameters such as the enthalpy change (∆H°) Gibbs free energy change (∆G°) and entropy change (∆S°) were determined by Eqs. (11), (12) and (13).
D
K
RT
G
=
−
ln
(11)R
s
RT
H
K
D
+
−
=
ln
(12)
e e D
c
q
K
=
(13) Where KD is the distribution coefficient or equilibrium
constant which is dependent on temperature. The values of (∆H°) and (∆S°) were calculated as shown in Table 5.
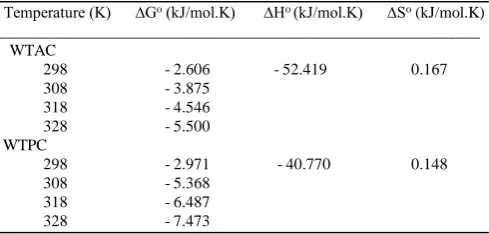
TABLEV
THERMODYNAMIC PARAMETERS FOR THE ADSORPTION OF COPPER IONS ONTO THE ACTIVATED CARBON
Temperature (K) ∆Go (kJ/mol.K) ∆Ho (kJ/mol.K) ∆So (kJ/mol.K)
___________________________________________________________
WTAC
298 -2.606 -52.419 0.167
308 -3.875 318 -4.546
328 -5.500 WTPC
298 -2.971 -40.770 0.148
308 -5.368
318 -6.487
328 -7.473
The negative value of (∆H°) shows that the adsorption process is exothermic in nature. The positive value of (∆S°) indicates the solid solution interface during the adsorption process.
Fig. 13. Plot of ln KD vs 1/T for the estimation of adsorption
thermodynamic parameters for the adsorption of copper ions onto waste tire activated carbon
The negative value of (∆G°) indicates that the process is spontaneous. The decrease in the values of (∆G°) with increase in temperature indicates that the adsorption process is favored at higher temperature [10]. From the adsorption of copper ions onto WTPC, the values of adsorption thermodynamics parameters (∆H°), (∆S°) and (∆G°) at 298K are tabulated in Table 5 and were calculated to be -40.77 kJ/mol.K , 0.148 KJ/mol.K and 2.971 kJ/mol.K, respectively.
IV. CONCLUSION
Activated carbon was prepared by chemical activation with KOH from waste tire char. SEM analysis shows that chemically activating the waste tire char with KOH improved the surface morphology of the activated carbon. The proximate analysis performed on the activated carbon showed a decrease in the volatile and ash content of the activated carbon produced compared to the waste tire char. XRF analysis further confirmed that activating the waste tire char with KOH produces an activated carbon with decreased amounts of inorganic matter. The adsorption parameters such as adsorbent dosage, pH, contact time, initial metal concentration and temperature were studied to investigate the removal of copper ions from aqueous solution. Adsorption isotherm models were studied and the equilibrium data was best fitted by the Freundlich isotherm model implying that the adsorption of copper ions is not restricted to monolayer coverage of the adsorbate onto the surface of the adsorbent but instead multilayer coverage of the copper ions onto the activated carbon is possible. Adsorption kinetics were evaluated to determine the rate step for the adsorption of copper ions onto WTAC and pseudo-first order kinetic model gave the best fit. Lastly the thermodynamic parameters showed that the process was exothermic, spontaneous and randomness in nature.
REFERENCES
[1] A. Sajeda, Al-Saydeh, H Maftah El-Naas & I Syed Zaidi. “Copper removal from industrial wastewater: A Comprehensive review”. J. Ind. Eng. Chemistry. 2017, 56, 35-44.
[2] S. A Abdulkareem, E. Muzenda, A.S. Afolabi & J. Kabuba. “Treatment of Clinopilolite as an Adsorbent for the Removal of Copper ion from Synthetic Wastewater solution”. Arab. J. Sci. Eng. 2013, 38, 2263-2272.
[3] H. Hu, X Li, P. Huang, Q. Zhang & W. Yuan. “Efficient removal of copper from wastewater by using mechanically activated calcium carbonate”. J. Environ. Management. 2017, 203, 1-7.
[4] J. Kabuba, A. Mulaba-Bafubiandi & K. Battle. “Neural Network Technique for Modeling of Cu (II) Removal from Aqueous Solution by Clinoptilolite”. Arab. J. Sci. Eng. 2014, 39, 6793-6803.
[5] H. Liu, S. Feng, N. Zhang, X. Du & Y. Liu. “Removal of Cu (II) ions from aqueous solution by activated carbon impregnated with humic acid”. Frontiers Environ. Sc. Eng. 2017, 8, 329-336.
[6] A. Nayak, B. Bhushan, V. Gupta & P. Sharma. “Chemically activated carbon from lignocellulose wastes for heavy metal wastewater remediation: effect of activation conditions”. J. Colloid Interface Sc., 2017, 493, 228-240.
[7] J. Sahu, J. Acharya, B. Sahoo & B. Meikap. “Optimization of lead (II) sorption potential using developed activated carbon from tamarind with chemical activated by zinc chloride”. Desalination and Water Treatment. 2016, 57, 2006- 2017.
[8] F. López, T. Centeno, O. Rodríguez, O & F.J. Alguacil. “Preparation and characterization of activated carbon from the char produced in the thermolysis of granulated scrap tyres”. J. Air and Waste Management Association. 2013. 63, 534-544.
[9] I. A.W. Tan, J. C. Chan, B. H. Hameed & I. I. P. Lim “Adsorption behaviour of cadmium ions onto phosphoric acid-impregnated microwave-induced mesoporous activated carbon”. J. Water Process Eng. 2016, 14, 60-70.
[image:6.595.47.292.313.430.2]