21 http://aajhss.org/index.php/ijhss International Journal of Humanities and Social Sciences p-ISSN: 1694-2620 e-ISSN: 1694-2639 Vol. 8 No. 3, pp. 21-30, ©IJHSS
Influence of students’ self perception on biology
achievement among secondary school students in Nakuru
county, Kenya
Nyambura Rose
Department of Curriculum and Educational Management Laikipia University, Kenya.
Abstract
Acquisition of biology knowledge and skills at Kenya’s secondary school is measured by administration of tests especially at national level. Achievement in biology has not been satisfactory in Kenya Certificate of Secondary Education examination (KCSE) and scholars have fronted various reasons that contribute to this unsatisfactory achievement. The factors include students’ negative attitude towards the subject, lack of teaching/learning resources and inadequate staffing. Researchers have also investigated students’ entry behavior which varies from individual to individual and so do learning outcomes. Irrespective of entry behavior, when meaningful learning takes place, the expectation is improved academic achievement. However this is not always the case and this study aimed at assessing the impact of students’ self perception on achievement in biology. This study was guided by self perception theory (SPT) and adopted ex-post facto research design. Random sampling was used to select a sample size of 390 Form three students from three randomly selected secondary schools in Nakuru County, Kenya. The data was collected by use of a questionnaire (Students’ questionnaire). The data collected was coded, categorized and then analyzed using descriptive and inferential statistics with the help of statistical package for social sciences (SPSS) version 22.0. Null hypothesis were tested at .05 significance level. The Study findings showed that students had positive self perception which had no statistical significant influence on biology achievement among students in Nakuru County, Kenya.
Key words; Self Perception, Biology Achievement, Science Education and Millennium Development Goals (MDG’S).
Introduction
22 http://aajhss.org/index.php/ijhss
impacted on overall achievement in biology in the Kenya Certificate of Secondary Education Examination (K.C.S.E) and at Nakuru county level as shown in Table 1.
Table 1
KCSE Biology Achievement Scores between 2011 and 2013 at National and County level.
Year National Nakuru County Mean Score (%) Mean score (%) 2011 32.42 35.5
2012 31.6 38.2 2013 32.3 38.3
Source: KNEC Examination Report 2014); Nakuru County Education day booklet (2012-2014).
Table 1 shows that Nakuru county KCSE biology achievement scores are higher than national scores. However both scores are far below 50% meaning low achievement in biology which triggers concern among educationists. If all counties in Kenya explore various options of boosting achievement in biology like adopting measures that enhance students’ self perception, then the national biology average score might go up. This study explored the influence of self perception on form three students’ achievement in continuous assessment tests in biology from randomly selected secondary schools in Nakuru county. The scores used were form three end of term one, term two and term three biology continuous assessment test scores.
Biology knowledge is a pre-requisite for national development as highlighted in Kenya’s blue print for development -Vision 2030. Samikwo (2013) highlighted that Kenya is lagging behind in its development agenda and such developments require workforce that achieves highly in science subjects like biology. Biology knowledge contributes in new discoveries for example in the field of medicine, population control, food security, pollution control and sustainable utilization of natural resources. Biological knowledge is also necessary to ensure natural resources are in sufficient replenishment and supply (Ongowo & Hungi, 2014).
Kenya made primary and secondary education free in 2003 and 2008 respectively. The country aimed at meeting the objectives of education for all (EFA) by the year 2015 and millennium development goals (MDG’S). However, recent studies indicate that most developing countries including Kenya are far from achieving MDG’S (Murunga, Kilaha and Wanyonyi, 2013). This necessitates acquiring of adequate biological knowledge by the students and subsequent utilization of the acquired skills so as to be in a position to participate fully in scientific development.
23 http://aajhss.org/index.php/ijhss
Self perception theory (SPT) developed by Daryl Bem in 1965 postulates that people induce
attitudes without accessing internal cognition and mood. However, Weiner (1999) observed that teenagers consciously or subconsciously look inward at themselves and weigh whether other peoples’ thoughts, attitudes, actions and reactions will work for them until they begin to see themselves in their own way. Self perception therefore may vary from time to time impacting on academic achievement. SPT sufficiently guided this study which aimed at finding out the influence of students’ self perception on achievement in biology among secondary school students in Nakuru County, Kenya.
STATEMENT OF THE PROBLEM
Relationship between self-perception and academic achievement is well established in literature but little research has been done on the topic in Kenya especially in secondary schools within Nakuru county. This study therefore aimed at making a contribution towards filling this gap. To this end the study examined the relationship between students’ self perception and achievement in biology among students in secondary school in Nakuru county.
Objectives of the study
1. To determine if there is a relationship between students’ self perception and achievement in biology among secondary school students in Nakuru county
2. To find out if there is a difference in self perception among male and female students in secondary schools in Nakuru county.
3. To investigate if there is a difference in biology achievement among male and female secondary school students in Nakuru county
Null Hypotheses
1. There is no statistically significant relationship between students’ self perception and achievement in biology among secondary school students in Nakuru county
2. There is no statistically significant difference in self perception among male and female students in secondary schools in Nakuru county.
3. There is no statistically significant difference in biology achievement among male and female secondary school students in Nakuru county
METHODOLOGY
Design
This study was guided by self perception theory (SPT) and adopted ex-post facto research design which is applied in those studies where the independent variables have interacted with dependent variables. Consequently, the effect of interaction between the variables is determined retrospectively (Kerlinger, 2002).
Participants
24 http://aajhss.org/index.php/ijhss Data collection and analysis
Data was collected by use of students’ questionnaire (SQ). The instrument was pilot tested in one secondary school in neighbouring Nyandarua county to test reliability. Cronbach’s alpha was used to assess whether items in the instrument measured students’ perception. An alpha level of at least .70 was accepted and considered suitable to make possible group inferences that are accurate enough (Orodho, 2008).
The researcher administered the questionnaire to the study sample and collected it immediately the participants completed filling in the required information. The items were scored, coded and analysed using SPSS version 22.0.
Results and discussion
Self perception among students
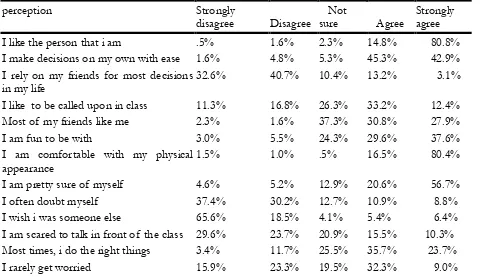
[image:4.612.70.551.437.714.2]It was found out that most students have a positive self perception since they agree and strongly agree with positive statement on self perception and disagree and strongly disagree on negative constructed statements. Majority of the students like the person they are (96%), make decisions on their own (88%), are comfortable with their physical appearance (97%), pretty sure of themselves (78%) and always do the right things (93%). Moreover the students are not scared to talk in front of the class (53%), are not clumsy (59%) and are very agreeable (59%). In addition, 47% of the students are not sure whether their classmates like them a lot while 25% are not sure whether most times they do the right things. These findings are shown in the table 2 below
Table 2
Self perception percentages among students
perception Strongly
disagree
Disagree
Not
sure Agree
Strongly agree I like the person that i am .5% 1.6% 2.3% 14.8% 80.8% I make decisions on my own with ease 1.6% 4.8% 5.3% 45.3% 42.9% I rely on my friends for most decisions
in my life
32.6% 40.7% 10.4% 13.2% 3.1%
I like to be called upon in class 11.3% 16.8% 26.3% 33.2% 12.4% Most of my friends like me 2.3% 1.6% 37.3% 30.8% 27.9%
I am fun to be with 3.0% 5.5% 24.3% 29.6% 37.6%
I am comfortable with my physical
appearance 1.5% 1.0% .5% 16.5% 80.4%
I am pretty sure of myself 4.6% 5.2% 12.9% 20.6% 56.7%
I often doubt myself 37.4% 30.2% 12.7% 10.9% 8.8%
I wish i was someone else 65.6% 18.5% 4.1% 5.4% 6.4% I am scared to talk in front of the class 29.6% 23.7% 20.9% 15.5% 10.3% Most times, i do the right things 3.4% 11.7% 25.5% 35.7% 23.7%
25 http://aajhss.org/index.php/ijhss
My classmates like me a lot 1.8% 2.6% 47.4% 30.7% 17.5% I can solve most problems in my life 3.1% 10.8% 17.5% 34.5% 34.0% I rarely disagree with people around me 8.7% 25.9% 20.0% 31.5% 13.8%
I am a clumsy person 35.1% 24.1% 25.7% 4.2% 11.0%
I would never change a thing about
myself 13.9% 21.6% 11.3% 11.3% 41.8%
I always try to do the right things 1.0% 1.5% 4.4% 39.7% 53.3% I take long to adapt to something new 13.3% 26.3% 9.6% 32.3% 18.5% i am often sorry for the things i do 9.5% 18.8% 18.3% 34.0% 19.3%
I am unattractive 52.3% 26.2% 13.0% 2.8% 5.7%
I have no problem expressing my opinion
3.1% 9.6% 19.5% 21.4% 46.4%
I am very agreeable person 3.9% 14.8% 22.3% 35.6% 23.4%
Self perception and biology achievement
[image:5.612.70.540.74.283.2]The Average continuous assessment marks in biology year 2015 per student were calculated by getting the mean marks of individual scores in biology in the three school terms of the year. For the 390 students, the mean average marks in biology year 2015 is 28.08% with a standard deviation of 11.372% and a range between 8% and 69%. This is illustrated in the table 3.
Table 3
Average marks in biology year 2015 Number
of
students Minimum mark Maximum mark Mean Std. Deviation
390 8 69 28.08 11.372
Self perception was computed as a variable using median as measure of central tendency in the likert scale where values were assigned as follows; 1=Strongly Disagree 2=Disagree 3= Not Sure 4=Agree 5=Strongly Disagree. The study reveals that majority (51%) of students agreed upon the statements about their self perception whereas 39% of the respondents were not sure of their self perception. The Percentages of computed self perception 4-5 does indicate a clear trend of either decrease or increase of positive self perception with average marks in biology. This is as shown in the table 4. However A chi square test gives a p-value = 1.635 at ∞ = 0.05 level of confidence i.e. p-value = 1.635 > 0.05 the null hypotheses is not rejected therefore, no statistically significant relationship between students’ self perception and achievement in biology among secondary school students in Nakuru county
Table 4
[image:5.612.73.360.382.450.2]26 http://aajhss.org/index.php/ijhss
Average biology marks
2.00 2.50 3.00 3.50 4.00 4.50 5.00
Percentages of computed self
perception 4-5
Less than 20 21-30 31-40 41-50 51-60
61 and above Total
0 0 26 13 66 0 2 107 63.5 0 0 65 2 76 4 12 159 57.8 2 0 33 2 29 0 2 68 45.6 0 2 12 4 14 2 2 36 50 0 0 4 0 6 0 0 10 60 0 0 8 0 2 0 0 10 20 2 2 148 21 193 6 18 390
A two tailed test on Pearson correlation between self perception and average marks in biology shows that there exist a very weak positive correlation of +0.023.
Gender difference in self perception
[image:6.612.74.414.69.284.2]A two tailed test on Pearson correlation between self perception and gender shows that there exist a very weak positive correlation of +0.042 almost zero to show that there is no relationship. More males than females have a positive self perception as shown by 70% and 40% respectively in the table 5.
Table 5
Gender* Computed self perception cross tabulation Computed self perception
Total
Percentages of computed self perception 4-5 2.00 2.50 3.00 3.50 4.00 4.50 5.00
Sex Female 0 0 50 4 113 6 8 181 70.16 Male 2 2 98 17 80 0 10 209 43.06 Total 2 2 148 21 193 6 18 390
However A chi square test gives a p-value = 1.635 at ∞ = 0.05 level of confidence , p-value = 1.635 > 0.05 thus the null hypotheses retained. There is no statistically significant difference in self perception among male and female students in secondary schools in Nakuru county
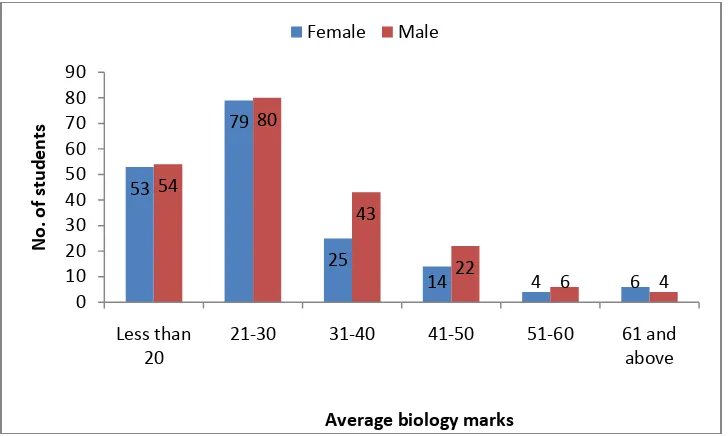
Gender difference in biology achievement
27 http://aajhss.org/index.php/ijhss Figure 1: Gender difference in biology achievement
A two tailed test on Pearson correlation between self perception and gender shows that there exist a very positive correlation of +0.412. A chi square test gives a p-value = 0.831 at ∞ = 0.05 level of confidence i.e. p-value = 0.831 > 0.05 null hypothesis is retained, thus there is no statistically significant gender difference in biology achievement among students in secondary schools in Nakuru county.
Conclusions
Self perception among students is positive. Students can make decisions on their own and always do the right things. Moreover students are neither clumsy nor scared to talk in front of the class a show of self confidence. The self perception perspective that people derive their inner feelings or abilities from external behaviors was noted. However students self perception does not affect their performance in biology as per the findings of the study. Performance may be attributed to other factors for example entry behavior and negative attitude towards biology. The sex of the students had a significance influence on self perception as self perception is portrayed to vary with gender. A greater percentage of female students as compared to males score more computed self perception. Performance in biology subject does not significantly differ with the gender of the student since both mean marks of males and females students in biology coincides with the class mean mark..
Further research is recommended to find out the cause/s of low achievement in biology both at county level and national level among secondary school students in Nakuru county, Kenya.
References
Kathuri, N. J & Pals, D. A (1993). Introduction to research. Educational material center, Egerton University.
Kenya National Examination Council. (2012). The Year 2009 Kenya certificate of secondary examination report. Nairobi; Government Printers
Kenya National Examination Council. (2013). The Year 2010 Kenya certificate of secondary examination report. Nairobi; Government Printers
Kenya National Examination Council. (2014). The Year 2011 Kenya certificate of secondary examination report. Nairobi; Government Printers
53
79
25
14 4 6
54
80
43
22
6 4
0 10 20 30 40 50 60 70 80 90
Less than 20
21-30 31-40 41-50 51-60 61 and
above
N
o
. o
f stu
d
e
n
ts
Average biology marks
28 http://aajhss.org/index.php/ijhss
Keraro, F. N & Shihusa, H (2005). Effects Of Advance Organizers On Students\' Achievement In Biology: A Case Study Of Bureti District, Kenya Journal of Technology and Education in Nigeria Vol. 10 (2) 2005: pp. 1-9 Retrieved from web on September 6, 2015. http://dx.doi.org/10.4314/joten.v10i2.35709
Kerlinger, F. N. (2002). Foundations of Behavioural Research. New York: Holt Reinhart and Winston. Inc
Murunga F, Kilaha K, Wanyonyi D (2013). Emerging Issues in Secondary School Education in Kenya. Int. J. Adv. Res. 1(3):231-240.
Orodho, A. J. (2008). Techniques of writing research proposals and reports in education and social sciences. Nairobi; Kenyatta University.
Ongowo, R. O., & Hungi, S. K. (2014). Motivational Beliefs and Self-Regulation in Biology Learning: Influence of Ethnicity, Gender and Grade Level in Kenya. Creative Education, 2014, 5, 218-227. Retrieved from web on September 9, 2015
Prokop, P., Prokop, M & Tunicliffe, S. D (2007). Is biology boring? Student attitude towards biology. Journal of biological education vol 42 issue.
Samikwo, Dinah C (2013). Factors which influence academic performance in biology in kenya: a perspective for global competitiveness. International Journal of Current Research Vol. 5, Issue, 12, pp.4296-4300, ISSN: 0975-833X . Retrieved from web on September 6, 2015. http:/www.journalcra.com
Tang, M., & Neber, H. (2008). Motivation and Self-Regulated Science Learning in High Achieving Students: Differences Related to Nation, Gender and Grade Level. High Ability Studies, 19, 103-116. Retrieved from web on September 16, 2015.
http://dx.doi.org/10.1080/13598130802503959
Weiner, V (1999). Winning the war against youth gangs. Greenwood publishing group press.
STUDENTS’ QUESTIONNAIRE (SQ)
This study aims at finding out the influence of self perception and academic self concept on achievement in Biology among secondary school students. Please fill in the questionnaire and the information collected will be used for academic purposes only.
SECTION A; SUDENTS’ BIODATA
1. Sex : Female Male 2. Age in years:
3. KCPE Marks: 4. Class
SECTION B: STUDENTS’ SELF PERCEPTION
Please tick the statement which describes how you feel about yourself according to the scale given. There is no right or wrong answers to these statements.
Statement Strongly
Agree Agree Not sure Disagree Strongly disagree
1.I like the person that I am
29 http://aajhss.org/index.php/ijhss
3.I rely on my friends for most decisions in my life
4.I like to be called upon in class 5.Most of my friends like me 6.I am fun to be with
7.I am comfortable with my physical appearance
8.I am pretty sure of myself 9.I often doubt myself 10.I wish I was someone else
11.I am scared to talk in front of class 12.Most times, I do the right things 13.I rarely get worried
14.My classmates like me a lot
15. I can solve most problems in my life 16.I rarely disagree with people around me 17. I am a clumsy person
18.I would never change a thing about myself
19.I always try to do the right things 20.I take long to adapt to something new 21.I am often sorry for the things I do 22.I am unattractive
23.I have no problem expressing my opinion
24.I am a very agreeable person
SECTION C: SELF ACADEMIC CONCEPT ASSESMENT
Please tick the statement which describes how you feel about academics according to the scale given. There is no right or wrong answers to these statements, so feel free to answer.
STATEMENT Definitely
true
True Not Sure
Not true
Definitely not true 1.I am a hard working student at school
30 http://aajhss.org/index.php/ijhss
4.I spend most of my time doing my school work
5.I enjoy participating in class activities 6.I often lead my classmates in tasks assigned by our teacher
7.My peers often consult me in class assignments
8.I am happy with my academic achievements
9. I can never achieve highly in biology 10.I learn most concepts in biology very fast
11.I have trouble with most school subjects
12.I often need help in most school subjects
13.I enjoy studying biology 14.I get good marks in biology 15.I don’t like most school subjects
16.I often look forward to biology lessons 17.I often need help in most school subjects
18. I really feel good about my achievement in most school subjects 19.I hope to excel in my study
20. My grades in biology and all other subjective will secure for me a position in university
21.I am well aware of my future profession
22.I have trouble understanding anything in biology
23.Biology is the easiest subject in biology 24.Biology is my favourite subject
25.I never want to continue studying biology after secondary school