Detection of Amplifiable mRNA Extracellular to
Insulin-Producing Cells: Potential for Predicting
Beta Cell Mass and Function
Sweta Rani, Martin Clynes,
and
Lorraine O’Driscoll
*Background:Detecting extracellular nucleic acids in the serum/plasma of cancer patients may help in cancer diag-nosis. We investigated whether extracellular mRNAs are reproducibly detectable in conditioned medium (CM) from insulin-producing cell cultures and if their presence and amounts are indicative of cell number and/or function.
Methods: We isolated mRNA from medium
condi-tioned by the culture of several insulin-producing cell types: MIN6(L) responsive), MIN6(H) (glucose-nonresponsive), and MIN6 B1 murine beta cells and monkey kidney fibroblast cells engineered to produce human preproinsulin (PPI) (Vero-PPI). We used reverse transcription–PCR analyses to evaluate the occurrence of several mRNAs and investigated whether the pres-ence and amounts of the various extracellular mRNAs are associated with cell mass and/or function.
Results: Reproducible amplification of mRNAs
en-coded by Pdx1, Npy, Egr1, Pld1, Chgb, Ins1, Ins2, and Actbfrom MIN6(L), MIN6(H), and MIN6 B1 cells and their CM suggests that beta cells transcribe and release these mRNAs into their culture environment. Similarly, PPI mRNA was detected in samples of Vero-PPI cells and CM. The amounts of some mRNAs reflected the numbers and functional status (i.e., glucose responsive-ness vs nonresponsiveresponsive-ness) of the cells conditioning the medium. Although Pax4 mRNA was detected in the MIN6 B1 cell line, the fact that this transcript was not amplifiable from the corresponding CM suggested that mRNA release was selective.
Conclusion: mRNAs may be secreted from
insulin-producing cells, are reproducibly detected in the cellular environment, and may have potential as extra-cellular biomarkers for assessing beta cell mass and function.
© 2007 American Association for Clinical Chemistry
Diabetes currently affects 246 million people worldwide and will affect 380 million by 2025(1 ). Type 1 diabetes is characterized by autoimmune destruction of the insulin-producing beta cells in the islet of Langerhans of the pancreas, whereas type 2 diabetes is associated with reduced beta cell mass and function, as well as with insulin resistance. No panel of circulating biomarkers of beta cell mass and/or function has been reported. Because type 1 diabetes is usually diagnosed after a loss of 70%– 80% of the insulin-secreting beta cells in the pan-creas (2 ), detecting an association of gene expression in the circulating serum with beta cell loss and/or function may aid in early disease detection.
Nucleic acids were first detected in plasma almost 60 years ago(3 ), and with the recent advances in sensitive and specific analytical techniques, the detection of nucleic acids now has potential as a tool for early diagnosis of disease. Extracellular RNA has been detected in the plasma and serum of patients with various forms of cancer(4 – 6 ), DNA and mRNA of fetal origin have been discovered in the plasma of pregnant women (7–9 ), and significantly increased concentrations of rhodopsin mRNA have been found in the peripheral blood of individuals with diabetes(10 ). Although RNA biomark-ers indicative of pancreas beta cell mass and function may circulate in diabetic patients, no studies have yet investi-gated this possibility. We previously reported methods for detecting mRNAs extracellular to cancer cells(11 ). In an extension of this approach, we investigated whether extracellular mRNAs are reproducibly detectable in beta
National Institute for Cellular Biotechnology, Dublin City University, Dublin 9, Ireland.
* Address correspondence to this author at: National Institute for Cellular Biotechnology, Dublin City University, Dublin 9, Ireland. Fax 353-1-7005484; e-mail [email protected].
Received February 21, 2007; accepted August 7, 2007.
Previously published online at DOI: 10.1373/clinchem.2007.087973
cell– conditioned medium (CM)1and whether the
concen-trations of such mRNAs are associated with beta cell number and/or function.
Material and Methods
cell culture
MIN6 B1 cells.MIN6 B1 cells (generously donated by Dr. Valeria Lilla, Louis-Jeantet Research Laboratories, Univer-sity Medical Center, Geneva, Switzerland) at passage p21 were cultured in DMEM with 150 mL/L heat-inactivated (56 °C for 1 h) fetal calf serum, 10 g/Ll-glutamine, and 75
mol/L-mercaptoethanol(12 )and grown at 37 °C in air containing 5% CO2. Cells were counted by microscopy
with the aid of a hemocytometer and seeded at 1⫻106,
5⫻106, and 1⫻107cells per 4 mL of culture medium in
T25cm2 cell culture flasks (Corning) and incubated for
48 h. Biological assays were replicated 3 times.
Vero-PPI cells.Vero-PPI cells are monkey kidney fibroblast cells engineered to produce human preproinsulin (PPI)
(13 ). These cells (passage p159) were cultured in modified Eagle medium with 5.6 mol/L glucose and 10 g/L non-essential amino acids (Gibco) and grown at 37 °C in air containing 5% CO2. Vero-PPI cells were seeded in T25cm2
flasks at the same range of densities as for MIN6 B1 cells (i.e., 1⫻106, 5⫻106, and 1⫻107cells per 4 mL culture
medium) and incubated for 48 h. Again, assays were replicated 3 times.
MIN6 cells. MIN6(L) cells (passage 18) and MIN6(H) (passage 40) cells were established from MIN6 (gener-ously donated by Dr. Per Bendix Jeppesen, Arhus Univer-sity Hospital, Denmark, with permission from Dr. K. Yamamura, Kumamoto University School of Medicine, Kumamoto, Japan) to be glucose responsive (L) and nonresponsive (H), respectively. Cells were cultured in DMEM containing 25 mmol/L glucose and 200 mL/L heat-inactivated fetal calf serum and grown at 37 °C in air containing 5% CO2. To investigate extracellular mRNAs
associated with beta cell function (i.e., glucose responsive-ness), we seeded these cells in triplicate in T75cm2flasks
at 2⫻106cells/8 mL of culture medium(14 ). Cells were
grown to approximately 80% confluence and refed every 3 days. To condition medium for analysis, we added 8 mL fresh medium for another 48 h (by which time the cells had reached approximately 90% confluence).
filtration of cm from insulin-producing cells
We passed medium that had been conditioned by cell culture for 48 h as described above through a 0.45-m filter to ensure that no cells were present. We added 250-L aliquots of filtered CM to 750L of TRI Reagent (Sigma-Aldrich) and incubated the aliquots at room tem-perature for 5–10 min to completely dissociate nucleopro-tein complexes. Aliquots were stored at – 80 °C until RNA extraction and analysis. The corresponding cells from the flasks were trypsinized and centrifuged at 163gfor 5 min. The pellets were washed twice with cold PBS (sodium chloride 8 g/L, potassium chloride 0.2 g/L, di-sodium hydrogen phosphate 1.15 g/L, potassium dihydrogen phosphate 0.2 g/L, pH 7.3 at 25 °C; Oxoid) resuspended in 1 mL TRI Reagent, incubated as described above, and stored at – 80 °C.
isolation of rna from cm and cells
RNA was isolated from CM and cells stored in TRI Reagent as previously described(11 ).
DNasetreatment of rna
To remove any contaminating genomic DNA from RNA isolates, we treated cell and CM samples with 1 U RNase-free DNase (Promega) per 1 g RNA in a 10-L reaction mixture including reaction buffer [supplied as 10⫻– 400 mmol/L Tris (pH 8.0), 100 mmol/L MgSO4, 10
mmol/L CaCl2; Promega]. After incubation at 37 °C for 30
min, we inactivated the DNase by adding 1 L DNase Stop Solution (20 mmol/L EGTA (pH 8.0); Promega) to the reaction mixture and incubating it at 65 °C for 10 min.
RNasetreatment of rna
To establish that reverse transcription–PCR (RT-PCR) signals were from RNA and not from contaminating DNA, we treated isolated samples with 1 U RNase ONE Ribonuclease (Promega) per 0.1 g RNA in a 10-L reaction mixture containing buffer [supplied as 10x – 100 mmol/L Tris-HCl (pH 7.5 at 25 °C), 50 mmol/L EDTA, 2 mol/L sodium acetate; Promega] and incubated the mix-ture at 37 °C for 30 min.
rt-pcr analysis
We used 1L of 500-mg/L oligo(dT) primers (MWG) for 1st-strand cDNA synthesis on 1 g RNA from cultured cells and 4 L of the RNA suspension from CM. After incubation at 72 °C for 10 min, we incubated this mixture further at 37 °C for 1 h in a reaction mixture containing 40⫻106U/L human RNase inhibitor (Sigma-Aldrich), 10
mmol/L of each deoxynucleoside triphosphate (Sigma-Aldrich), 200⫻106U/L Moloney murine leukemia virus
(MMLV) reverse transcriptase (Sigma-Aldrich), 10⫻ re-verse transcriptase buffer; 500 mmol/L Tris-HCl (pH 8.3), 500 mmol/L KCl, 30 mmol/L MgCl2, 50 mmol/L DTT),
and diethylpyrocarbonate-treated water to a 15-L final volume. cDNAs (2.5L) from CM and cells were ampli-fied in a 25-L PCR reaction solution containing 1.5
1Nonstandard abbreviations: CM, conditioned medium; PPI,
mmol/L MgCl2, 0.2 mmol/L of each deoxynucleoside
triphosphate, 20mol/L oligonucleotide primers, and 2.5 U Taq polymerase (Sigma-Aldrich). See Table 1 in the Data Supplement that accompanies the online version of this article at http://www.clinchem.org/content/vol53/ issue11 for sequences of the forward and reverse primers used for the analyzed gene transcripts. As indicated in Fig. 1 of the online Data Supplement, we investigated whether any detected mRNAs were likely to be full-length transcripts or fragmented products by designing PCR primers so as to amplify regions close to the 3⬘end (Pdx1, pancreatic and duodenal homeobox gene 1;Pld1, phospholipase D; INS,2 human insulin), the 5⬘ region
(Egr1, early growth response gene 1;Chgb, chromagranin B;Pax4, paired box transcription factor 4), or along most of the transcript length (Ins1, insulin 1; Ins2, insulin 2;
Npy, neuropeptide y). We also amplified 4 different regions of theActb(-actin) transcript. RT-PCR conditions were as follows: 95 °C for 2 min; 30 – 45 cycles of 95 °C for 30 s, 54 °C for 30 s, and 72 °C for 45 s; and a completion step of 72 °C for 10 min. We subsequently separated amplicons by electrophoresis on a 2% agarose gel in 1⫻ Tris-borate-EDTA; 10.8 g/L Tris base; 5.5g/L boric acid, 4 mL/L 0.5 mol/L EDTA (ph 8.0); buffer and stained the gel with ethidium bromide to assess cDNA amounts (reflect-ing mRNA). We used LabWorks Analysis Software (ver-sion 3.0; UVP) for densitometry analysis of the maximum absorbances of PCR products. We imported the results into Microsoft Excel and generated bar charts from the data.
Results
RNase- and DNase-treated rna samples
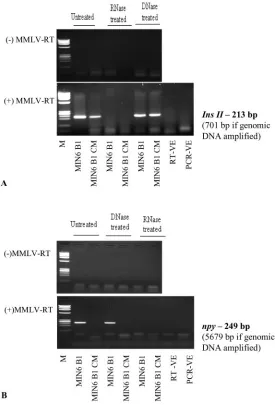
To investigate whether the RT-PCR products detected in cells and/or CM were of mRNA and not DNA origin, we treated aliquots of isolates with DNase (to destroy any contaminating DNA) or RNase (to destroy RNA, as a control), or the aliquots remained untreated. Reverse transcriptase reactions were subsequently performed be-fore the PCR and in parallel with reactions without MMLV reverse transcriptase. Examples of these results with MIN6 B1 cells and corresponding CM samples are shown in Fig. 1.
Reactions without reverse transcriptase produced no PCR products, regardless of whether the cell and CM isolates were untreated, treated with RNase, or treated with DNase. This result was the case for all the genes investigated (upper panels of Fig. 2, A and B, forIns2and
Npy, respectively). Including reverse transcriptase in the reaction, however, did yield amplicons from cell and CM isolates that were not treated with a digestive enzyme or were treated with DNase; however, we detected no PCR bands for samples treated with RNase (lower panels of
Fig. 2, A and B). These results indicate that the PCR products detected in cell and CM isolates are of mRNA and not DNA origin.
identifying a suitable time for cm collection and analysis
CM samples were collected at 4 time points (24, 48, 72, and 96 h) after seeding cells to identify a suitable time for routinely isolating amplifiable mRNA for analysis. In the case of relatively highly expressed genes such asActb, we were able to isolate and amplify mRNA at all 4 time points; however, for genes with lower expression (e.g.,
Egr1), we did not detect amplified product after 24 h, but only afterⱖ48 h of culture (results not shown). To ensure that all CM samples analyzed were from healthy prolif-erating cells, we conducted all subsequent analyses with media conditioned for 48 h.
mrna detection in cm: identifying a suitable pcr cycle number
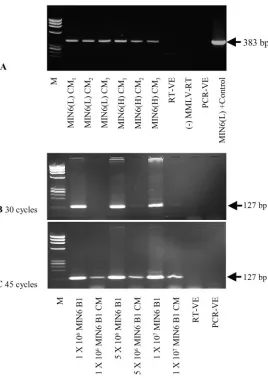
Transcripts were detected in all samples of media condi-tioned by the cell types included in this study [i.e., MIN6(L), MIN6(H), MIN6 B1, and Vero-PPI cell lines]. For example, see Fig. 1A for replicate results for theActb
amplicon in CM from MIN6(L) and MIN6(H) cell cultures.
Although 30 PCR cycles were adequate for analyses of transcripts isolated from cell lines, amplicon bands were often undetectable or of very low intensity after this number of PCR cycles with CM samples (e.g., Pdx1; Fig. 1B). Forty-five PCR cycles consistently produced a detect-able band from CM RNA samples (Fig. 1C), and we used 45 cycles in all subsequent analyses of gene transcripts in cell and CM samples.
cell density and correspondingmRNA concentrations
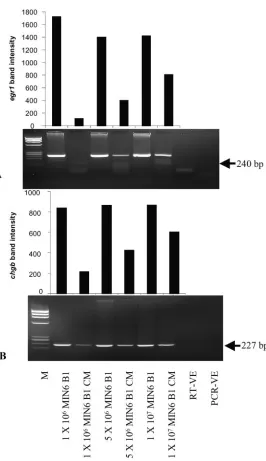
To investigate whether the abundance of specific mRNAs detectable in CM reflected the numbers of cells condition-ing the medium, we seeded MIN6 B1 cells at a range of densities and investigated the presence and amounts of several transcripts: Pdx1 (Fig. 1C), Egr1 (Fig. 3A), Chgb
(Fig. 3B),Ins1(see Fig. 2 in the online Data Supplement), andPax4(Fig. 4). All 5 transcripts were detected in RNA isolates from MIN6 B1 cells, and 4 of the transcripts (with the exception ofPax4) were detected in the corresponding CM samples.
In the case of thePdx1,Egr1, andChgbtranscripts (Figs. 1C and 3), band intensity after 45 PCR cycles was directly associated with the number of cells conditioning the medium; that is, more cells produced higher concentra-tions of transcripts in CM. In the case ofIns1(see Fig. 2 in the online Data Supplement), more amplified product was produced from RNA isolated from medium condi-tioned by 5⫻106cells than from medium conditioned by
1 ⫻106cells; however, we found no further increase in
band size/intensity after analysis of medium conditioned
2Human gene:INS, insulin. National Institute for Cellular Biotechnology,
by 1⫻107cells. This result is likely due to the highIns1
transcript concentrations in CM reaching a plateau phase for PCR analysis at the higher cell densities. Similarly, our analysis of human INS transcribed by Vero-PPI cells showed increased mRNA concentrations in medium con-ditioned by higher numbers of cells. The amounts ofINS
transcript detected in CM seemed to reach a plateau phase, however, with the yield from the PCR with CM samples no longer exponentially increasing beyond 5⫻ 106cells (see Fig. 3 in the online Data Supplement).
MIN6 B1 cells expressedPax4, and transcript concen-tration corresponded with the number of cells analyzed (Fig. 4). With the RT-PCR method used in this study, however, we were unable to detect this gene transcript in medium conditioned by these cells.
glucose responsiveness and corresponding
mRNAconcentrations
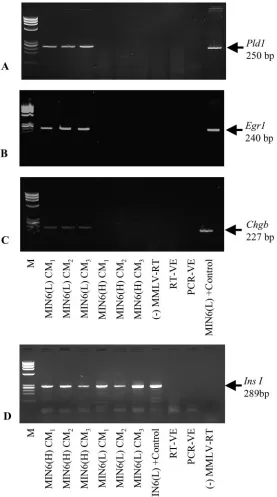
CM samples collected from cultures of glucose-responsive MIN6(L) cells and glucose-nonresponsive MIN6(H) cells were analyzed for several transcripts, including those for
Pld1,Egr1,Chgb, and Ins1 (Fig. 5).Pld1,Egr1, and Chgb
transcripts were reproducibly detected in triplicate
anal-yses of MIN6(L) CM samples but were undetected in MIN6(H) CM. Transcripts forIns1(Fig. 5D),Ins2(data not shown), and Actb (Fig. 1A), however, were detected in both MIN6(L) and MIN6(H) CM samples at similar concentrations.
Discussion
Circulating mRNAs have recently been detected in plasma and serum specimens from cancer patients, as well as people with no history of cancer (15,16 ). These RNAs apparently not only are able to escape from cells but also are protected from degradation by serum ribo-nucleases (17,18 ). Wieczorek et al. (4,19 ) reported that tumor cells release RNA into the sera of cancer patients as proteolipid complexes, which afford protection to the RNA from digestion by plasma ribonucleases. Nonpatho-logic cells in culture have been found to release RNA-DNA nucleoprotein complexes(20 ), and we have recently shown that mRNAs can be detected extracellularly in the cultures of a broad range of cancer cell types (11 ). Although accumulating evidence suggests the existence of extracellular mRNAs that may be clinically relevant biomarkers, extracellular mRNAs associated with
pancre-Fig. 1.ActbandPdx1RT-PCR results for cultured MIN6 cells and corresponding CM.
Actbamplification of cDNA prepared from MIN6(L) and MIN6(H) CM RNA (A). Subscript numbers indicate replicate experiments. A densitometry analysis indicated that the mRNA concentrations detectable in CM from MIN6(L) and MIN6(H) did not differ significantly (P⫽0.686,t-test). Also indicated are results forPdx1amplification with 30 (B) and 45 (C) PCR cycles. Shown are representative results of 3 experiments. RT-VE, control reaction with H2O instead of RNA; (–) MMLV-RT, reaction without
MMLV reverse transcriptase; PCR-VE, control PCR reaction with H2O
[image:4.585.47.315.65.443.2]atic beta cells—which may have clinical relevance in diabetes— have not previously been investigated. We have analyzed the transcripts of several genes in media conditioned by insulin-producing cell lines to investigate whether their presence is in any way indicative of beta cell mass/density and/or function and to assess the repro-ducibility of the procedures that we used.
Our study of culture medium conditioned by a range of insulin-producing cell types is, to our knowledge, the 1st to demonstrate that a range of mRNAs can be detect-able extracellularly in cultures of insulin-producing cells. The amplified products detected were 127–383 bp in size, and experiments conducted in triplicate indicated the results to be highly reproducible. Although 30 PCR cycles were sufficient to amplify RNA from cultured cells, 45 cycles were generally necessary for CM samples; how-ever, we found that the use of nested or seminested primers and large number of PCR cycles, as has been reported in relevant previous studies(6,15,21 ), were not necessary in our experiments. Furthermore, our results
suggest that the escape of mRNA from pancreatic beta cells may be somewhat selective, and not just a general “dumping” mechanism. This conclusion is supported by the fact that although Pdx1,Egr1, Chgb, Pax4, and Actb
genes are expressed by MIN6 B1 cells and Pdx1, Egr1,
Chgb, and Actb transcripts are detectable in the corre-sponding CM samples,Pax4is not. There are alternative explanations to the selective release of gene transcripts, however, including an insensitivity of the RT-PCR method to detect very low mRNA concentrations, or differences in mRNA stability in the extracellular environment.
[image:5.585.269.544.67.472.2]It has recently been suggested (22 ) that expression microarray and quantitative PCR analysis of saliva spec-imens might be detecting genomic DNA, rather than mRNA as claimed (23 ). This assertion was based on observations that “no-RT” (i.e., no reverse transcriptase included in the cDNA reaction) and “⫹RT” (reverse transcriptase included) reactions yielded similar amounts of PCR product, that microarray signals were unaffected
Fig. 2. Cell and CM RNA isolates treated with RNase or DNase before cDNA formation, MMLV reverse transcriptase treatment, and subsequent amplification withIns2(A) and
Npy(B) primers.
(⫹) RT, reaction with MMLV reverse transcriptase; (–) MMLV-RT, reaction without MMLV reverse transcriptase; RT-VE, control reaction with H2O instead of RNA; PCR-VE, control PCR reaction with
H2O instead of cDNA; M, molecular-mass markers (X174 DNAHaeIII
by RNase treatment, and the absence of RT-PCR products after DNase treatment. To investigate whether the extra-cellular nucleic acids detected in CM were wholly or partly DNA in origin and not from mRNA, we included as controls analyses of samples after DNase treatment, after RNase treatment, and without reverse transcriptase. The presence of amplified products after DNase treat-ment, the complete lack of product after RNase treatment or in the absence of reverse transcriptase, and the fact that the sizes of the detected amplicons are those expected for cDNA but not for genomic DNA support our conclusion that the nucleic acids detected throughout the course of this study were of RNA and not DNA origin.
[image:6.585.48.314.60.521.2]In some studies of human serum/plasma, the RNAs detected have been suggested to probably be short frag-ments (15 ). Similarly, extracellular RNAs isolated from
Fig. 4.Pax4mRNA analysis of MIN6 B1 cells grown at a range of densities and corresponding CM samples.
Shown are representative results of 3 experiments. RT-VE, control reaction with H2O instead of RNA; PCR-VE, control PCR reaction with H2O instead of cDNA; M,
[image:6.585.324.529.533.673.2]molecular-mass markers (X174 DNAHaeIII digest).
Fig. 3.Egr1(A) andChgb(B) RT-PCR analysis of RNA isolated from cultured MIN6 B1 cells and CM.
Analyses were for cells grown at a range of densities and for corresponding CM samples. Densitometry analysis of amplified gene products are shown above the gel image. Shown are representative results of 3 experiments. RT-VE, control reaction with H2O instead of
RNA; PCR-VE, control PCR reaction with H2O instead of cDNA; M,
the growth medium of HeLa and A431 cell cultures have been suggested to be represented by fragments of 100 –200 nucleotides(24 ). We have routinely amplified products of 127–383 bp from various regions of the mRNAs (5⬘end, 3⬘ end, and most of the sequence in some cases) after reverse transcription to cDNA with oligo(dT) to prime the mRNA poly(A) tail. Although the amounts of mRNA isolated are too small to confirm (by Northern blotting techniques) that full-length transcripts are present in the media, our successful amplification from all regions along the length of cDNAs prepared in this way indicates that the
frag-ments detected are⬎200 nucleotides in size and suggests that the mRNAs in the media of these cultured cells are not fragmented but full-length products.
To investigate whether the concentrations of specific mRNAs in CM are associated with the numbers of cells conditioning the medium, we grew MIN6 B1 and Vero-PPI cells at a range of densities in fixed volumes of medium and carried out RT-PCR analyses on both the cells and the corresponding CM. Our results for a number of beta cell gene transcripts (including those for Pdx1,
Egr1, andChgb) indicated that the degrees of gene
expres-Fig. 5. Analysis of CM from MIN6(L) and MIN6(H) cultures for
Pld1(A),Egr1(B),Chgb(C), andIns1(D).
A densitometry analysis indicated thatIns1mRNA concentrations in CM from MIN6(L) and MIN6(H) cultures did not differ significantly (P⫽
0.543,t-test). Subscript numbers indicate replicate experiments. (–) MMLV-RT, reaction without MMLV reverse transcriptase; RT-VE, con-trol reaction with H2O instead of RNA; PCR-VE, control PCR reaction
with H2O instead of cDNA;⫹Control, positive control; M,
[image:7.585.269.546.68.565.2]sion reflect the numbers of MIN6 B1 cells conditioning the medium. Although there are no previous beta cell studies with which to compare these findings, it is interesting that the amount of circulating tumor-specific mRNA has been associated with cancer tumor stage (25 ). Furthermore, increased extracellular DNA detected in the plasma of patients after physical trauma was associated with the severity of injury and has predicted late posttraumatic complications, such as organ failure(26 ). From our anal-ysis of MIN6 B1 and Vero-PPI CM, we speculate that quantifying circulating mRNA concentrations makes pos-sible an assessment of the number of surviving beta cells for the purpose of predicting the development of type 1 diabetes.
To establish whether the presence of extracellular mRNAs reflects beta cell function (i.e., specifically the ability of beta cells to release insulin in a glucose-regu-lated manner), we conducted analyses of mRNAs in medium conditioned by glucose-responsive MIN6(L) cells or glucose-nonresponsive MIN6(H) cells. Our choice of transcripts was based on our previous analysis of MIN6(L) and MIN6(H) cells, in which we identified a number of mRNAs that were differentially expressed in these cell lines(27 ). Using both microarray and quantita-tive RT-PCR methods, we foundEgr1,Pld1, andChgbto be significantly down-regulated in MIN6(H) cells com-pared with MIN6(L) cells. In agreement with our previous analysis of these cells, the present study detected these 3 gene transcripts in replicated analyses of MIN6(L) CM; however, these mRNAs were not detectable in MIN6(H) CM. Our microarray analysis indicated no significant differences in Ins1, Ins2, or Actb expression between MIN6(L) and MIN6(H) cells. Similarly, all 3 of these transcripts were detected in MIN6(L) and MIN6(H) CM, and the amounts detected in the CM from cultures of these cell lines did not differ significantly.
In conclusion, we have demonstrated that several healthy, proliferating insulin-producing cell lines in culture appar-ently pass many gene transcripts into the extracellular environment and that these transcripts can be reproduc-ibly detected. Our results support the contention that the detected nucleic acids are of mRNA and not DNA origin and suggest that the release of particular transcripts by a given cell line into the medium may be somewhat selec-tive. The results from this study also indicate that the concentrations of some— but not all—mRNAs detected in CM reflect the numbers of insulin-producing cells condi-tioning the medium and the functional status of the beta cells. Extending these findings in future studies of serum samples from people with and without diabetes will help establish the clinical relevance of these findings.
Grant/funding support: This work was supported by fund-ing from Ireland’s Higher Educational Authority Program
for Research in Third Level Institutions Cycle 3 and Dublin City University’s Research Fellowship.
Financial disclosures: None declared.
References
1. International Diabetes Federation. http://www.idf.org/home/ index.cfm?unode⫽3B96906B-C026-2FD3-87B73F80BC22682A (accessed February 10, 2007).
2. Sia C. Autoimmune diabetes: ongoing development of immunolog-ical intervention strategies targeted directly against autoreactive T cells. Rev Diabet Stud 2004;1:9 –17.
3. Mandel P, Me´tais P. Les acides nucle´iques du plasma sanguin chez l’homme. C R Acad Sci Paris 1948;142:241–3.
4. Wieczorek AJ, Sitaramam V, Machleidt W, Rhyner K, Perruchoud AP, Block LH. Diagnostic and prognostic value of RNA-proteolipid in sera of patients with malignant disorders following therapy: first clinical evaluation of a novel tumor marker. Cancer Res 1987;47: 6407–12.
5. Kopreski MS, Benko FA, Kwak LW, Gocke CD. Detection of tumor messenger RNA in the serum of patients with malignant mela-noma. Clin Cancer Res 1999;5:1961–5.
6. Hasselmann DO, Rappl G, Rossler M, Ugurel S, Tilgen W, Reinhold U. Detection of tumor-associated circulating mRNA in serum, plasma and blood cells from patients with disseminated malignant melanoma. Oncol Rep 2001;8:115– 8.
7. Bianchi DW, Williams JM, Sullivan LM, Hanson FW, Klinger KW, Shuber AP. PCR quantitation of fetal cells in maternal blood in normal and aneuploid pregnancies. Am J Hum Genet 1997;61: 822–9.
8. Poon LLM, Leung TN, Lau TK, Lo YMD. Presence of fetal RNA in maternal plasma. Clin Chem 2000;46:1832– 4.
9. Tsui NBY, Lo YMD. Placental RNA in maternal plasma toward noninvasive fetal gene expression profiling. Ann N Y Acad Sci 2006;1075:96 –102.
10. Hamaoui K, Butt A, Powrie J, Swaminathan R. Concentration of circulating rhodopsin mRNA in diabetic retinopathy. Clin Chem 2004;50:2152–5.
11. O’Driscoll L, Kenny E, Perez De Villarreal M, Clynes M. Detection of specific mRNAs in culture medium conditioned by human tumour cells: potential for new class of cancer biomarkers in serum. Cancer Genomics & Proteomics 2005;2:43–52.
12. Lilla V, Webb G, Rickenbach K, Maturana A, Steiner DF, Halban PA, et al. Differential gene expression in well-regulated and dysregulated pancreatic-cell (MIN6) sublines. Endocrinol 2003; 144:1368 –79.
13. O’Driscoll L, Gammell P, Clynes M. Engineering Vero cells to secrete human insulin. In Vitro Cell Dev Biol Anim 2002;38:146 – 53.
14. O’Driscoll L, Gammell P, Clynes M. Mechanisms associated with loss of glucose responsiveness in beta cells. Transplant Proc 2004;36:1159 – 62.
15. El-Hefnawy T, Raja S, Kelly L, Bigbee WL, Kirkwood JM, Luketich JD, et al. Characterization of amplifiable, circulating RNA in plasma and its potential as a tool for cancer diagnostics. Clin Chem 2004;50:564 –73.
16. O’Driscoll L. Extracellular nucleic acids and their potential as diagnostic, prognostic and predictive biomarkers. Anticancer Res 2007;27:1257– 66.
18. Tsui NBY, Ng EKO, Lo YMD. Stability of endogenous and added RNA in blood specimens, serum, and plasma. Clin Chem 2002; 48:1647–53.
19. Wieczorek AJ, Rhyner C, Block LH. Isolation and characterization of an RNA-proteolipid complex associated with the malignant state in humans. Proc Natl Acad Sci U S A 1985;82:3455–9.
20. Stroun M, Anker P, Beljanski M, Henri J, Lederrey C, Ojha M, et al. Presence of RNA in the nucleoprotein complex spontaneously released by human lymphocytes and frog auricles in culture. Cancer Res 1978;38:3546 –54.
21. Chen XQ, Bonnefoi H, Pelte MF, Lyautey J, Lederrey C, Movarekhi S, et al. Telomerase RNA as a detection marker in the serum of breast cancer patients. Clin Cancer Res 2000;6:3823– 6.
22. Kumar SV, Hurteau GJ, Spivack SD. Validity of messenger RNA expression analyses of human saliva. Clin Cancer Res 2006;12: 5033–9.
23. Li Y, Zhou X, St John MAR, Wong DTW. RNA profiling of cell-free saliva using microarray technology. J Dent Res 2004;83:199 – 203.
24. Morozkin ES, Laktionov PP, Rykova EY, Vlassov VV. Extracellular nucleic acids in cultures of long-term cultivated eukaryotic cells. Ann N Y Acad Sci 2004;1022:244 –9.
25. Wong SCC, Lo SFE, Cheung MT, Ng KOE, Tse CW, Lai BSP, et al. Quantification of plasma beta-catenin mRNA in colorectal cancer and adenoma patients. Clin Cancer Res 2004;10:1613–7.
26. Lam NYL, Rainer TH, Chan LYS, Joynt GM, Lo YMD. Time course of early and late changes in plasma DNA in trauma patients. Clin Chem 2003;49:1286 –91.