Determination of Cross-efficiency
Considering the Original Efficiency Value
of DMUs in DEA Cross-evaluation
Peng Liu and Li-Fang Wang
Abstract—Data envelopment analysis (DEA) has been extended to cross-efficiency evaluation to provide better discrimination and ranking of decision-making units (DMUs). However, the non-uniqueness of optimal solutions in CCR model damages the usefulness of DEA cross-efficiency evaluation method. To solve this problem, this paper proposes three secondary goal models considering the original efficiency value of DMUs based on the aggressive, benevolent and neutral idea. Finally, the numerical example proves that the proposed models can play a significant role in reducing the number of zero weights for both inputs and outputs in cross-efficiency evaluation.
Index Terms—CCR, DEA Cross-efficiency evaluation,
Secondary goal models, Original efficiency value.
I. INTRODUCTION
CR model proposed by Charnes, Cooper, and Rhodes is a non-parametric method for efficiency evaluation of a group of homogenous decision-making units (DMUs) where multiple inputs are consumed to produce multiple outputs [1]. For its functional ability in efficiency evaluation and identifying the production frontier, it has been widely used for efficiency evaluation of schools, hospitals, colleges in university and so on [2].
Since CCR model allows each DMU to evaluate its effic- Manuscript received September 30, 2018; This work was substantially supported by the National Natural Sciences Foundation of China under Grant No. 71601155, and Nature Science Foundation of Shaanxi Province, China, under 2017JQ7001.
Peng Liu is with the School of Management, Northwestern Polytechnical University, Xi’an 710072, PR China.
Li-Fang Wang is the corresponding author with the School of Management, Northwestern Polytechnical University, Xi’an 710072, PR China. e-mail: [email protected]
iency with its most favorable weights, more than one DMU is often evaluated to be DEA efficient and cannot be discriminated further[3]. So, lack of discrimination power is the major drawback that CCR suffers from. To improve the discrimination power of CCR, DEA cross-efficiency evaluation was proposed by Sexton et al. [4]. Unlike the CCR model where each DMU uses its own most favorable weights for efficiency evaluation, it employs both
self-evaluation and peer-evaluation. In DEA
cross-efficiency evaluation, each DMU will obtain one self-evaluated efficiency based on its most favorable weights and n1 peer-evaluated efficiencies using the most favorable weights of other n1DMUs. Then all these n efficiencies for each DMU are averaged into a value to be its average cross-efficiency value. Based on the
average cross-efficiency value of each DMU, DEA
cross-efficiency evaluation can provide a unique rank order to DMUs in most practical situations [5]. Due to its powerful discrimination, DEA cross-efficiency evaluation method has been widely applied in efficiency evaluation of countries in the Olympic Games [6], project ranking and preference voting [7], portfolio selection in Korean stock market [8] and so on.
However, for each DMU the optimal weights solution in CCR model is usually not unique and the problem of non-uniqueness of optimal weights will undermine the usefulness of DEA cross-efficiency evaluation. To solve this problem, Sexton et al. suggested using secondary goal models [4]. Inspired by this idea, many secondary goal models have been proposed. The aggressive (benevolent) model proposed by Doyle and Green minimizes (maximizes) the average cross-efficiency of other DMUs while keeping the efficiency value of DMU under evaluation at its CCR level [9]. Based on the aggressive
C
IAENG International Journal of Applied Mathematics, 49:2, IJAM_49_2_06
and benevolent ideas, many other scholars offered a series of aggressive and benevolent models [10-12]. In most practical cases, the aggressive and benevolent models will generate different efficiency results and rank orders for DMUs. To avoid the choice difficulty between aggressive and benevolent models, neutral model was introduced [13-15]. Different from the aggressive and benevolent models, neutral model conducted optimal weights selection only from the viewpoint of DMU under evaluation without considering whether it is aggressive or benevolent to other DMUs. The weight-balanced model aims to lessen the difference in weighted data and reduce the number of zero- weights [16]. The models introduced by Wang, Chin, and Wang, Jahanshahloo et al., Ramón, Ruiz, and Sirvent are with similar idea [17-19]. The rank model considers that in some cases pursuing the best ranking is more important than maximizing the individual score [20, 21]. From the goal functions of the models mentioned above, we can acquire that they only consider the impact of selected weights to standard efficiencies of DMUs ignoring their impact to the original efficiencies of DMUs.
In this paper, we will provide a new perspective to understand DEA and construct some new DEA cross-efficiency models. The proposed models here focused on the impact of selected weights to the original efficiency value of DMUs. The rest of the paper unfolds as follows. Section 2 briefly introduces the DEA cross-efficiency evaluation and offers new models. Chapter 3 gives a numerical example, and conclusions are given in Part 4.
II. CROSS-EFFICIENCY EVALUATION AND NEWLY PROPOSED
MODELS
Suppose that there are
n
DMUS to be evaluated wherem
inputs are consumed to produces
outputs. The inputs and outputs value of DMUj(j1,L , )n are denoted by x iij( 1,K, )m and y rrj( 1, , )s . Theratio s1 r rj/ m1 i ij
ru y iv x
denotes the efficiency valueof DMUj. The efficiency value of DMUk under CCR is
calculated by model (1), Where
1, ,
k n
DMU DMU K DMU is the decision-making unit
(DMU) under evaluation, the inputs and outputs weights
1
1
1 1
1 (1)
0, 1, , ,
, 0, 1, , ; 1, ,
s kk rk rk
r m
ik ik i
s m
rk rj ik ij
r i
rk ik
Maximize u y
Subject to v x
u y v x j n
u v r s i m
KK K
are denoted by vik(i1,K, )m and urk(r1,K, )s . If
( 1, , )
rk
u r K s and v iik( 1, , )m are the optimal solution to the above CCR model, the
1
s
kk r u yrk rk
will be the CCR efficiency value of DMUk. If kk
is
equal to 1, the DMUk will be referred to as DEA efficient;
Otherwise, it will be non-DEA efficient.
1 / 1
s m
jk r u yrk rj i v xik ij
is referred to as across-efficiency of DMUj and reflects the peer evaluation of DMUkto DMUj (j1,K, ,n jk).
CCR model (1) is solved for each of n DMUS
respectively. As a result, there will be n sets of inputs and outputs weights available for n DMUs and based on them, each DMU will gain n efficiency values which include 1 self-evaluated efficiency value and n1 peer-evaluated efficiency values, which form a cross-efficiency matrix shown in table 1. They are usually aggregated by equal weights to obtain average cross-efficiency (ACE) value for each DMU, and based on which the DMUS can be fully
ranked.
TABLE I
CROSS-EFFICIENCY MATRIX
DMU
Target DMU
Average Cross-Efficiency
1 2 K n
1 11 12 L 1n 1
1
1 n
k k
n
2 21 22 L 2n 2
1
1 n
k k
n
M M M M M M
n n1 n2 L nn
1
1 n
nk k
n
It is noticed that the optimal solution in the CCR model (1) may be not unique that will damage the usefulness of
IAENG International Journal of Applied Mathematics, 49:2, IJAM_49_2_06
cross-efficiency evaluation. To handle this problem, Sexton et al. [4] introduce the concept of secondary goal model. Inspired by this idea, many secondary goal models have been proposed. Among them, the aggressive, benevolent and neutral models are widely used. Their formulations are as stated by the model (2), (3) and (4). The aggressive (benevolent) model minimizes (maximizes) the average efficiency value of other DMUs while keeping the efficiency value of DMU under evaluation at its CCR efficiency. The neutral model selects the unique set of weights only from the viewpoint of DMU under evaluation without considering whether it is aggressive or benevolent to other DMUs. The above neutral model searches for a set of input and output weights to maximize its efficiency as a whole and at the same time to make its each output being as efficient as possible to produce sufficient efficiency as an individual [13]. From the formulations of the above models, it is clearly shown that the weights in models need to assure the efficiency values of all DMUs not more than 1. That means the efficiency results calculated by the CCR model are standard values and the existing DEA cross-efficiency models selected the weights only considering their impact to standard efficiency values of DMUs ignoring their impact to the original efficiencies of DMUs. Different from them, we proposed models from an original efficiency viewpoint. Under the original efficiency perspective, the
above CCR model will be reformulated to be model (5). Different from the model (1) the weights in model (5) are
denoted by new letters. It means if there exists no less than one set of weights meeting the restraint in above model that can make the efficiency value of DMUk maximal among all DMUs, the DMUk will be DEA efficient. We let r
be equal to ur
sr1ur, ibe equal to 1m
i i i
v
v and1 1 1 1 1 1 1 1 1
0 (2)
0
s n
rk rj
r j j k
m n
ik ij
i j j k
s m
rk rk kk ik ik
r i
s m
rk rj ik ij
r i
Minimize u y
Subject to v x
u y v x
u y v x j
, , , 10 1
0 1
rk
ik
n j k
u r s
v i m
, , ; , , , , , , , , , 1 1 1 1 1 1 1 1 1
0 (3)
0
s n
rk rj
r j j k
m n
ik ij
i j j k
s m
rk rk kk ik ik
r i
s m
rk rj ik ij
r i
Maximize u y
Subject to v x
u y v x
u y v x
, , , 10 1
0 1
rk
ik
j n j k
u r s
v i m
, , ; , , , , , , , , ,
1
1 1 1 1 1 = minimum
= 1 1 (4)
0 1
rk rk m r s ik ik i s rk rk r kk m ik ik i s rk rj r jk m ik ij i rk u y Maximize v x u y subject to v x u y
j n j k
v x
u r s
, , , , , , , , , , ,vik 0 , i 1, , ,m
1 1 1 1 1 1 1 1
1 (5)
s s
rk rj
rk rk r
r
kk m j n m
ik ik ik ij
i i s rk r m ik i y y Maximize Maximize x x Subject to
, , / , ,0 1
0 1
rk ik r s i m , , , , , , ,
the model (5) will be transformed to be the linear model (1) through Charnes-Cooper transformation. The two models are equivalent. Because the weights of two models are one-to-one correspondence, accordingly the original efficiency values and standard values are also one-to-one correspondence. Considering the original efficiency values, the DMU under evaluation will minimize (maximize) the average original efficiency value of other DMUs while selecting unique set of weights among many weights solutions in CCR model based on aggressive (benevolent) idea. The DMU under evaluation will maximize its original efficiency value based on neutral idea. The modeling mechanism is more transparent and more accessible to understand than that considering standard efficiency values. Inspired by this, the formulations of newly proposed aggressive, benevolent and neutral models are illustrated by model (6), (7) and (8) respectively. The goal functions of the above models concern the original efficiencies of DMUs.
IAENG International Journal of Applied Mathematics, 49:2, IJAM_49_2_06
1 1 1 1 1 1 1 1 1
= 1 1 (6)
0 1
m n i i jk
s j j k
r r s rk rk r kk m ik ik i s rk rj r jk m ik ij i rk v Minimize n u u y subject to v x u y
j n j k
v x
u r s
, , , , , , , , , ,0 1
ik
v , i , , ,m
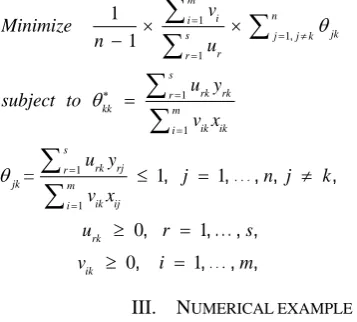
III. NUMERICAL EXAMPLE
This part will provide a numerical example to demonstrate the efficiency results difference between the proposed models and the models considering standard efficiency value of DMUs.
Numerical example: Efficiency evaluation of seven departments in a university [22]. Seven academic departments are needed to be evaluated with three inputs and three outputs. The inputs are number of academic staff, academic staff salaries in thousands of pounds and support staff salaries in thousands of pounds. The outputs are number of undergraduate students, number of postgraduate students, number of research papers. Table 2 shows the input and output data and CCR results of DMUs. From it, it is clearly shown that six of seven are DEA efficient and efficient DMUs cannot be further distinguished. Table 3 shows the efficiency evaluation results through aggressive, benevolent, neutral and proposed models. The results are shown to be different which can indicate the difference between considering original efficiency values and considering standard values when constructing DEA cross-efficiency secondary goal models. To further illustrate their difference, table 4 to 9 shows the unique set of weights selected by the models and they are obviously different. Moreover, it also clearly shows that the weights selected by aggressive, benevolent and neutral models contain many zero weights. Meantime, the zero weights chosen by the neutral model are only in inputs part. That means many inputs and outputs information are ignored when generating cross-efficiencies through aggressive, benevolent and neutral models. This situation can result in the ultimate efficiency results to be unreasonable. From table 7 to 9, it clearly shows the proposed models can significantly reduce the number of zero weights. That indicates the efficiency results generated by the proposed models to be more reasonable because in reality each input or output is critical and none of them can be ignored.
1 1 1 1 1 1 1 1 1
= 1 1 (7)
0 1
0 m n i i jk
s j j k
r r s rk rk r kk m ik ik i s rk rj r jk m ik ij i rk ik v Maximize n u u y subject to v x u y
j n j k v x
u r s
v
, , , , , , , , , ,i 1 m
, , , ,
11 11
1 1 1 1
1, 1 (8)
0 1
s s
rk rk rk
r r
m m
ik ik ik
i i s rk rk r kk m ik ik i s rk rj r jk m ik ij i rk
u y u
Maximize
v x v
u y Subject to
v x
u y
j n j k
v x
u r s
, , , , , ,vik 0 , i 1 ,m
TABLE II
INPUTS AND OUTPUTS DATA AND CCR VALUES
DMUs
Inputs Outputs
CCR
1
x x2 x3 y1 y2 y3
1 12 400 20 65 35 17 1 2 19 750 70 139 41 40 1 3 42 1500 70 225 68 75 1 4 15 600 100 90 12 17 0.8197 5 45 2000 250 253 145 130 1 6 19 730 50 132 45 45 1 7 41 2350 600 305 159 97 1
IV. CONCLUSION
Aiming at solving the problem of non-uniqueness of optimal weights in DEA cross-efficiency evaluation, we propose three DEA cross-efficiency models considering the original efficiency values of DMUs based on aggressive, benevolent and neutral notions.
The proposed models bring at least three contributions to DEA. Firstly, the concept of original efficiency values of DMUs is incorporated into DEA cross-efficiency evaluation. Secondly, the modeling mechanism of proposed models is more precise. Thirdly, the proposed models can significantly reduce the number of zero weights, so the efficiency results generated by them are more reasonable. About the further research direction based on this paper, the
IAENG International Journal of Applied Mathematics, 49:2, IJAM_49_2_06
[image:4.595.48.227.61.222.2]interesting readers can enrich the models considering the original efficiency values of DMUs based on other ideas such as the idea of the rank model and so on.
ACKNOWLEDGMENT
The authors are indebted to the editors and the reviewers for their constructive comments and suggestions which significantly improved the quality of the paper.
TABLE III
EFFICIENCY EVALUATION RESULTS THROUGH THE MODELS
DMUs Aggressive Benevolent Neutral Model (6) Model (7) Model (8) 1 0.8788 (1) 0.9442 (3) 0.9362 (2) 0.8919(2) 0.8350(3) 0.8302 (3) 2 0.7219 (4) 0.9486 (2) 0.9026 (3) 0.8529(3) 0.8879(2) 0.8458 (2) 3 0.7301 (3) 0.7827 (6) 0.7763 (6) 0.7770(5) 0.8268(4) 0.7991 (4) 4 0.4018 (7) 0.6160 (7) 0.5649 (7) 0.5067(7) 0.5648(7) 0.5226 (7) 5 0.6259 (5) 0.8534 (5) 0.8272 (5) 0.8171(4) 0.7122(5) 0.7366 (5) 6 0.8126 (2) 0.9801 (1) 0.9493 (1) 0.9363(1) 0.9579(1) 0.9309 (1) 7 0.5966 (6) 0.8992 (4) 0.8552 (4) 0.6766(6) 0.6591(6) 0.6515 (6)
TABLE IV
WEIGHTS SELECTED BY AGGRESSIVE MODEL
DMUs x1 x2 x3 y1 y2 y3
1 0 0 0.0009 0 0.0005 0
2 0 0.0001 0.0001 0.0007 0 0
3 0 0 0.0009 0.0003 0 0
4 0.0054 5.3E-06 0 0.0008 0 0
5 0.0043 0 0.0004 0 0 0.0023
6 0.0010 0 0.0007 0 0 0.0012
7 0.0066 0 0 0 0.0017 0
TABLE V
WEIGHTS SELECTED BY BENEVOLENT MODEL
DMUs x1 x2 x3 y1 y2 y3
1 0.0020 8.1E-05 0 0.0003 0.0009 0.0003
2 0.0029 6.6E-05 0 0.0006 0.0006 0
3 0 2.9E-05 0.0007 0 0.0002 0.0010
4 0.0054 5.3E-06 0 0.0008 0 3.2E-11
5 0.0025 0.0001 0 0.0004 0.0011 0.0004
6 0.0021 8.4E-05 0 0.0003 0.0009 0.0003
7 0.0025 0.0001 0 0.0004 0.0012 0.0004
IAENG International Journal of Applied Mathematics, 49:2, IJAM_49_2_06
TABLE VI
WEIGHTS SELECTED BY NEUTRAL MODEL
DMUs x1 x2 x3 y1 y2 y3
1 0 0.0017 0.0162 0.0056 0.0095 0.0196
2 0.0371 0.0004 0 0.0053 0.0032 0.0033
3 0 0 0.0143 0.0008 0.0026 0.0085
4 0.0642 6.29E-05 0 0.0091 1.60E-10 1.13E-10
5 0.0108 0.0003 0 0.0013 0.0023 0.0026
6 0 0.0014 0 0.0025 0.0074 0.0074
7 0.0174 0.0001 0 0.0011 0.0021 0.0034
TABLE VII
WEIGHTS SELECTED BY MODEL (6)
DMUs x1 x2 x3 y1 y2 y3
1 0.1724 0.1061 0.3219 0.1847 1.0442 0.1951
2 0.0000 0.2259 0.0000 1.0915 0.2854 0.1497
3 0.0004 7.7997 165.7457 0.0002 0.0006 310.6892
4 0.2648 0.0731 0.0018 0.4274 0.0045 0.0073
5 0.7942 0.5732 0.0048 0.1530 3.0743 5.3753
6 1.4935 1.0691 0.4550 3.9806 2.9201 3.8835
7 2.1224 0.0566 0.0046 0.0542 1.1923 0.1716
TABLE VIII
WEIGHTS SELECTED BY MODEL (7)
DMUs x1 x2 x3 y1 y2 y3
1 1.5088 0.0252 1.0635 0.6674 0.2683 0.0005
2 1.5577 0.0559 0.0061 0.4302 0.1793 0.1195
3 0.1732 0.1108 3.3974 1.5306 0.1822 0.7264
4 4.3444 0.0043 0.0000 0.6172 0.0000 0.0001
5 1.9763 0.0208 0.0084 0.0043 0.3013 0.6754
6 1.9357 0.0012 0.7566 0.4728 0.0915 0.1997
7 3.5260 0.0203 0.0028 0.5313 0.1954 0.0082
TABLE IX
WEIGHTS SELECTED BY MODEL (8)
DMUs x1 x2 x3 y1 y2 y3
1 0.5233 0.0868 0.8751 0.1983 1.1951 0.2820
2 1.1679 0.0878 0.0004 0.5685 0.1449 0.0775
3 0.1871 0.0134 1.3189 0.0635 0.2586 1.1791
4 1.6167 0.0016 0 0.2297 0 0
5 2.9180 0.0224 0.0287 0.0579 0.3724 0.8820
6 9.8724 0.0063 4.2159 2.8648 0.3116 0.2404
7 2.9744 0.0104 0.0017 0.3479 0.0497 0.3441
IAENG International Journal of Applied Mathematics, 49:2, IJAM_49_2_06
REFERENCES
[1] Charnes, A., Cooper, W.W., Rhodes, E.L, “Measuring the efficiency of decision making units,” European Journal of Operational Research , vol. 2, pp.429–444, 1978.
[2] Charnes, A., W. W. Cooper, A. Y. Lewin, and L. M. Seiford, eds, Data Envelopment Analysis: Theory, Methodology, and
Applications, MA: Kluwer, Boston, 1994.
[3] Jie Wu, Junfei Chu, Qingyuan Zhu, Pengzhen Yin and Liang Liang, “DEA cross-efficiency evaluation based on satisfaction degree: an application to technology selection,” International Journal of Production Research, vol.54, no.20, pp.5990–6007, 2016
[4] Sexton, T. R., R. H. Silkman, and A. J. Hogan, Data Envelopment Analysis: Critique and Extensions, CA: Jossey-Bass, San Francisco, pp.73–105, 1986.
[5] Doyle, J. R., and R. H. Green, “Cross-evaluation in DEA: Improving Discrimination among DMUs,” INFOR, vol.33, no.3, pp.205–222, 1995
[6] Wu J, Liang L and Yang F, “Achievement and benchmarking of countries at the Summer Olympics using cross efficiency evaluation method,” European Journal of Operational Research, vol.197, no.2, pp.722-730, 2009.
[7] Green RH, Doyle JR and Cook WD, “ Preference voting and project ranking using DEA and cross-evaluation,” European Journal of Operational Research, vol.90, no.3, pp. 461-472, 1996.
[8] Lim, S., K. W. Oh, and J. Zhu, “’Use of DEA Cross-efficiency Evaluation in Portfolio Selection: An Application to Korean Stock Market,” European Journal of Operational Research, vol.236, no.1, pp.361–368, 2014.
[9] Doyle, J. R., and R. H. Green, “Efficiency and Cross-efficiency in DEA: Derivations, Meanings and Uses,” Journal of the Operational Research Society , vol.45, no.5, pp.567–578, 1994.
[10] Liang, L., J. Wu, W. D. Cook, and J. Zhu, “The DEA Game Cross-efficiency Model and Its Nash Equilibrium,” Operations Research, vol.56 , no.5, pp.1278–1288, 2008.
[11] Wang, Y. M., and K. S. Chin, “Some Alternative Models for DEA Cross-efficiency Evaluation,” International Journal of Production Economics, vol. 128, no.1, pp.332–338, 2010.
[12] Lim, S., “Minimax and Maximin Formulations of Cross-efficiency in DEA,” Computers & Industrial Engineering, vol.62, pp.726–731, 2012.
[13] Wang, Y. M., and K. S. Chin, “A Neutral DEA Model for Cross-efficiency Evaluation and Its Extension,” Expert Systems with Applications, vol.37 , no.5, pp.3666–3675, 2010.
[14] Wang, Y. M., K. S. Chin, and P. Jiang, “Weight Determination in the Cross-efficiency Evaluation,” Computers & Industrial Engineering , vol.61 , no.3, pp.497–502, 2011
[15] Wang, Y. M., K. S. Chin, and Y. Luo, “Cross-efficiency Evaluation Based on Ideal and Anti-ideal Decision Making Units.,” Expert Systems with Applications, vol.38 , no.8, pp.10312–10319, 2011. [16] Wu, J., J. S. Sun, and L. Liang., “Cross Efficiency Evaluation
Method Based on Weight-balanced Data Envelopment Analysis Model,” Computers and Industrial Engineering, vol.63, pp.513–519, 2012.
[17] Jahanshahloo, G. R., F. Hosseinzadeh Lotfi, Y. Jafari, and R. Maddahi, “Selecting Symmetric Weights as a Secondary Goal in DEA Cross-efficiency Evaluation,” Applied Mathematical Modelling, vol.35, pp.544–549, 2011.
[18] Ramón, N., J. L. Ruiz, and I.Sirvent, “On the Choice of Weights Profiles in Cross-efficiency Evaluations,” European Journal of Operational Research, vol.207, no.3, pp.1564–1572, 2010. [19] Wang, Y. M., K. S. Chin, and S. Wang, “DEA Models for
Minimizing Weight Disparity in Cross-efficiency Evaluation,” Journal of the Operational Research Society, vol.63, no.8, pp.1079–1088, 2012.
[20] Wu, J., L. Liang, Y. Zha, and F. Yang, “Determination of Cross-efficiency under the Principle of Rank Priority in Crossevaluation,” Expert Systems with Applications, vol.36, no.3, pp.4826–4829, 2009.
[21] Contreras, I, “Optimizing the Rank Position of the DMU as Secondary Goal in DEA Cross-evaluation,” Applied Mathematical Modelling, vol.36, no.6, pp. 2642–2648, 2012.
[22] Wong, Y. H. B., & Beasley, J. E, “Restricting weight flexibility in data envelopment analysis,” Journal of the Operational Research Society, vol.41, pp.829–835, 1990.