Examining the impact of carbon price changes under a personalised carbon trading
scheme for transport
David McNamara and Brian Caulfield
1Abstract
The research presented in this paper investigates the welfare effects of a Personal Carbon
Trading Scheme (PCTS). A consumer surplus analysis is used to determine the welfare loss
to individuals who undertake travel-to-work trips in the Dublin and the Western Border
Region (WBR) of Ireland. Three CO2 price scenarios are analysed: a low, medium and high
carbon price. These results are compared at an aggregate level for each electoral division to
existing measures of deprivation derived from the Census 2006 to determine if electoral
wards designated as relatively deprived also incur the largest welfare losses. The results are
also compared to density of population in each electoral division to investigate any link
between density levels and welfare changes, particularly in rural regions.
The welfare model found a significant divergence in the changes in consumer surplus
between both study regions. While welfare changes were minimal in the low price scenario,
divergences occurred in the medium and high price scenarios as individuals using more
sustainable modes in urban areas benefited from the higher market price. Large welfare
losses were found in the more rural WBR whilst most areas in Dublin were found to
experience a welfare gain.
1. Carbon reduction policies
In Ireland, the transport sector has become one of the major sources of green house gas
emissions growth in recent years. In 2009 transport emissions accounted for 21.1% of
Ireland’s
green house gases (EPA, 2010). This was a 176% increase on 1990 levels, second
only to Cyprus amongst the 27 EU countries. Road transport emissions accounted for 97% of
transport emissions. Evidently, significant reductions of road transport emissions, as part of
overall GHG emissions is required in meeting Ireland’s Kyoto targets.
A number of
supply-side and demand-supply-side policies have been advocated to reduce CO2 emissions. Research has
mainly focused on fiscal measures such the carbon taxation. These measures will be
discussed in the following sections.
In 2010, a carbon tax on fuel and gas was introduced in Ireland. This tax was levied
on transport and home heating fuels as well as natural gas. It currently stands at €15 per tonne
of CO2. The idea of reducing CO2 emissions by imposing a tax is not a new concept. The idea
of negating an externality using taxation was first suggested by Pigou (1952). Pigou (1952)
argued that the agents who create the benefits or costs in an economy do not always have to
bear the outcomes. A tax would internalise any negative outcomes while incentivising agents
to reduce activities which would incur a tax. This type of tax is known as a Pigouvian tax.
Using a Pigouvian type tax to reduce CO
2has become a popular policy tool subsequent to the
signing of the Kyoto protocol in 1997. This treaty provided flexibility to implement a number
of policies to share the burden of reduction amongst nation such as trading schemes. While
the EU created the Emissions Trading Scheme to provide a pan-European mechanism to
reduce CO2, many countries have implemented carbon taxes within each state as the primary
1Department of Civil, Structural and Environmental Engineering, Trinity College Dublin, Dublin 2, Ireland
*Manuscript
policy tool for reduction. One of the reasons for the popularity of taxation is the relative
simplicity of levying a tax as opposed to designing and implementing a complex trading
scheme. To date all of Norway, Sweden, Finland, Switzerland, Netherlands and Ireland have
implemented various forms of carbon related taxation.
Early studies investigating measures to mitigate climate change have advocated the
use of carbon taxation as a means of reducing CO2 (Symons et al., 1994, Baumol, 1972,
Pearce, 1991). Baumol (1972) built on the work of Pigou in investigating the effectiveness of
Pigouvian type taxes in reducing emissions. This approach also advocated using subsidies as
a supplementary measure to incentivise polluters to reduce their emissions. Baumol (1972)
suggested a persuasive case could be made for the use of taxation, although in reality the
environmental outcomes would be less optimal than predicted. Pearse (1991) and Symons et
al. (1994) both studied the potential effects of a carbon tax levied across the UK economy.
Their conclusions endorsed the view that carbon taxes can effectively reduce emissions at a
minimum cost to the economy. Another benefit cited is the ‘double dividend’ effect (Goulder,
1995). This is the concept that the tax will reduce emissions while substituting for revenues
from so-called ‘good’ sources such as income tax.
Sovacool (2010) conducted a study of carbon taxation while comparing it to carbon
trading in the USA. This article advocates using carbon taxes over other mechanisms such as
carbon trading due to the price stability it provides, net benefits up to 16 times greater than
other schemes, simplicity of implementation and a minimisation of transaction costs.
While the majority of research to date has focused on potential emissions reductions,
recent studies have investigated equity. Ekins and Dresner (2004) modelled the equity effects
of a carbon tax in the UK. The findings emphasise the importance of compensating the
lowest income earners, who were found to be the largest net losers in the event of taxation
being introduced. Despite including for measures to compensate low-income individuals in
their model, some low-earners still remained the largest net losers. Callen et al. (2009) also
studied the equity effects of a carbon tax in Ireland concluding that a tax would be regressive,
costing the poorest households €3 euro per week while only costing the richest €4 per week.
Compensation through social welfare payments was cited as a mechanism of redress;
however, this would seem an unlikely course of action in the current economic climate.
Public Acceptability of carbon taxation has also been researched in recent years
(Agrawal et al., 2010, Bristow et al., 2010). Agrawal (2010) found that up to 50% would
support some form of environmental taxation. Individuals with environment or
pro-government attitudes tended to be most likely to support these measures. This is a very high
acceptance rate, taking into account most individual’s aversion to new forms of taxation. In
Britain, Bristow et al. (2010) carried out similar research to determine societal attitudes
towards carbon taxation. This paper used a stated preference model to determine individual’s
attitudes to carbon taxation and carbon trading. This study predicted up to 70% acceptability
of taxation under a number conditions. Acceptability of carbon taxation falls to under 50%
when the proceeds of the tax are not explicitly stated by the Government. In contrast,
acceptability of carbon trading was found to be as high as 80% is some cases in this study.
3
2. DATA SOURCE AND STUDY AREAS
The primary data used in this research are taken from a subset of the Census of Population,
2006, which tabulates 1,834,472 individual travel-to-work trips of persons over the age of 15
and working for payment or profit and includes 32 separate variables detailing a number of
travel specific and socio-economic characteristics (CSO, 2006). The census data used in this
study does not include income levels. Variables such as socio-economic group are used in
this study as a proxy for income.
The two study regions are examined in this paper the WBR and the Dublin region.
According to the Census of Population, 2011 the population of the Dublin region was
1,187,176 persons (CSO, 2011). The population of the WBR region was 698,971 persons in
2011. Aside from the rural-urban differential, the geographical size of each region differs
significantly. Dublin is a small densely populated region with covering 921 km
2, while the
rural WBR is a much larger sprawling region covering 25,700 km
2. The geographical spread
of these regions is illustrated in Figure 1. From transportation perspective the main difference
between the WBR and Dublin is that 62% of those living in the WBR drive to work alone on
a regular basis compared to 49% in Dublin.
Figure 1: Dublin and WBR Regions
3. Personal carbon trading scheme
In order to estimate the average annual emissions, the emissions per trip had to be calculated.
This was estimated by multiplying the distance travelled by an emissions factor (specific to
each mode) and then adjusted for vehicle occupancy. McNamara and Caulfield (2011a)
describe the approach used to estimate emissions in greater detail. The PCTS follows a cap
and share approach. Under this scheme the average annual emissions for individuals daily
commute was calculated. This was found to be 2.5kg of CO
2. The scheme would allocate a
free quota of 2.5kg of CO
2for each commuting trip, and individuals that emit more that this
would have to purchase a carbon quota from individuals that emit less than their own quota.
This 2.5kg of CO2 is called the carbon cap.
The effect of imposing a cap on individuals is presented in Table 1. This shows the
percentage of commuters who would fall above and below a cap in each study region. A cap
based on average national emissions would leave 11.2% of commuters above the cap in
Dublin, much lower than the national average of 26%. In the WBR, the cap would result in
33.5% of commuters falling above the cap. The percentage share of individuals in the WBR
above the cap at both levels is therefore significantly higher than the National and Dublin
datasets.
Table 1: Division of individuals above the cap
4. Welfare Analysis
The welfare estimation is also be subject to a scenario analysis based on a low, medium and
high CO2 prices. The prices chosen are listed in Table 2 and are determined based on
historical European Union Allowances market prices. The historical low, high and current
prices of allowances in September 2011 are used in this analysis
2.
Table 2: CO
2price in each market scenario
Travel Cost Calculations
To determine the pre-PCTS and post-PCTS cost of travel for commuters, travel cost
equations are used. The equations estimate the cost of travelling by slow modes (walking and
cycling), private vehicle (car, motorcycle, van) and by public transport (bus and rail) in
Ireland. To determine the pre-PCTS and post-PCTS travel costs for commuters, travel cost
equations are used (Steer Davies Gleave, 2009). These equations estimate the cost of
travelling by walking, cycling, private vehicle and public transport in Ireland. The parameters
vary across three separate peak time periods in which a commuter undertakes a trip: 7-8AM,
8-9AM and 9-10AM. Parameters are related to distance travelled, travel time, public
transport fares and tolls occurring in daily trips for three types of commute trips: slow mode
trips (walk and cycle), private vehicle trips (car, motorcycle, van) or public transport (bus and
train). The parameters used in this paper are detailed in Table 3. These parameters are then
inputted into cost equations 1-7 to determine each individual’s commute trip cost.
Table 3: Travel Parameters used
The pre-PCTS travel cost equations for slow modes, private vehicles and public transport are:
Slow Modes
5
Public Transport
Distance is calculated in km and trip time is calculated in minutes using the census data.
Public transport (PT) fare is the cost of a public transport ticket and value of time (VOT) is
the value of time to commuters. The value of time is calculated by the Irish National
Transport Authority as €9.476 per hour in 2006 prices. Speeds for slow modes are assumed to
be 5kph for walking and 15kph for cycling. Toll costs do not apply for commute trips in the
rural WBR, as no trips would have incurred a toll in this region at the time of the census in
2006. Toll trips in the DMR are averaged at €0.23 per trip (NTA, 2010). These cost equations
include for CO2 in the post-PCTS price of travel (P2). The price of CO2 per trip is determined
using market values. Post-PCTS travel costs are determined using pre-PCTS cost equations
(Equations 1-7) and adding the monetary cost of CO
2. That is:
Pre-costs are the travel costs calculated for the various modes and travel times and PCO
2is
European Union Allowances market CO
2price (Pointcarbon, 2011). This price is varied to
investigate any welfare changes in the event of a fluctuating market price. The results for the
travel cost calculations are presented in Table 3. As each individual is given an equal quota of
CO2 permits in a PTCS, individuals under the quota can theoretically reduce their travel costs
by selling their surplus permits. This opportunity cost is included for in the calculation of
post-PCTS travel costs and subsequent welfare changes. This free allocation of permits acts
as a compensation mechanism to individuals who use more sustainable forms of transport.
The higher the price of CO
2,the greater the potential monetary benefits to individuals holding
surplus permits.
Table 4: Average travel costs
Measuring Consumer Surplus Change
In determining any welfare loss to commuters a consumer surplus analysis is used. Consumer
surplus measures the difference between what a consumer is willing to pay and what is
actually paid for a good. If the price that is paid is below what an individual was willing to
pay, the individual attain a consumer surplus. For a more detailed description on consumer
surplus see Harberger (1971) Willig (1976) or Slesnick (1998).
Using consumer surplus is a useful tool in measuring the
change
in welfare as
opposed to welfare levels before or after a change in market conditions. Using price levels
before and after the policy is introduced, the relative change in welfare can be determined
using a consumer surplus analysis as a proxy for welfare changes to compare across various
socio-economic groups.
As the varying factor between the pre-PCTS and post-PCTS travel cost is the CO
2price, individuals who maintain a surplus of CO2 permits within will experience an increase
in consumer and a welfare gain. Individuals with a deficit of CO2 permits within the market
will experience a CS decrease and welfare loss (and produce a negative coefficient). The
equation to calculate the change in consumer surplus (ΔCS) is as follows:
P
1is the pre-policy price of travel and P
2iare the post-policy prices. β
Piis the price elasticity
of demand for travel and G
iis the consumption of CO
2. If consumer surplus is found to be a
negative, a welfare loss has occurred and vice versa. Zero represents no change in welfare.
The size of the numeric figure found is the magnitude of the change in purchasing power for
travel of the individual. Since permits in a PCTS scheme are allocated freely, the opportunity
cost of selling surplus permits to the market is also reflected in consumer surplus changes.
Individuals using more sustainable forms of transport can benefit to a greater extent than
those who use less sustainable forms of transport by selling excess permits. McNamara and
Caulfield (2011b) also used this approach to determine the impacts of deprivation and density
on changes in consumer surplus as a result of a PCTS. One of the assumptions of this
analysis is that those with excess permits will sell these permits and enjoy their consumer
surplus. This is an area that warrants further research, but for the purposes of the research
presented in this paper the authors have assumed that individuals are rational utility
maximises and will sell these excess papers.
5. Descriptive Statistics for the Welfare Model
7
increase to -0.07 nationally and -0.09 in the WBR. In contrast Dublin falls slightly to zero
with high price scenario indicating a negligible overall welfare changes in the region.
Table 5: Consumer surplus results
6. Spatial Distribution of Welfare Changes
As the census dataset also provides unique geographical codes for each individual, the results
can be transposed geographically using GIS software. This provides an additional layer of
results as a means of comparing welfare changes across the study regions. Aggregated
consumer surplus changes are calculated for over 3,400 electoral division’s in each CO
2price
scenario and presented in this section. Electoral division’s coloured coded as dark blue
experience aggregate welfare gains from the introduction of a PCTS, while electoral
division’s colour coded light blue and green experience small welfare losses. Electoral
division’s colour coded yellow, orange and red experience the largest welfare losses.
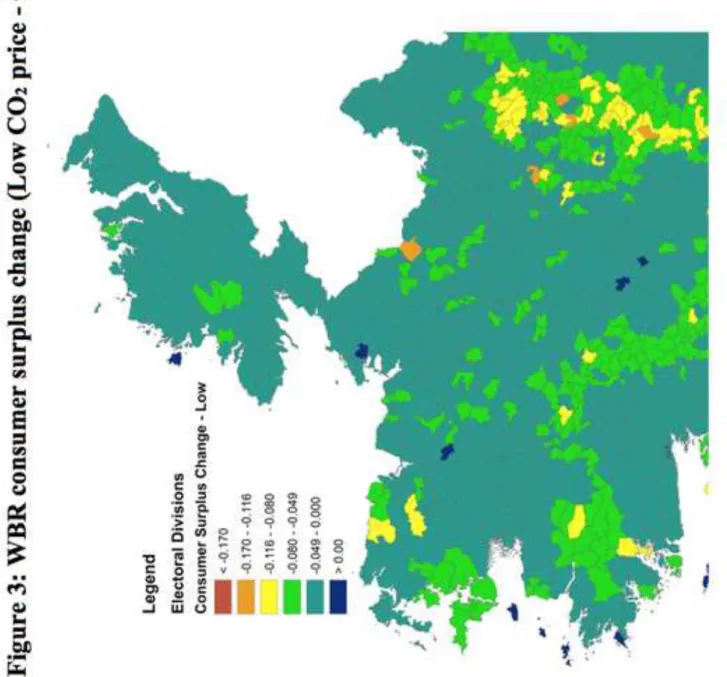
In the low CO2 price scenario illustrated in Figure 2, losses are minimal across the
country. The largest losses of any occur in the WBR, Midlands and Dublin commuter belt
regions. Looking at the study regions more closely reveals contrasting welfare changes
between Dublin and WBR. Figure 3 shows the majority of electoral division’s in WBR
experience an aggregate loss, albeit a minimal loss represented by electoral division’s colour
coded light blue. A small minority of isolated rural electoral division’s experience larger
losses coloured coded orange and yellow. The Dublin region in contrast experiences an
aggregate welfare gain in Figure 4. The vast majority of electoral division’s in the region
experience a gain aside from a number of electoral division’s in the north of the region which
experience a marginal loss.
Figure 2: National consumer surplus change (Low CO
2price -
€8.24)
Figure 3: WBR consumer surplus change (Low CO
2price -
€8.24)
Figure 4: Dublin consumer surplus change (Low CO
2price -
€8.24
)
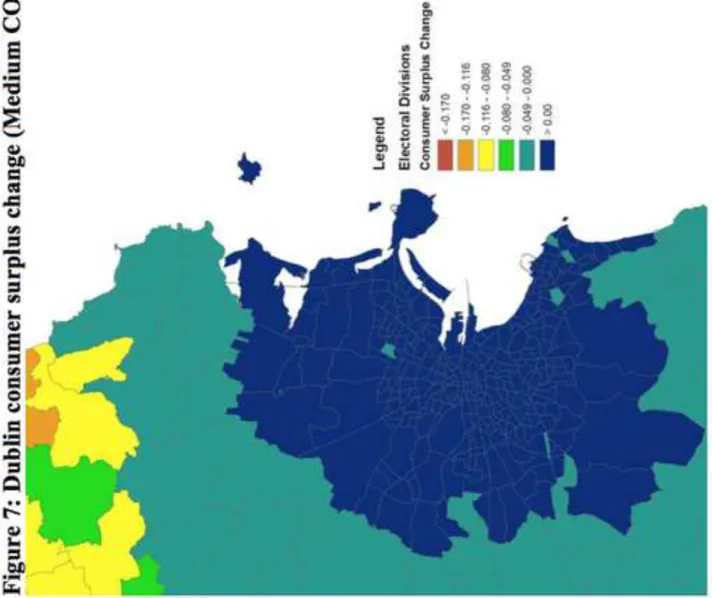
In the medium price scenario, considerable differences in welfare changes are evident
nationally and in the WBR compared to the low price scenario. Figure 5 illustrates the
regions experiencing the largest losses are rural regions in the WBR and the Dublin
commuter belt. Figure 5 shows larger welfare losses occurring in electoral division’s greater
distances from urban centres in the WBR. Welfare changes in Dublin (Figure 7) remain as
they were observed in Figure 3, with the vast majority of electoral division’s in the region
experiencing an aggregate welfare gain excluding a number of E electoral division’s in the
north of the county which experience marginal losses.
Figure 5: National consumer surplus change (Medium CO
2price -
€16.70)
Figure 6: WBR consumer surplus change (Medium CO
2price-
€16.70)
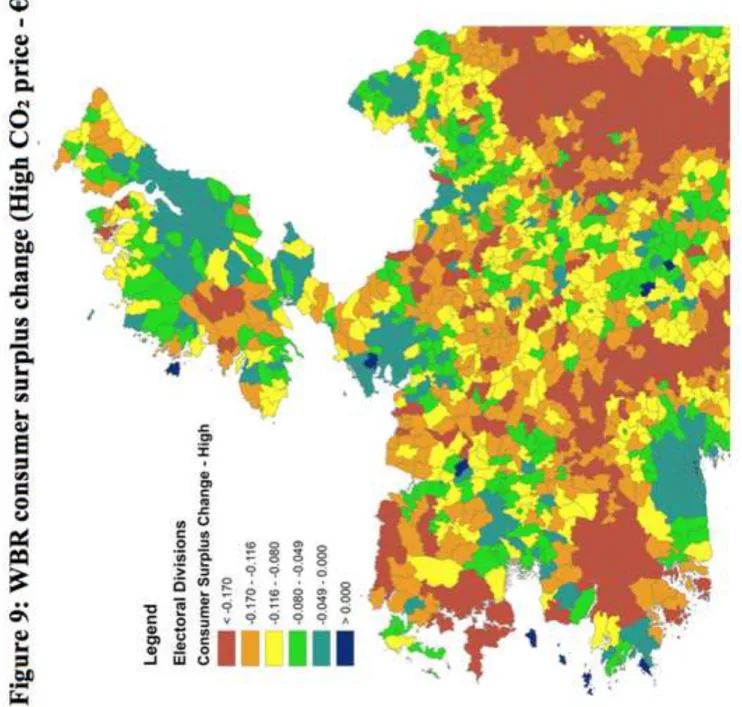
Figures 8 to 10 illustrate a clear outcome of larger welfare losses in electoral divisions farther
from major urban centres in a high CO2 price scenario. Electoral division’s encompassing the
major urban centres of is found to have welfare gains with the advent of a PCTS. A pattern of
concentric rings around these urban centres is also visible in each figure as welfare gains
convert into losses the greater the distance from urban centres. Figure 10 again shows no
change in welfare in Dublin compared to the low and medium price scenarios save for the
aforementioned electoral division’s in the north of the county which experience marginal
welfare losses.
Figure 8: National consumer surplus change (High CO
2price -
€28.73)
Figure 9: WBR consumer surplus change (High CO
2price -
€28.73)
Figure 10: Dublin consumer surplus change (High CO
2price -
€28.73)
This GIS analysis confirms the urban-rural divide in the welfare results. Dublin is found to
experience a welfare gain on aggregate in a PCTS under all CO
2price scenarios, while large
swaths of the WBR experience aggregate losses in each scenario.
7. Socio-economic analysis of welfare results
This analysis will model for four welfare outcomes using MNL models. Welfare changes for
the dependent variable are categorised as ‘positive’ or ‘negative’ in the model under four
categories detailed in Table 6. These welfare changes, measured by changes in consumer
surplus, are then regressed on a number of socio-economic variables to determine the factors
that contribute to individuals having a negative or positive change in consumer surplus and
consequently welfare.
Table 6: Details of consumer surplus variable
Multinomial Logit Regression Model Formulation
Six models are estimated in this section; a national, a Dublin and a WBR model, each with a
low, medium and high CO2 price scenario. Five variables are chosen as independent variables
in the model. The age, gender, socio-economic group, household and residential density are
examined in the MNL models. The constituent groups of these variables are detailed in Table
7. The dependent variable categories are ‘large negative change’, ‘marginal negative change’
and ‘marginal positive change’. The reference category is the ‘positive change’.
The
outcomes for the dependent variable are predicted vis-à-vis the reference category ‘positive
change’ as defined in Table 7.
The MNL model takes the following functional form. Consider an event Y, which in
this case is an individual emitting CO2 above a predetermined cap. The probability of a
person being above this cap is P(Y) in the model and the resulting outcome is equal to one.
The dependent variable is the log of the odds ratio of the event Y occurring or the logit of Y.
That is:
9
independent variables (
X
i,
i
= 1,…,n).
ˆ
Y
is the predicted probability of the event which takes
binary values of 1 (continue analysis) or 0 (stop the analysis).
Table 7: Details of variables examined
MNL Regression Results in a Low CO2 Price Scenario
The results presented in Tables 8 to 10 are estimated for the national, Dublin and WBR
datasets based on a low CO2 price scenario of €8.24. The reference category in all cases is a
‘positive change’ in consumer surplus and all outcomes are predicted vis-à-vis this category.
The performance of each model shows the national model to be the best fitted model.
R-squared value for the national model of 0.16 is the largest of the three models The Dublin and
WBR datasets yield R-squared values of 0.043 and 0.86 respectively. The WBR model does
yields the lowest log-likelihood despite the lower R-squared value observed.
The age category has a significant effect on the outcomes of having a large negative
change (LNC) and a marginal negative change (MNC) in comparison to having a positive
change both nationally, in the WBR and to a lesser extent in Dublin. Nationally the groups
most likely to have a LNC are younger age groups particularly the 25-44 age group. This is
also the case in the WBR. The Dublin model returns lower beta coefficient for all groups and
all are insignificant outside of the aforementioned 25-44 group. This age group is also likely
to experience a MNC and marginal positive change (MPC) nationally and in Dublin. All age
groups with a positive welfare change in the WBR are insignificant in the model as the
previous sections have shown very few individuals experience a welfare gain in this region in
any scenario. The number of cases therefore is not sufficient to merit statistical significance.
In terms of gender, the odds of having a LNC as opposed to positive welfare change are
increased by being male in all three datasets, particularly in the WBR. This is also the case
for individuals having a MNC in Dublin and the WBR. Individuals with a MPC are more
likely to be females in all three models.
The results for the socio-economic variable are less conclusive. Many categories
within this variable are likely to have both positive and negative consumer surplus changes.
Employers and managers and higher and lower professionals are the only groups likely to
have a LNC and a MNC across all three models. This may be due to higher income levels
within these groups and the use of less sustainable modes of transport. Semi skilled and
unskilled groups are unlikely to have a negative change in the national and WBR models, but
are in Dublin. However, these groups are also unlikely to have a positive change yielding an
inconclusive result. Farmers and agricultural worker are unlikely to have a negative change in
consumer surplus across each model except in Dublin where they are likely to have a MNC.
Table 8: MNL model results (National Dataset: Low CO
2price -
€8.24
)
Table 9: MNL model results (Dublin Dataset: Low CO
2price -
€8.24
)
Table 10: MNL model results (WBR Dataset: Low CO
2price -
€8.24
)
MNL Regression Results in a Medium CO2 Price Scenario
This section presents the MNL model results for the medium CO
2price scenario of €16.70.
Tables 11 to 13 detail the findings of the MNL for the national, Dublin and WBR datasets.
Model performance is improved on the low CO2 price model. R-squared values increase to
0.13 for the national dataset, but remain static at 0.043 and 0.086 for the Dublin and WBR
models respectively. The WBR model maintains the smallest log likelihood value.
For the age variable, as was the case in the low CO2
price scenario, age groups
ranging from 25-44 are most likely to have a negative consumer surplus change. However,
this is not the case in Dublin where all but one of the outcomes for the LNC was found to be
insignificant. The gender variable follows the same trend as was observed in the low CO
2price scenario with males being more likely to have a negative consumer surplus change than
females. Females are also more likely to have a positive consumer surplus change than males
across all three models.
Socio-economic groupings again yield inconclusive results beta coefficients smaller
than those observed in the low CO2 price scenario. Nationally and in the WBR, farmers and
agricultural workers are the most likely groups to avoid having a negative consumer surplus
change. The likelihood of employers, managers and professionals having a LNC also falls in
comparison to the low price scenario in all three models. No group is likely to have a positive
consumer surplus change nationally or in the WBR. Manual skilled workers are the only
group likely to have a positive consumer surplus change in Dublin. However, this result is
statistically insignificant and therefore inconclusive.
The household composition variable returns more conclusive results than in the low
CO2 scenario. Nationally and in the WBR, all groups in this variable are likely to be to have a
negative change (LNC and MNC). However, individuals living in Dublin have a much
smaller likelihood of having a LNC. Couples with dependent children in Dublin are also
marginally unlikely to have a positive welfare change. Nationally and in the WBR,
individuals with dependent children are the likeliest group to have a positive welfare change.
However the associated coefficients are smaller than those observed in the Dublin dataset.
Single individuals are likely to have a positive change. In Dublin, single individuals with a
positive consumer surplus change and are more likely to have positive welfare change than a
MPC. The results indicate that individuals with dependent families are more likely to
experience welfare losses. Again the density variable is highly significant across all three
models confirming the importance of population density in explaining welfare losses.
Table 11: MNL model results (National Dataset: Medium CO
2price -
€16.70
)
Table 12: MNL model results (Dublin Dataset: Medium CO
2price -
€16.70
)
11
Regression Results in a High CO2 Price Scenario
This section presents the MNL model results for the high CO2 price scenario of €28.73. The
MNL model results for this scenario are presented f§or the national, Dublin and WBR
datasets in Tables 14 to 16 respectively. Model performance improves from previous models
with R-squared values of 0.115, 0.089 and 0.155 for the national, Dublin and WBR models.
The WBR model maintains the lowest log-likelihood value.
The age category again indicates younger age groups to be more likely to have a
negative change in all three models. This is the case for 25-44 year old groups in Dublin and
the national model. In the WBR, 15-24 year olds are more likely to have a negative change
than older age groups. Older individuals are also more likely to have a positive change in
consumer surplus across all three models. 55-64 and 65+ age groups are more likely to have a
positive change than other outcomes particularly in the national dataset. The likelihood of
males having a negative consumer surplus change is also observed in this scenario. In all
three models males are more likely to have both a LNC and a MNC than females. Females
are also more likely to have a MPC than males.
Socio-economic group results do not vary greatly from the other two scenarios.
Nationally and in the WBR, farmers and agricultural workers are the most likely groups to
not have a negative consumer surplus change. This is not the case in Dublin where farmers
are the most likely group to have a LNC. The likelihood of employers, managers and
professionals having a LNC also falls in comparison to the low and medium price scenarios
in all three models. As was observed in the previous scenarios, non-manual, semi-skilled and
unskilled workers are unlikely to have a LNC across all three models with these grouping
more likely to have a positive consumer surplus change.
In all three models, household composition is found to be a significant factor in
determining welfare changes. The only exception to this is in Dublin where this variable is
found to be insignificant in explaining a LNC. All groups are likely to have a MNC across all
three models. In terms of having a positive consumer surplus change, all groups are unlikely
to have this outcome particularly couples with dependent children.
While the coefficients associated with the density variable are not as large as the low
and medium CO
2price scenarios, relatively larger beta coefficients in comparison to other
independent variables are found for the density variable. Across all three models individuals
living in electoral division’s with less than 50 persons per km
2are more likely to have a
negative consumer surplus change. Individuals with a positive welfare change are also more
likely to live in densely populated electoral divisions than those in sparsely populated
electoral divisions. Density is the most significant determinant of welfare changes in the high
CO
2price scenario.
Table 14: MNL model results (National Dataset: High CO
2price -
€28.73
)
Table 15: MNL model results (Dublin Dataset: High CO
2price -
€28.73
)
Table 16: MNL model results (WBR Dataset: High CO
2price -
€28.73
)
aged between 25 and 44 were also consistently the most likely individuals to have a negative
welfare change. This result is expected in a dataset detailing commute trip as the bulk of the
workforce is drawn from this age group. Socio-economic grouping was mostly inconclusive
in each scenario, with only non-manual and unskilled workers the most likely individuals to
have a positive welfare change in all scenarios. Employers and managers, higher
professionals and lower professionals were also consistently likely to have negative changes
in welfare in each scenario. Beta coefficients for individuals likely to have negative changes
were also consistently higher in the WBR compared to Dublin, indicating a greater likelihood
of losses in the rural region.
8. Impact of the research conducted
The research presented in this paper contributes the field of research in determining the
welfare outcomes of introducing a PCTS. This type of analysis had not been previously
completed using logistic regression techniques. Segmenting the analysis across
socio-economic groups and regions further strengthens the contribution to knowledge in using this
modeling technique. The use of a MNL model in determining the characteristics of
individuals with negative and positive welfare changes is also a contribution to the
knowledge in observing the socio-economic effects of a PCTS.
While studies have been conducted to determine the welfare effects of carbon trading,
this paper focused on identifying any divergences in welfare changes between urban and rural
regions. The divergences observed in the results highlight the importance of comparing the
effects of the policy in both regions and validate the research objective to study this aspect of
a PCTS outcome.
The results presented in this paper also have a number of practical policy implications.
The findings of inequity for individuals in rural regions would necessitate a heterogeneous
structure of a PCTS scheme to remedy theses potential outcome. This could involve an
increase of CO2 permit allocations for individuals constrained to using private vehicles as
their primary form of transport in rural regions. A price ceiling on CO2 within the market for
these vulnerable socio- economic groups could also provide a mechanism to ensure more
equitable welfare outcomes. A final measure to alleviate the burden on these groups would be
to incentivize and/or subsidise the purchase or environmentally friendly electric or hybrid
vehicles in rural regions where public transport alternatives are not a viable alternative. This
paper identified the equity problems and ambiguous environmental dividend associated with
existing carbon reduction measures such as carbon taxation and upstream trading. Therefore,
there is a necessity for further investigation of a downstream type scheme as an alternative
policy.
9. Conclusions
13
scheme whereby an individual with a surplus could theoretically benefit from selling excess
permits was reflected in the results. Walking, cycling and public transport trips were found to
generally reduce in cost with the introduction of a scheme. The higher the CO2
price, the
greater the benefit derived by individuals with excess permits was the key finding of this
section. The opposite was true for individuals using private vehicles to travel to work,
particularly in the WBR. Travel costs increased in the medium and high CO2 price scenarios
for these individuals in the WBR, but remained static for individuals in Dublin. This can be
attributed to the shorter travel distances in Dublin than the WBR. Mapping the welfare
changes using GIS across each electoral division also confirmed the largest losses occur in
rural regions greater distances from major urban centres.
A further socio-economic analysis using a MNL model compared the socio-economic
characteristics of individuals having a positive or negative welfare change. This analysis
confirmed that density of population was the major determinant of welfare changes as
individuals living in more sparsely populated areas were more likely to experience a negative
welfare change. Parameter coefficients associated with the density variable were significantly
larger than other independent variables included in the model. Deprivation levels were not as
statistically significant as density levels in Dublin or the national results but were of marginal
significance in determining negative welfare changes in the WBR. As was the case with the
BLR model results, individuals in the 25 to 44 year old age groups were likely to have a
negative welfare change. Males were also more likely to have a larger negative welfare
change than females possibly due to the higher percentage of males in the workforce in the
dataset.
Acknowledgements
The authors would like to thank the Central Statistics Office of Ireland and the National
Transport Authority for providing the data for this study.
References
AGRAWAL, A. W., DILL, J. & NIXON, H. 2010. Green transportation taxes and fees: A
survey of public preferences in California.
Transportation Research
Part D: Transport and
Environment,
15, 189-196
BRISTOW, A. L., WARDMAN, M., ZANNI, A. M. & CHINTAKAYALA, P. K. 2010.
Public acceptability of personal carbon trading and carbon tax.
Ecological Economics,
69,
1824-1837
BAUMOL, W. J. 1972. On Taxation and the Control of Externalities.
The American
Economic Review,
62, 307-322
CALLAN, T., LYONS, S., SCOTT, S., TOL, R. S. J. & VERDE, S. 2009. The distributional
implications of a carbon tax in Ireland.
Energy Policy,
37, 407-412
CSO, 2006. Census of Population of Ireland 2006 Place of Work Census of Anonymised
Records (POWCAR) User Guide.
In:
OFFICE, C. S. (ed.). Dublin, Ireland
CSO, 2011. The Preliminary Report for Census 2011.
In:
OFFICE, C. S. (ed.). Dublin,
EKINS, P. & DRESNER, S. 2004. Green taxes and charges: reducing their impact on
low-income households. Joseph Rowntree Foundation, York
EPA 2010. Ireland's Greenhouse Gas Emissions 2009. Dublin: Environmental Protection
Agency
PIGOU, A. C. 1952.
The economics of welfare
, Transaction Publishers
GOULDER, L. H. 1995. Environmental taxation and the double dividend: A reader's guide.
International Tax and Public Finance,
2, 157-183.
HARBERGER, A. C. 1971. Three basic postulates for applied welfare economics: an
interpretive essay.
Journal of Economic literature,
9, 785-797
MCNAMARA, D., CAULFIELD, B, Measuring the potential implications of introducing a
cap and share scheme in Ireland to reduce green house gas emissions,
Transport Policy
, 18,
2011a, p579 – 586
MCNAMARA, D., CAULFIELD, B., Determining the welfare effects of introducing a
cap-and-share scheme on rural commuters,
Transportation Research Part D: Transport and
Environment
, 16, 2011b, p547 - 553
NTA, 2010. Greater Dublin Area: Draft Transport Strategy, 2011 - 2030. 2030 Vision.
Dublin: National Transport Authority.
PEARCE, D. 1991. The Role of Carbon Taxes in Adjusting to Global Warming.
The
Economic Journal,
101, 938-948
POINTCARBON, 2011. Historical EUA spot prices, Dec 2011 Market. Retrieved from
Pointcarbon website, June – Sept. 2011. Website: www.pointcaron.com
STEER DAVIE GLEAVE. 2009. Highway and PT Assignment Model Calibration and
Validation Report. Dublin: National Transport Authority (Personal Communication)
SYMONS, E., PROOPS, J. & GAY, P. 1994. Carbon taxes, consumer demand and carbon
dioxide emissions: a simulation analysis for the UK.
Fiscal Studies,
15, 19-43
SOVACOOL, B. K. 2010. Building Umbrellas or Arks? Three Alternatives to Carbon Credits
and Offsets.
The Electricity Journal,
23, 29-40
SLESNICK, D. T. 1998. Empirical Approaches to the Measurement of Welfare.
Journal of
Economic literature,
36, 2108-2165
Table 7
Table 9
Table 11
Table 13
Table 15
Figure 1