• No results found

Computing Interfaces for Everyone

N/A
N/A
Protected

Academic year: 2020

Share "Computing Interfaces for Everyone"

Copied!
6
0
0

Loading.... (view fulltext now)

Full text

Loading

Figure

TABLE I: Averages numbers of employment ratio for theperiod 2008 to 2013, extracted from Labor Force Statistics– www.bls.gov
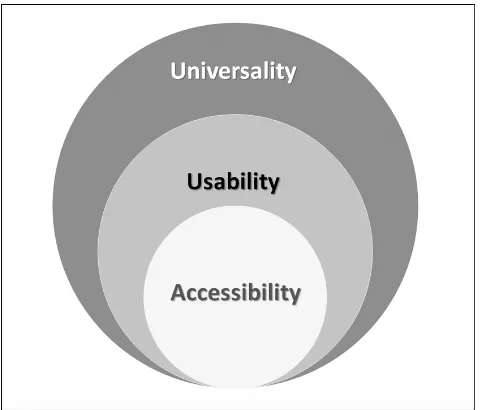
Fig. 2: Stacked Venn diagram shows overlapping relation-ships between accessibility, usability, and universality in asystem.

References

Related documents