Abstract—Maize (Zea mays) is known to have the highest yield of grain crops and provides resources for food, fodder, chemicals, and biofuel. As a major crop, its genetics is well studied and its genome has been sequenced. Moreover, maize has been used as a model C4 plant. However, few studies of its regulatory network of leaf development have been conducted, although the regulation of Kranz anatomy development by transcription factors (TFs) is crucial for understanding maize leaf development.
A previous study has obtained 22 time-course transcriptomes of leaf development, starting from dry seeds to hour 192 post imbibition, including gene expression profiles for 1574 maize transcription factors (TFs). This is an excellent dataset for investigating the transcriptome dynamics of leaf development.
In gene regulation, different time frames correspond to sets of genes that participate in different biological functions. Biclustering is a technique which allows simultaneous clustering of gene expression profiles and developmental times; hence, it provides a better way for identifying genes with multiple functions.
We made use of the biclustering analysis tool, BiGGEsTS, to cluster the gene expression profiles of the 1574 maize TFs, revealing the process of maize leaf development features. A web-based service was set up to provide the results of our analysis.
Index Terms - Maize; Transcription factor; NGS; Time course microarray, Biclustering algorthm
The work of Chien-Hung Huang is supported by the grant of MOST 105-2221-E-150-063.
Declarations. The source of funding for publication is supported by the Ministry of Science and Technology of Taiwan (MOST) under grant MOST 105-2221-E-15-063.
The works of Ka-Lok Ng, Jin-Shuei Ciou, and Jeffrey J. P. Tsai are supported by the grant of MOST 105-2632-E-468-002. The work of Ka-Lok Ng is also supported by the grant of MOST 105-2221-E-468-016
Jin-Shuei Ciou, Erwandy Lim and Jeffrey J.P. Tsai are with the Department of Bioinformatics and Medical Engineering, Asia University, Taiwan 41354. (e-mail: [email protected], [email protected], [email protected]).
Wen-Hsiung Li is with Biodiversity Research Center, Academia Sinica, Taipei, Taiwan (e-mail: [email protected]) The work is supported by Academia Sinica (AS-106-TP-B14). Nilubon Kurubanjerdjit is with the School of Information Technology, Mae Fah Luang University, Chiang Rai, Thailand 57100 (e-mail: [email protected]).
†Corresponding author, Chien-Hung Huang is with the Department of
Computer Science and Information Engineering, National Formosa University, Taiwan (e-mail: [email protected]). Ka-Lok Ng*, corresponding author, is with the Department of Bioinformatics and Medical Engineering, Asia University, Taiwan. Department of Medical Research, China Medical University Hospital, China Medical University, Taiwan (e-mail: [email protected]).
I.
I
NTRODUCTIONaize(Zea mays) is one of the most important grain crops in the world and, together with rice and wheat, provides food to more than half of the world population. It is also a key ingredient in animal feedstock. The demand for maize has increased in recent years because of its increasing use in the bio-energy industry. Moreover, maize is an outstanding model for research on seed development, and as a model system to study diverse biological phenomena, including transposons, paramutation, heterosis, imprinting and genetic diversity and allelic richness[1].
The expression dynamics of maize genes during leaf development have been studied. For instance, dramatic differences were found in the transcriptomes of the base of developing leaves with genes encoding enzymes involved in cell-wall biosynthesis, cell division, cellulose synthesis and auxin signaling and the tip was enriched in genes involved in photosynthesis and sugar metabolism/transport of developing leaves [2]. Pick’s study [3] suggested that the Ala and
Aspamino acids play an important role for metabolites shuttle between mesophyll and bundle sheath in maize leaves. Wang et al. [4] investigated the transcriptomes from maize foliar (with Kranz anatomy) and husk leaves (without Kranz anatomy) to identify cohorts of genes associated with procambium initiation and vascular patterning. Also, their work provides clues for finding possible key regulators of Kranz anatomy [4]. A more recent study examined maize earlier leaves developmental stages, embryonic leaf primordia of different times and displaying different levels of Kranz structure (KS) differentiation; the data provides an opportunity for hypothesizing the regulatory actions of KS development [5].
Liu et al. [5] showed that the expressed profiles of 1,238 maize TF genes can be classified into 16 co-expression clusters, which show the functional transition and gene expression pattern over a period of 72 hours.
Traditional clustering algorithms (e.g., K-means, hierarchical clustering) perform clustering based on one feature; for instance, those methods identify gene clusters under a given condition. Many clustering approaches have been proposed for the analysis of gene expression data, but the results from the application of traditional clustering methods are limited. In reality, genes bear different functions under different conditions or times. In order to measure the similarity between gene expression levels under different conditions, biclustering algorithms were employed in the present analysis.
GEMtf - Database of Time-course Expression
Profiles of Maize Transcription Factors by
Using Biclustering Algorithm
Jin-Shuei Ciou, Erwandy Lim, Chien-Hung Huang
†, Nilubon Kurubanjerdjit, Wen-Hsiung Li, Jeffrey
J.P. Tsai, Ka-Lok Ng*, Member, IAENG
Biclustering algorithms that specifically perform simultaneous clustering on the row and column dimensions of the data matrix have been proposed for biological data analysis [6]. Traditional clustering algorithms apply respectively to either the rows or the columns of the gene expression profiles, but biclustering performs clustering in these two dimensions simultaneously. This means that the traditional clustering approach derives a global model, while biclustering produces a local model to identify subgroups of genes and subgroups of conditions, by performing simultaneous clustering of both rows and columns of the gene expression profiles (Figure1).
Biclustering on biological applications have been applied in many studies. Gu and Liu [7] developed a Bayesian biclustering model (BBC) that can correctly evaluate diverse clusters of gene expression data and achieved a Gibbs sampling procedure for its statistical inference, such as enrichments of gene functions and transcription factor binding sites (TFBSs) in the relevant promoter sequences. Eren et al. [8] provided an excellent review on a collection of biclustering methods on analyzing gene expression data matrices. Yu et al. [9] combined the TFs’ up and down expression signatures with the Gene Ontology (GO) annotations and the TF promoter motif contents to predict novel TFBSs and new TF–TFBS pairs in the maize genome.
The present work constructed a web site that utilizes a visualization interface to help researchers to view sets of time-course profiles for TF genes involved in the maize leaf development. To the best of our knowledge, this database is the first comprehensive database on the time-course expression profiles for maize TFs.
II.
M
ATERIALS&
M
ETHODSA. Materials
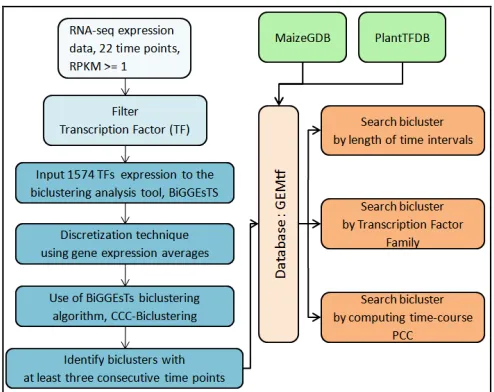
This study made use of the expression profiles of the 1574 TFs involved in maize leaf development, where the data were obtained from the Supplementary Dataset S1 file in Ref. [9]. To understand the regulation of the TFs in maize Kranz anatomy, they obtained 22 time-course transcriptomes of maize leaves developing from dry seeds to 192 hours post imbibition. Pair-end sequenced data were conducted by using the Illumina HiSeq 2000 machine. The RPKM(reads per kilobase of transcript per million mapped reads) values of gene expression were normalized, and kept RPKM value is ≥1 in at least 2 of the 22 time points in our analysis [9]. TFs in this category may play a key role in the differentiation of vascular cells and the development of Kranz anatomy.
[image:2.612.314.561.47.243.2]The workflow of the present is depicted in Figure 2.
Figure 2. Workflow of the present study
B. Methods
In order to determine whether certain genes showed a similar trend between column and column values for the time-course profile matrix, we applied biclustering algorithms.
The traditional clustering algorithms assign the same weight to genes and into one single function grouping when processing expression data. In reality, however, many gene products are known to have more than one function, which means that a group of genes show similar expression profiles across a time interval.
Biclustering was developed originally by Hartigan in 1972 [10], which proposed a method for clustering cases and variables in the same step. The term biclustering was also used by Mirkin in 1996 [11] as a kind of output clustering structure. Furthermore, the biclustering algorithm was applied to study the gene expression profiles of Saccharomyces cerevisiae cell cycle and human B-cellin 2000 [12]. The work of Ref. 12 modeled the expression matrix with a block and a score called the mean-squared residue to measure the coherence of genes and conditions in the block [12].
Let G’ and S’ denote the subsets of genes and samples. The pair (G’,S’) specifies a sub matrix with the mean-squared residue score, defined by [12],
where
cardinality of G' and S'.
A sub matrix is called a -bicluster if H(G',S') for some . A low mean-squared residue score together with a large variation from the constant suggests a good criterion for identifying a block [12].
Madeira et al. proposed the CCC-Biclustering algorithm [13], a discretization method based on transitions between time points, which obtain better results than those using absolute values for biclustering time-course gene expression data(Figure1).
C. Parameters
This study used a biclustering tool, named BiGGEsTS [14]. BiGGEsTS can annotate the dataset genes in terms of the Gene Ontology for certain organisms, such as Saccharomyces cerevisiae, Oryza sativa, Arabidopsis thaliana, but maize annotation is currently not available.
RNA-sequses sequencing technologies to measure the level of gene expression. The quantity named reads per kilobase per million (RPKM) was proposed in 2008 by Mortazaviet et al. [15] to measure the level of gene expression. The definition of RPKM is given by:
The TF genes with their corresponding RPKM values larger or equal to one were imported into BiGGEsTS, which utilized the biclustering algorithm, CCC-Biclustering [13, 16], to filter biclusters with at least three consecutive time points (window size of 3).
III.
R
ESULTSA. Raw data search
The bicluster results were recorded in a database, named Genome-wide Expression Patterns of Maize Transcription Factor (GEMtf), which is accessible at http://ppi.bioinfo.asia.edu.tw/MaizeBase/. GEMtf includes the complete time-course gene expression profiles, and sort (A through Z) each column, search keyword by gene ID, TF family, or time-course intervals (Figure 3).
A total of 6543 biclusters were obtained, including the following five categories:
(i) time-course gene expression profiles of biclustering (BiGGEsTS label: Real Valued matrices),
(ii) discrete gene expression of biclustering (BiGGEsTS label: Discrete-Valued matrices),
(iii) graph contains curves of gene expression of biclustering (BiGGEsTS label: Graph by Real Valued matrices),
(iv) graph contains curves of full time-course gene expression of biclustering (BiGGEsTS label: Graph by Whole Real Valued matrices), and
(v) graph contains curves of discrete gene expression of biclustering (BiGGEsTS label: Graph by Discrete Valued matrices).
[image:3.612.315.569.49.309.2]The information was recorded in GEMtf.
Figure 3. GEMtf web page for raw data search
B. Search bicluster by length of time points
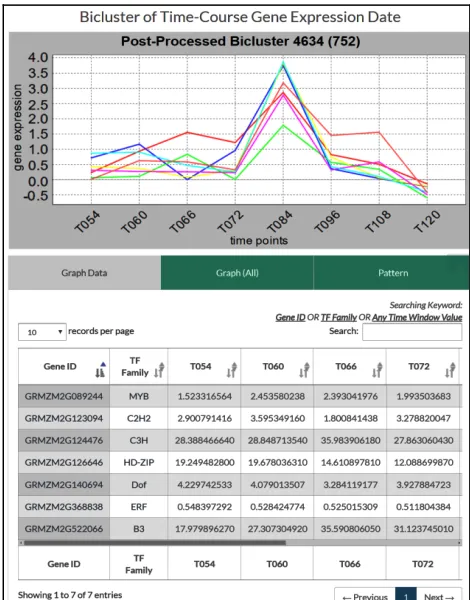
The main function is the length of time points can be selected by user, and then choose time frame that the user was interest. To show the bicluster details on the web page, user can visualize the time expression profiles. User can click the “Graph (All)” box to view the expression profiles for all the 22 time points (Figure 4).
[image:3.612.322.557.419.719.2]The length of time points is 3 to 22. After selecting the length, it will automatically display the corresponding expression profiles corresponding to the input time frame. Figure 5 illustrates the results of a bicluster (id=752) using eight time points, i.e. a time frame from T054 to T120.
Figure 5. GEMtf– gene expression profiles of all the 22 time points of a bicluster (id = 4634)
C. Search bicluster by Transcription Factor Family
When biologists interested in some of the TFs, this feature helps them to identify those TFs [17] belong to a specific group of biclusters. Users can also filter out specific information by selecting the TF family, Gene ID of TF family and length of time interval. The genes found in the biclusters may help to dissect the roles of the TFs in maize leaf development.
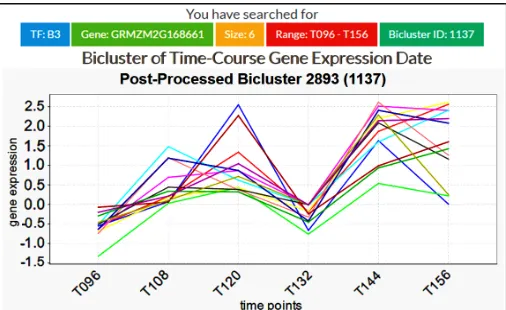
[image:4.612.48.301.454.609.2]Figure 6 depicts the results from ‘Graph of bicluster’ that show the oscillatory gene expression behavior for a TF family (Arabidopsis best hit: transcription factor B3 family protein) i.e. down-regulated at time T132, and then up-regulated at time T144. A more detailed understanding of this pattern remains to be examined by the biologists.
Figure 6. GEMtf web page for the oscillatory gene expression behavior for a TF family, i.e. transcription factor B3 family protein.
D. Search for similarTFexpression patterns
Biologists can upload their own experimental data to the server and compare the time-course biclusters in the server. GEMtf had already computed and saved the average time-course gene expression profile for each bicluster, and each bicluster that has an average time-course profile is used to compare with the up loaded time-course data by computing the Pearson Correlation Coefficient (PCC).
GEMtf will report the PCC scores for the upload data and biclusters with the same number of time points, ranging between T000 and T192. This service could possibly help biologists to quickly identify novel TFs with similar time-course profiles for their own experimental measurements.
IV. DISCUSSION
The tool, GEMtf, is set up by using time-course NGS gene expression profiles for maize leaf development and 6543 biclusters were identified. By integrating those pieces of information, GEMtf provides a tool to show the results of biclustering analysis and provides data query. User can input a fixed length of time-course expression vector, and GEMtf provides an online service, which computes the PCC values between the input vector and the average expression profile of biclusters with the same length of time interval. A large PCC value suggests that the query gene exhibits similar behavior to certain TF families; hence hidden biological function is detected.
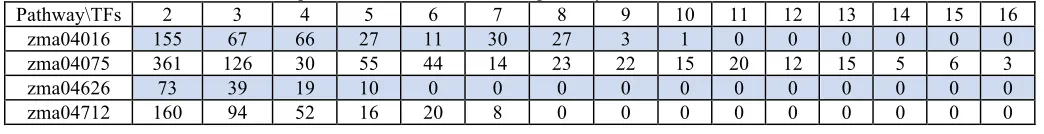
To examine the roles of TFs in maize, we compare the biclusters’ TFs with the maize pathways collected from the KEGG GENOME T01088database. Among the 134 pathways in the database, four pathways are associated with at least five TFs. These four pathways are: MAPK signaling pathway (zma04016), plant hormone signal transduction (zma04075), plant-pathogen interaction(zma04626) and circadian rhythm (zma04712). Table 1 summarized the number of biclusters compose of two to 16 TFs found in the KEGG T01088 database.
It is known that growth hormones are important biomolecules that regulate plant development. Shin et al., [18] has reported that once the MYB77 gene knockout, the expression level of auxin response factors (ARFs) gene is dramatically suppressed. Both of light and TFs influence every major developmental transition process like the plant hormone [19], this suggested that the ‘Plant Hormone Signal Transduction Pathway’(zma04075) consists of a larger number of TFs found in the biclusters.
In summary, our GEMtf results showed that the bicluster method is capable of identifying co-expressed TFs for time-course RNA-seq data. The database provides an easy means of investigating the regulatory role of TFs for maize leaf development.
REFERENCES
[1] J. L. Bennetzen and S. Hake, Handbook of Maize Genetics and Genomics. New York: Springer, 2009.
[2] P. Li, L. Ponnala, N. Gandotra, L. Wang, Y. Si, S. L. Tausta, et al., "The developmental dynamics of the maize leaf transcriptome," Nat Genet, vol. 42, pp. 1060-7, Dec 2010.
[3] T. R. Pick, A. Brautigam, U. Schluter, A. K. Denton, C. Colmsee, U. Scholz, et al., "Systems analysis of a maize leaf developmental gradient redefines the current C4 model and provides candidates for regulation," Plant Cell, vol. 23, pp. 4208-20, Dec 2011. [4] P. Wang, S. Kelly, J. P. Fouracre, and J. A. Langdale,
[5] W. Y. Liu, Y. M. Chang, S. C. Chen, C. H. Lu, Y. H. Wu, M. Y. Lu, et al., "Anatomical and transcriptional dynamics of maize embryonic leaves during seed germination," Proc Natl Acad Sci U S A, vol. 110, pp. 3979-84, Mar 5 2013.
[6] S. C. Madeira and A. L. Oliveira, "Biclustering algorithms for biological data analysis: a survey," IEEE/ACM Trans Comput Biol Bioinform, vol. 1, pp. 24-45, Jan-Mar 2004.
[7] J. Gu and J. S. Liu, "Bayesian biclustering of gene expression data," BMC Genomics, vol. 9 Suppl 1, p. S4, 2008.
[8] K. Eren, M. Deveci, O. Küçüktunç, and Ü. V. Çatalyürek, "A comparative analysis of biclustering algorithms for gene expression data," Briefings in Bioinformatics, vol. 14, pp. 279-292, May 1, 2013 2013.
[9] C. P. Yu, S. C. Chen, Y. M. Chang, W. Y. Liu, H. H. Lin, J. J. Lin, et al., "Transcriptome dynamics of developing maize leaves and genomewide prediction of cis elements and their cognate transcription factors," Proc Natl Acad Sci U S A, vol. 112, pp. E2477-86, May 12 2015.
[10] J. A. Hartigan, "Direct Clustering of a Data Matrix," Journal of the American Statistical Association, vol. 67, pp. 123-129, 1972/03/01 1972.
[11] M. Levin, "B. Mirkin, Mathematical Classification and Clustering," J. of Global Optimization, vol. 12, pp. 105-108, 1998.
[12] Y. Cheng and G. M. Church, "Biclustering of expression data," Proc Int Conf Intell Syst Mol Biol, vol. 8, pp. 93-103, 2000.
[13] S. C. Madeira, M. C. Teixeira, I. Sa-Correia, and A. L. Oliveira, "Identification of regulatory modules in time series gene expression data using a linear time biclustering algorithm," IEEE/ACM Trans Comput Biol Bioinform, vol. 7, pp. 153-65, Jan-Mar 2010.
[14] J. P. Goncalves, S. C. Madeira, and A. L. Oliveira, "BiGGEsTS: integrated environment for biclustering analysis of time series gene expression data," BMC Res Notes, vol. 2, p. 124, 2009. [15] A. Mortazavi, B. A. Williams, K. McCue, L. Schaeffer, and B.
Wold, "Mapping and quantifying mammalian transcriptomes by RNA-Seq," Nat Methods, vol. 5, pp. 621-8, Jul 2008.
[16] S. C. Madeira and A. L. Oliveira, "A polynomial time biclustering algorithm for finding approximate expression patterns in gene expression time series," Algorithms Mol Biol, vol. 4, p. 8, 2009. [17] J. Jin, H. Zhang, L. Kong, G. Gao, and J. Luo, "PlantTFDB 3.0: a
portal for the functional and evolutionary study of plant transcription factors," Nucleic Acids Res, vol. 42, pp. D1182-7, Jan 2014.
[18] R. Shin, A. Y. Burch, K. A. Huppert, S. B. Tiwari, A. S. Murphy, T. J. Guilfoyle, et al., "The Arabidopsis transcription factor MYB77 modulates auxin signal transduction," Plant Cell, vol. 19, pp. 2440-53, Aug 2007.
[image:5.612.58.559.338.516.2][19] Y. Jaillais and J. Chory, "Unraveling the paradoxes of plant hormone signaling integration," Nat Struct Mol Biol, vol. 17, pp. 642-5, Jun 2010.
Figure 1. Gene setsidentified in different subsets of gene expression profiles
Table 1. Number of biclusters compose of two to 16 TFs in four pathways: zma04016, zma04075, zma04626 and zma04712.
Pathway\TFs 2 3 4 5 6 7 8 9 10 11 12 13 14 15 16
zma04016 155 67 66 27 11 30 27 3 1 0 0 0 0 0 0
zma04075 361 126 30 55 44 14 23 22 15 20 12 15 5 6 3
zma04626 73 39 19 10 0 0 0 0 0 0 0 0 0 0 0
[image:5.612.46.568.573.640.2]