Vol. 41, No. 6, June 2003
Aerodynamics of a Double-Element Wing in Ground Effect
Xin Zhang¤and Jonathan Zerihan†
University of Southampton, Southampton, England SO17 1BJ, United Kingdom
An investigation of a cambered, double-element, high-lift wing operating in ground effect was performed. The effect of ground proximity and ap setting was quanti ed in terms of aerodynamic performance and off-surface ow eld characteristics. From that, it was found that the ow is three-dimensional toward the wing tip with the main element generating most of the downforce but retains quasi-two-dimensional features near the center of the wing. However, at large heights the downforce increases asymptotically with a reduction in height. Then there is either a plateau, in the case of a low ap angle, or a reduction in downforce, in the case of a large ap angle. The downforce then increases again until it reaches a maximum and then reduces with decreasing height above the ground. The maximum downforce is dictated by gains in downforce from lower surface suction increases and losses in downforce caused by upper surface pressure and lower surface suction losses, with a reduction in height. For the high ap angle there is a sharp reduction just beyond the maximum,mainly because of the boundary layer separating, and a resultant loss of circulation on the main element.
Nomenclature
b = wing span; 1100 mm
CD = drag coef cient,D=q1S
CL = lift coef cient,L=q1S
CP = pressure coef cient,p=q1
c = wing chord; 380 mm
cf = ap chord; 165.7 mm h = height above ground q1 = dynamic head,1
2½1U12
Re = Reynolds number,½1U1c=¹
S = platform area U1 = freestream velocity
u; v; w = velocity components inx; y;zaxis system umin = minimumuvelocity component in wake
u0u0 = turbulent stress
x; y;z = Cartesian coordinates,xpositive downstream, ypositive up,zpositive to starboard
® = incidence
¹ = viscosity
»; ³ = local coordinates,»tangential,³normal
½1 = freestream density
Introduction
A
WING operating in the proximity to the ground introduces different ow physics from that in freestream. Comparatively little information is placed in public domain about an inverted wing in groundeffect,which hasits applicationin the automobileindustry. For example, the front wing of a racing car operatesin groundeffect, at typical heights of 70–100 mm from the ground,1 and producesabout 25–30% of the total downforce of the car.2 The downforce
works in conjunction with the mechanical grip to improve the ac-celeration, braking, and cornering speed of the car. However, it is not only the overall level of downforce that is the important fac-tor. The front wing changes height from the ground because of the suspension movements on the car. This severely affects the level
Received 4 April 2002; revision received 27 January 2003; accepted for publication 27 January 2003. Copyright°c2003 by Xin Zhang and Jonathan Zerihan. Published by the American Institute of Aeronautics and Astronau-tics, Inc., with permission. Copies of this paper may be made for personal or internal use, on condition that the copier pay the $10.00 per-copy fee to the Copyright Clearance Center, Inc., 222 Rosewood Drive, Danvers, MA 01923; include the code 0001-1452/03 $10.00 in correspondence with the CCC.
¤Professor of Aerodynamics, Aeronautics and Astronautics, School of
Engineering Sciences. Senior Member AIAA.
†Research Student, Aeronautics and Astronautics, School of Engineering Sciences; currently Aerodynamicist, BAR Operation Centre, Brackley, England NN13 7BD, United Kingdom.
of downforce, and hence the grip. It is important to maintain con-sistent levels of front end grip, not only for performance reasons. It is not only important to have a car that handles well for perfor-mance reasons, but it is also a signi cant safety issue. In addition to the aerodynamic performance of the front wing, another major issue is the wake/vortices that it generates. The ow to the under-tray and diffuser in particular, but also the radiators and rear wing, is severely affected by the front wing because they all operate in the wake/vortices from the wing.
There has been a lack of data on inverted wings in ground effect that are supposed to simulate the ow correctly. Ground effect is normally felt within a height of one chord. Using a single-element wing, Zerihan and Zhang3show that the use of a xed groundwould
result in a substantial reduction in the downforce, with a signi -cant drop below a critical height of around 0.3 chord (by as much as 25%). Above the critical height major ow features would be the same as in the freestream case. Below the critical height, new features emerge, for example, shear-layer instability and wall jet, which will not be simulated correctly by the use of a xed ground. Among various studies, Knowles et al.4were the rst to study
ex-perimentally a single-element wing with the suction surface near a moving ground. However, neither three-dimensional effects nor off-surface ow eld was studied. Recently, in a series of studies, Zerihan and Zhang3;5;6conducted investigations of single-element
wings in ground effect, including three-dimensionaleffect and off-surface ow eld surveys, as well as numerical modeling.
In practice, a typical geometry of the front wing is of a multi-element con guration, which would introduce additional features of importance. The study of multielement ows is an area that has challenged researchers for a long time. Smith7described the ve
bene cial effects of the gaps between the elements in multielement ows: slat effect, circulation effect, dumping effect, off-the-surface pressure recovery, and fresh-boundary-layer effect. Ranzenbach et al.8demonstrated the ground effect for a double-element airfoil
con guration. Their work begins to address the topic, using two-dimensional model tests in a xed ground wind tunnel on a NACA 632¡215 Mod B section with a 30% slotted ap for the double-element studies. Force reduction was observed. Jasinski and Selig9
presented an experimental study of a three-dimensional multiele-ment wing in ground effect, again using a xed ground facility. Two trailing vortices were observed rolling up from the end plate, the size of which increased for the larger ap de ection. In this study we aim to quantify the performance of a generic double-element wing in ground effect, employing model tests with correct ground conditions. Earlier results illustrate the large-scale unsteady and time-averaged ow features of a high-lift single-element wing. It shows that the ground has indeed a profound effect on the aero-dynamic performance. By associating uid ow measurements and
observation with force and pressure measurements, it is possible to develop a greater understanding of ow physics.
Methods
Test Facilities
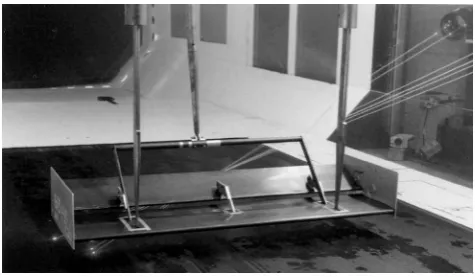
Tests were conducted in the University of Southampton 3.5£2.5 m wind tunnel for laser Doppler anemometry (LDA) sur-veys (Fig. 1) and 2.1£1.7 m wind tunnel for other tests. Details can be found in Ref. 10. Both tunnels are of a conventional closed-jet, closed-circuit design. At 30 m/s the freestream turbulence is less than 0.2% in both tunnels. The tunnels are equipped with a large, moving belt rig.
Wing Model
Earlier studies were performed on a genericsingle-elementwing, with a cambered pro le.3Current tests employ the single-element
wing as the main element in addition to a large ap. The main el-ement has a modi ed General Aviation-Whitcomb (GAW) airfoil (Fig. 2). A detailed listing of the coordinates was given by Zeri-han (see Table 3 in Ref. 10). The main cZeri-hanges include a forward movement of the lowest point on the suction surface, a attening of the pressure surface, and a modi cation to the leading edge. The main purpose of the modi cation is to minimize the wake behind the airfoil. A span of 1100 mm was used, which correspondsto less than 75% of the width of the moving belt in the smaller wind tunnel, to minimize effects at the edge of the belt. The wing has a constant chord of 223.4 mm.
A ap with a constantchord of 165.7 mm was used, the aft 35 mm of which is the thin region, 1 mm thick. A detailed listing of the ap coordinateswas given in Ref. 10. Two ap angles were used (see the section on ap location optimization). For the high ap angle the chord is 378.9 mm. For the lower ap angle the chord is 381.5 mm. In presentingthe results,all of the length scales were normalized by 380 mm. The combinedchord correspondsto an aspect ratio of 2.89. End plates were employed, which are rectangular with dimensions 400£170£4 mm (Fig. 2).
Tests
All force, pressure,and ow visualizationtests were performed at a constant dynamic pressure of 56.25 mm water. LDA and particle
Fig. 1 Model installation in wind tunnel.
Fig. 2 Schematic of a double-element wing in ground effect.
image velocimetry (PIV) tests were performed at a constant speed of 30 m/s. The Reynolds numbers were in the range 0:735£106
to 0:765£106based on the total chord. The tests were performed
transition free.
Two models were manufactured: a clean wing used for forces, ow visualization,LDA, and PIV; and an identical model, with the addition of pressure taps. The surface pressures were measured by a chordwisedistributionof pressuretaps,locatednear to the semispan. It comprises 25 taps on the suction surface and 23 on the pressure surface. A similar con guration was used for the 25 pressure taps on the ap. The chordwise group contains 13 taps on the suction surface and 12 taps on the pressure surface.
The forces and surface pressures acting on the wing have been measured for the model at a wide range of ground heights, from 1.97cto less than 0.05cabove the ground.The height was de ned by the distancefrom the groundto the lowest point on the wing with the wing incidenceset to 0 deg. The effectof changingthe ap de ection angle was investigatedat the different heights. The incidence of the wing was varied using a rotation about the quarter-chord position. The reference incidence of 1 deg at which all double-element tests were performedis the incidence correspondingto end plates parallel to the ground, with the wing in its datum ap de ection, that is, a true incidence of 14.1 deg.
Off-surface results were also taken over a chordwise slice at the semispan of the wing with a LDA system to extract mean ow and turbulence data. LDA measurements were performed with a three-componentDantec systemwith a 5-W argon-ionlasergenerator.The system was operated in backscatter mode. The velocities measured in the beam axes were resolved into the tunnel coordinate system
.x;y;z/using a matrix transformation.Seeding was introducedby three seeding generatorslocateddownstreamof the rolling road, be-hind the model. The LDA signals were analyzed using three Dantec Burst Spectrum Analyzers. On average, a total of 800 bursts (in-stantaneous samples) were collected for each data point. The LDA study was supported by PIV survey of the ow between the ap and the ground, which provided insight into the state of the ow immediately behind the main element. PIV was performed using a Dantec PowerFlow system.The laser for the PIV system was located approximately1.6 m downstream of the center of the wing, after the end of the rolling road. The region of the ow eld including the trailing-edgeregion, from the ground to above the ap extending to x=cD1:2 at the wing semispan, was mapped. The total number of samples recorded per run was 500. The analysis sequence used was to cross correlate the data on 32£32 pixels and perform a range validationof the resulting vectors, generatinga 157£125 grid. De-tails of the system can be found in Zerihan and Zhang.5The range
of heights extended from 22 to 100 mm.
Errors and Uncertainties
The incidence of the wing was set to within§0:005 deg, and the height above ground was set to within§0:2 mm. The constant dynamic pressurewas set to 56.25-mmwater§0:05 mm. The uncer-tainties in the force measurements were calculated using the addi-tion method and a 95% con dence.11CLandCDhave uncertainties
of§0:003 and§0:0006, respectively.Uncertainties in the surface-pressure results were calculated using the rss method as described by Moffat11: the worst case corresponding to aC
pof§0:035. The short-term repeatability was investigated; the highest uncertainties were found to be at the suction peak and the transition bubble, the worst corresponding to aCpof§0:075.
For the LDA survey the accuracy of the traverse is 0.01 mm, but there is a gear backlash of 0.5 mm. Attempts were made to reduce the effect of this by always approaching a boundary layer or wake pro le from the same direction. Following an analysis by Zhang,12an estimate of the uncertaintyin the velocity measurement
givesu=U1§0:005 andv=U1§0:005. An estimate of the 95% con dence level has been performed following procedures given by Benedict and Gould.13In a typical test the worst uncertainty is
0.006 foru0u0=U2
1D0:007, or less than 10% of the value. For the
[image:2.558.29.267.447.587.2] [image:2.558.30.266.587.739.2]Results and Discussion
Flap Location Optimization
For the forces two ap angles were used: the datum (high ap angle) and a de ection of ¡8:5 deg (low ap angle). The point about which the ap was rotated was at a location ofx=cD0:567, y=cD0:076, that is, 2 mm downstream from the leading edge of the ap (see Tables 3 and 4 in Ref. 10 for the exact coordinates).
[image:3.558.292.530.47.140.2]A series of tests were performed in order to nd the ap location at which the maximum downforce was produced for a constant ap de ection.The gap and the overlapwere variedin stepsof 2 mm. The overlap was de ned as the horizontal distance between the trailing edge of the main element and the leading edge of the ap, with a positive overlap for the ap leading edge upstream of the main-element trailing edge. The gap was de ned as the vertical distance betweenthe trailingedgeof the main elementand the lowest pointon the ap suction surface, with a positive gap for the ap leading edge abovethe main-elementtrailingedge.The ap locationoptimization was performed for the datum ap de ection angle at an arbitrary height ofh=cD0:263. Results of the optimization can be seen in Fig. 3. The optimum locationfor the ap can be seen to be an overlap of 0.024cand a gap of 0.032c. These correspond to 9 and 12 mm, respectively.This was used as the location of the ap for all further tests at the different heights and ap de ection.
Oil Flow Visualization
Oil ow visualization was performed at various heights (see ex-amples in Fig. 4). Although it dif cult to see from the pictures, the streaklines on both elements featured spanwise components, par-ticularly near the tips. It seems, however, that over the center the surface streaklines do not feature signi cant spanwise components. The ow over the central portion can be regarded as quasi-two-dimensional. Signi cant three-dimensional effect is observed near the tip, which is probably associated with the likely presence of the edge vortices. In fact a recent single-element wing study suggests that the breakdown of the edge vortices causes the change in the lift slope between regions a and b (see later).14It is conceivable that
the pressure eld could be affected near the center. (Further studies need to be performed on this.) Nevertheless, the main tenet of the current paper remains valid.
Ath=cD0:395 (Fig. 4a) the separation bubble indicating tran-sition is clear over most of the span of the wing. The separation point in the bubble was measured atx=cD0:11¡0:13, with turbu-lent reattachment at x=cD0:16. However, near the center of the wing, a small region can be seen where the bubble is breaking up just to the left of the semispan and where the bubble is not present slightly to the right of the semispan. Close inspectionof the patterns on the wing, dif cult to see in the gure, reveals a small bubble very close to the leading edge,x=cD0:01¡0:02, where there is no main transition bubble. (This phenomenon is discussed further in the following paragraph.) Hence, on the main element, transition is observed at two chordwise locations at this height for the low ap angle:x=cD0:01¡0:02 for a small region at the center of the
Fig. 3 Effect of varying overlap and gap ath//c== 0.263; datum ap angle.
a)h/c= 0.395, low ap angle
b)h/c= 0.211, high ap angle
Fig. 4 Oil ow visualization on suction surface showing leading-edge lowermost.
wing andx=cD0:11¡0:16 elsewhere.On the ap a reasonablylarge transition bubble is again seen. It is broken up at three spanwise lo-cations where the brackets secure the ap in place. The separation point was measured atx=cD0:69¡0:72, with turbulent reattach-ment at x=cD0:75. The leading-edge transition was not seen at h=cD0:211, and heights below this, for the low ap angle. On the main element the detachment point in the bubble was measured at x=cD0:12¡0:14, with reattachment atx=cD0:17, that is, at ap-proximately the same location within the measurement uncertainty. The bubble on the ap was measured at the same position as that at h=cD0:395.
For the high ap angle there is a signi cant difference (Fig. 4b). On the main element transition at the leading edge accounts for a signi cant portion of the span of the wing. In the central portion of the image, the leading-edge bubble can be seen, and on the right the bubble is farther back, atx=cD0:11¡0:18. As at the low ap angle, this portion of the wing with leading-edge transition reduces as the ground height is reduced. Ath=cD0:211 it is approximately 36% of the span. This reduces from 57% ath=cD0:395 to 46% ath=cD0:263, 36% ath=cD0:211, 20% ath=cD0:158, and to virtually zero ath=cD0:105. The transition location for the ap is now very close to the leading edge, atx=c¼0:58. This was found to be the case for all heights tested for the high ap angle.
Force Behaviors
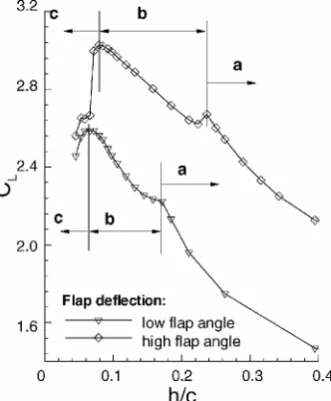
The downforce and drag coef cients as the ride height is varied are given in Figs. 5a and 5b. It can be seen that the basic charac-teristics of the downforce with height curve are broadly similar to the single-element wing.3 The downforce increases as the height
reduces, and eventually a maximum downforce is obtained, after which the downforce reduces sharply. For the low ap angle the maximum is reached ath=cD0:066, and for the high ap angle h=cD0:079. Below the maximum downforce height is the down-force reduction regionc.
[image:3.558.293.529.170.276.2] [image:3.558.33.265.595.731.2]Fig. 5a Downforce with ground height.
Fig. 5b Drag with ground height.
for the low angle ap angle will be referred to as regiona, and heights betweenh=cD0:066 andh=cD0:171 will be referred to as regionb.
For the high ap angle the wing generates signi cantly more downforce than for the lower ap angle. At large heights, greater than h=cD0:237, similar characteristics can again be seen as the downforce increases asymptotically as the height is reduced. However, a discontinuity in slope again exists in the curve, at h=cD0:237, and the downforce actually reduces suddenly just be-low this height. As the height is reduced further, the portion of the curve seems more linear. A maximum in the downforce occurs at h=cD0:079, correspondingtoCLD3:028. Below this height a sud-den drop in the downforce is observed. In a similar manner to the low ap de ection, three ow regions are de ned.
The variation of drag with height is given in Fig. 5b. The curves for the two ap de ections show a general trend of increasing drag as the height is reduced. At the low ap de ection the curve is relatively smooth, with the gradient of the line generally increasing as the ground height is reduced. However, just aboveh=cD0:171, at the lower boundary of the typea ows at this ap de ection, the gradient is greater than just below this height, that is, a similar characteristicto the downforce against height curve is observed. At the high ap de ection a signi cantly greater drag is obtained at all heights, than compared to the low ap de ection. A broadly similar variation with height is observed. In the border between the type
Fig. 6 Chordwise surface pressures at wing center ath//c= 1.97.=
a=b ows, ath=cD0:237, the generaltrend is for a sharper gradient at low typeaheights, and a lower gradient at greater typebheights. This is somewhat more pronounced than for the low ap de ection.
Chordwise Pressure Distribution
A comparisonof pressuredistributionath=cD1:97 is made of the single-elementwing and double-elementwing (Fig. 6). The ap has the effect of introducinga nite pressureover the trailingedge of the main element. The pressures on the pressure surface are increased, and the suction generatedon the suction surfacealso increases com-pared to the single-elementwing. The increments are greater for the high ap angle than for the low ap angle. Over the mid and aft portions of the wing, the increases are broadly constant for both ap angles. However, tox=c¼0:15 the shape of the distribution changes more signi cantly for the double-element wing compared to the single-elementwing. On the pressure surface the acceleration of the ow from stagnation at the leading edge is smoother with the ap, in the region tox=c¼0:1. For the single-elementwing the ow reaches a velocity approaching freestream atx=c¼0:02. On the suction surface, the suction peak for the single-element wing at x=cD0:08 remains at the same place. This will be known as the suction peak. However, a suction spike near to the leading edge at x=cD0:01¡0:02 becomes apparent when the ap is added, which shall be referred to as the suction spike. The spike grows for the higher ap angle. The bump that is present in pressure on the single-element suction surface at x=cD0:17 representing the transition bubble is not as apparent for the double-element wing.
The two ap angles yield different types of distributions. For the low ap angle the ow is accelerated over the suction surface a little from the higher than freestream velocity near to the main element trailing edge. It remains atCP¼ ¡1 untilx=cD0:72, and then the recovery starts as the trailing edge is approached. For the high ap angle the ow is acceleratedrapidly from the leading edge atx=cD0:564 to a peak suction atx=cD0:570. The ow is then retarded. The difference in suction between the high and low ap anglesreducesalong the chord of the ap and is small for the nal tap atx=cD0:880. On the pressure surface the ow is accelerated from stagnation at a greater rate for the low ap angle. The pressures remain broadly constant for each con guration but are greater in magnitude for the high ap angle than for the low angle.
[image:4.558.328.497.43.257.2] [image:4.558.66.232.46.247.2] [image:4.558.64.230.94.480.2]a) b)
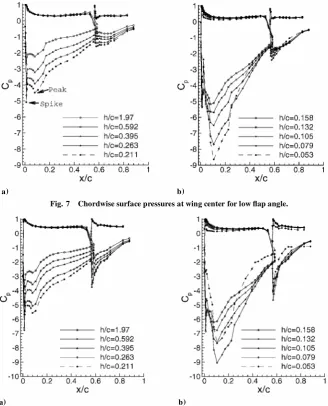
Fig. 7 Chordwise surface pressures at wing center for low ap angle.
a) b)
Fig. 8 Chordwise surface pressures at wing center for high ap angle.
suction near the ap leading edge. The fundamental shape of the distributions does not change, and the main suction peak, and the spike very close to the leading edge, are still presentas the ground is approached and remain at the same location within the spatial res-olution of the taps. The reduction in pressure from after the spike, to the main peak increases as the height is reduced. The distribution over the pressure surface varies little fromh=cD1:97 to 0.211.
Closer to the ground (Fig. 7b), the effect differs. The suction on the main element increases signi cantly as the height is reduced, especially in the chordwise region from x=cD0:08 and down-stream. The increment starts to reduce fromx=c¼0:25 and is small at the trailing edge of the main element. For the lowest height, h=cD0:053, a reduction in suction is found fromx=cD0:25 com-pared toh=cD0:079. The tap recording the suction peak moves fromx=cD0:079 to 0.105 as the height is reduced. The character-istics of the spike near to the leading edge also change. Although not overly clear, at heights lower than and includingh=cD0:132 the maximum suction over the entire surface is found in the suc-tion peak at x=cD0:105, compared to the leading-edge spike at heights greater than this. The peak suction at the lowest height cor-responds to CPD ¡8:7, much greater than the maximum for the single-elementwing. Over the lower surface of the ap, the change in suctionis small comparedto the main element.There is a tendency for the suction to increase near to the leading edge, with the lowest height case showing a slight reduction in suction fromx=cD0:65. The distributionsover the pressuresurfaceof both elements changes very little, but the slight effect of reducing pressure with height can be seen.
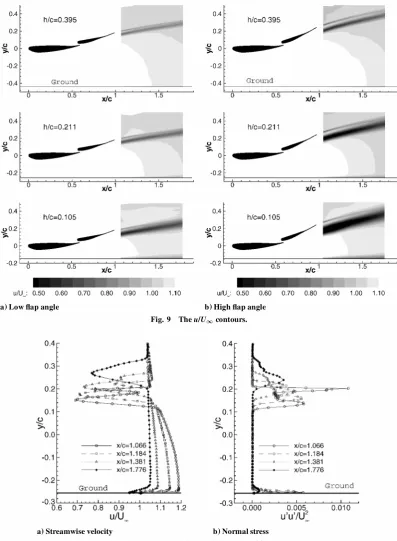
[image:5.558.110.439.44.451.2]a) Low ap angle b) High ap angle Fig. 9 Theu/U1contours.
a) Streamwise velocity b) Normal stress Fig. 10 Wake surveys for low ap angle ath/c= 0.211.
Off-Surface LDA Wake Survey
An LDA wake survey was taken at four streamwise locations of x=cD1:066;1:184;1:381;and 1:776 behind the trailingedge of the ap. Boundary-layersurveys were taken along a line perpendicular to the suction surface, at the trailing edge of the ap (see Fig. 2). Results were acquired at heights ofh=cD0:395;0:211;and 0.105 for the low and the high ap angles.
A complex turbulent wake ow is produced by the wing (Figs. 9– 11). Immediately downstream of the low angle ap, two minima in uwere found (Figs. 9a and 10a); the more signi cant in terms of velocity de cit and thickness appears to be caused by the main ele-ment. As the wake developsdownstream,turbulentmixing increases the size of the wake (Fig. 10b), as was found for the single-element wing,5and the maximum velocity de cit reduces.The wake surveys
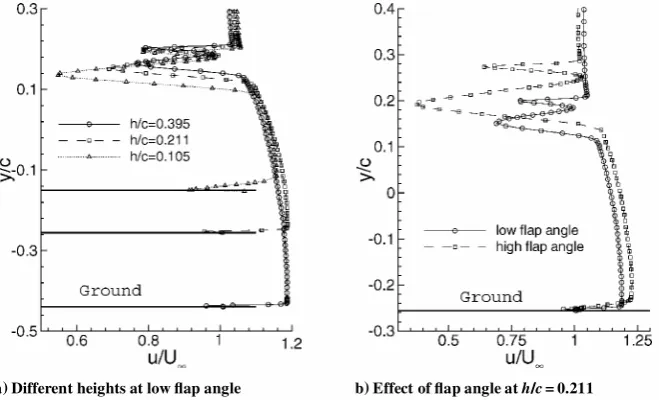
[image:6.558.80.478.42.584.2]a) Different heights at low ap angle b) Effect of ap angle ath//c= 0.211 Fig. 11 Wake surveys atx//c= 1.066.
a) Tangential velocity b) Normal stress Fig. 12 Boundary layer at ap trailing edge.
the velocity de cit appears similar as the ow moves downstream, with a minimum velocityofu=U1¼0:95. The layer does, however, appear to have grown in thickness.
The turbulent stressu0u0=U2
1distribution (Fig. 10b) shows two
distinct peaks at x=cD1:066, representing the wakes from the ap and the main element. Here, the contribution from the ap is more signi cant than that of the main element. At the next point, x=cD1:184, the perturbationsfrom the main element have reduced only slightly in the portion of the wake from the main element but signi cantlyin theportionfromthe ap. Atx=cD1:381 the ap con-tribution falls again and is more like a plateau, until atx=cD1:776 the results show advanced merging, with only a small bump. High levels of the perturbationvelocity,which decrease signi cantly with distance downstream, can be seen in the boundary layer close to the ground.
As the height of the wing is reduced (Fig. 11a), the wake from the wing increases as was found for the single-elementwing. However, the portion of the wake from the ap does not change signi cantly, in terms of the velocity and the thickness. The portion from the main element is the cause of the increase; the wake thickens, and the velocities reduce as the height is reduced. In a similar manner to the single-elementwing, it is the portion from the suction surface (of the main element) that changes, and the pressure surface con-tribution does not vary signi cantly. Similar values for the velocity are found in the region of accelerated uid between the wake and the ground. The retarded ow very close to the ground becomes
more signi cant as the height is reduced, as the layer becomes thicker,and possibly becomes more extreme in terms of the velocity de cit.
Both the velocityde cit and the wake thicknessare greater for the high ap angle, not only because of the main element, but also from the ap (Figs. 9a and 11b). From the wake surveys it can be seen that, for the high ap angle, the wakes are further from merging than for the low ap angle. The ow between the wing and the ground is accelerated to a greater extent for the high ap angle for the results near to the wing. Forh=cD0:105 the contours show that the velocity de cit very close to the ground is greater for the high ap angle, both in terms of the velocity and the thickness. At the greater heightsit is clear that the layer thickensas it moves downstream,but it is dif cult to compare the velocities directly. The general effect of changing the height on the ow eld and the development of the wake downstream is similar to those found for the low ap angle.
Boundary-layerpro les (Fig. 12a) con rm that at the trailingedge of the ap the wake from the main element is indeed separated from the boundary layer of the ap and that the merging of the layers, if any has happened,is small at this streamwise location.As the height is varied for the low ap angle, the boundary layer directly from the ap changes little, and the results are within the positionalaccuracy of the equipment used. The velocity at the con uence between the layers isu»=U1¼1:06 for the three heights for the low ap angle.
[image:7.558.116.446.45.245.2] [image:7.558.118.441.270.469.2]a) b)
c) d)
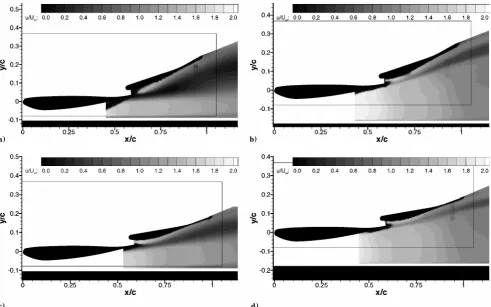
Fig. 13 Off-surface PIV survey:u/U1contours; a)h/c= 0.058, high ap angle, b)h/c= 0.132, high ap angle, c)h/c= 0.058, low ap angle, and d)h/c= 0.132, low ap angle.
away from the surface, as the wake thickness increases. The effect of the overall boundary-layerthickness increasing as the ground is approached is caused by the contribution from the main element. For the high ap angle ath=cD0:395, the boundary layer directly from the ap is thicker.In addition,the merging of the wake from the main element with the ap boundary layer is less developed than for the results at the low ap angle. The main element boundary layer is both thicker and more signi cant in terms of the velocities, compared to the low ap angle.
The turbulent stress u0u0=U2
1 is shown in Fig. 12b for the
boundary-layer pro les. For the low ap angle concentrations in u0u0=U2
1are found in the region close to the ap surface. The
high-est values are found at values of³less than 0:002cfrom the surface, and this decreases to minima at³¼0:015c, a height near the merg-ing of the main-element wake and the ap boundary layer. In the region of the main-elementwake,u0u0=U2
1increasesto a maximum.
For all three heights this maximum is at a location farther away than the center of the main-element wake, and the magnitude increases as the height is reduced. Some evidence of a second peak of pertur-bations exists at a location closer than the center of the boundary layer, but this is not well de ned. The curve then drops as the edge of the boundary layer is approached. For the high ap angle the peak within the ap boundary layer is of a greater magnitude than the low ap angle ath=cD0:395. The perturbations then drop sharply to practicallyzero, con rming that this is out of, or very close to, the edge of the main-element wake. The curve increases to a rst small peak, on the inner side of the center of the wake, drops slightly, and increases again to a second peak, farther out from the center of the wake, then falling off to the edge of the boundary layer.
Off-Surface PIV Survey
Although the LDA survey provided both qualitative and quanti-tative data of the wake development,it does not extend to the region underneath the ap and above the ground. Features in the region would provide insight into the force reduction at the low ground height. PIV surveyswere therefore performedin the region between the ap and the ground. The survey was made feasible by the use of
glass end plate. Figure 13 gives mean streamwise velocity contours at two typical heights: one in the force reduction region and another in the enhancement region.
The PIV surveys generally con rm the observations made with the LDA surveys with additional new information. The wake from the main element is seen to dominate, and its thickness increases as the groundheightis reduced,as observedin the LDA measurements. The ow accelerates between the ground and the main element to reach a speed higher than the freestream before the maximum suction point (not shown in the PIV images); hence the high velocity region betweenthe groundand the wing. After the maximum suction the wing effectively forms a diffuser section with the ground, and the ow decelerates downstream. For the majority of test cases, the ow stays attached at the trailing edge of the main element, unlike the single-element case.3 The Kutta condition at the trailing edge
is satis ed, and the wake off the trailing edge of the main element follows an upward path (Fig. 13b). Nevertheless,the wakes from the main element and the ap do not merge immediately after the ap, and the main-element wake does not touch the ap for all cases.
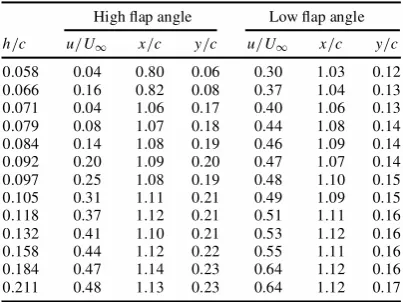
[image:8.558.35.527.43.350.2]Table 1 Measured minimum in streamwise velocity in the main-element wake
High ap angle Low ap angle
h=c u=U1 x=c y=c u=U1 x=c y=c
0.058 0.04 0.80 0.06 0.30 1.03 0.12
0.066 0.16 0.82 0.08 0.37 1.04 0.13
0.071 0.04 1.06 0.17 0.40 1.06 0.13
0.079 0.08 1.07 0.18 0.44 1.08 0.14
0.084 0.14 1.08 0.19 0.46 1.09 0.14
0.092 0.20 1.09 0.20 0.47 1.07 0.14
0.097 0.25 1.08 0.19 0.48 1.10 0.15
0.105 0.31 1.11 0.21 0.49 1.09 0.15
0.118 0.37 1.12 0.21 0.51 1.11 0.16
0.132 0.41 1.10 0.21 0.53 1.12 0.16
0.158 0.44 1.12 0.22 0.55 1.11 0.16
0.184 0.47 1.14 0.23 0.64 1.12 0.16
0.211 0.48 1.13 0.23 0.64 1.12 0.17
Further Discussion
Adding the ap to the main element induces a greater circulation around the main element, as can be seen by the greater suction on the lower surface and the increased pressures on the upper surface. The fact that there is a nite suction at the trailing edge of the main element implies that the pressure recovery from the suction peak on the main element to the trailing edge is not as severe. Large regions of separated ow were observed for the single-elementwing, but for the double-element wing separation is not as widespread. The two effects,the circulationeffect and the dumping effect,were described by Smith7as contributing factors to the bene t of a multielement
con guration.
For the double-element wing a force reduction regioncis iden-ti ed, similar to the single-element wing.3Above the regionctwo
regions of force behavior are identi ed: regionsaandb. Above regionaheights, at and aboveh=cD0:171 for the low ap angle and at and aboveh=cD0:237 for the high ap angle feature an increasing downforce with an increasing proximity to the ground. The slope increases as the height reduces. Below this, at regionb heights, the curve also increases with reducing ground height until the maximum downforce is obtained. For the low ap angle there is an asymptotic increase and then a smooth reduction in the gradient to the maximum downforce, followed by a reduction in downforce. For the high ap angle the curve is more linear, and there is a sharp reductionbelow the maximum downforce.At the boundarybetween the typea=b ows, there is a discontinuityin slope in the downforce curve. For the low ap angle this is manifested as a plateau region at the large typebheights. For the high ap angle there is a sudden reduction in downforce, compared to the lowest typeaheights.
At the center of the wing, the contribution from the ap at the low ap angle increases by about 30% as the height is reduced from h=cD0:592, untila maximumath=cD0:105, and then reducesa lit-tle below this. Similar results are foundfor the high ap angle,where the height at the maximum sectional downforce ish=cD0:158. The pressure distributions suggest that the small reductions in down-force are caused by reductions in pressure on the pressure surface and small reductions in suction in the regionx=cD0:65¡0:8 on the ap suction surface. The general increase in downforce as the ground is approached for the ap is signi cantly smaller than that for main element. As the height of the wing is changed, the ap is farther from the ground and therefore less sensitive to changes in ground height than the main element. There is a more signi -cant reduction in downforce at the lowest height for the high ap angle, which is caused by the boundary layer separating over the ap. The lower circulationimparted by the ap on the main element can be seen represented by the lower suction on the main element suction surface for the lowest height. According to LDA measure-ments, two hypotheses are presented. First, the boundary layer can separatefrom the main-elementsuctionsurfacefor the lowest height with the high ap angle, preventing the wake from owing over the ap, leading to the ap boundary layer separating and a lower ap loading. However, the ap ow can separate itself, causing a loss
in ap circulation, reducing the main-element circulation. The PIV measurements suggest that the rst is the case. The existence of the trailing-edge separation leads to a downward movement of the lower bound of the wake from the main element and the presence of a velocity minimum in the wake immediately after the main ele-ment and beneath the ap. This creates an effective diffuser section between the wake and the ap and places a higher pressure recovery demand on the ap suction surface ow, leading to separation and downforce loss.
Summary
The aerodynamicbehavior of a cambered, double-element,high-lift wing has been studied using model tests. Techniques em-ployed include force balance,surfaceoil ow visualization,surface-pressuretaps,off-surfaceLDA surveys,and PIV measurements.The effects of ground proximity and ap angle de ection are quanti ed. It was found that the main element produces most of the down-force and dominates the turbulent wake development. The ground proximity does not alter the turbulent wake from the ap signi -cantly, in terms of the velocity de cit and the thickness.An increase in the wake thicknessand a reductionin the velocityde cit are found in the portion from the suction surface of the main element, as the wing is moved to the ground. Both the velocity de cit and the wake thickness are greater for the high ap angle, not only because of the main element, but also from the ap. In the center of the wing, the ow can be regarded as quasi-two-dimensional. Three regions are identi ed on the downforce with height curve. A force reduc-tion regionc, similar to that of a single element wing, is presented for the two ap settings. Above the force reduction regionc, there are two distinct regions. At large heights, regiona, the downforce increases asymptotically with a reduction in height. Then there is either a small plateau, in the case of the low ap angle, or a reduc-tion in downforce, in the case of the large ap angle. The downforce then increases again, regionb, until it reaches a maximum, and then reduces. In the case of the low ap angle, the maximum downforce is dictated by gains in downforce from lower surface suction in-creases and losses in downforce caused by upper surface-pressure losses and lower surface suction losses, with a reduction in height. For the high ap angle there is a sharp reduction just beyond the maximum because of the boundary layer separating and a resultant loss of circulation on the main element.
Acknowledgments
J. Zerihan is supported by an Engineering and Physical Sciences Research Council studentship. The authors thank BAR for support and W. Toet for discussions during the course of the study and J. McManus and S. Mahon for performing the PIV survey.
References
1Agathangelou, B., and Gascoyne, M., “Aerodynamic Considerations of a Formula 1 Racing Car,” Society of Automotive Engineers, Publ. 980399, Feb. 1998.
2Jeffrey, D., and Alperin, M., “Aspects of the Aerodynamics of Year 2000 Formula One Racing Cars,”3rd MIRA International Vehicle Aerodynamics Conference, MIRA, 2000.
3Zerihan, J., and Zhang, X., “Aerodynamics of a Single-Element Wing-in-Ground Effect,”Journal of Aircraft, Vol. 37, No. 6, 2000, pp. 1058–1064. 4Knowles, K., Donahue, D. T., and Finnis, M. V., “A Study of Wings in Ground Effect,”Loughborough University Conference on Vehicle Aerody-namics, Royal Aeronautical Society, London, 1994, pp. 22.1–22.13.
5Zerihan, J., and Zhang, X., “Unsteady Turbulent Wake Behind a Single-Element Wing in Ground Effect,” 10th International Symposium on Ap-plications of Laser Techniques to Fluid Mechanics, Lisbon, July 2000, Paper 8-1.
6Zerihan, J., and Zhang, X., “A Single Element Wing in Ground Effect: Comparisons of Experiments and Computations,” AIAA Paper 2001-0423, Jan. 2001.
7Smith, A. M. O., “High-Lift Aerodynamics,” Journal of Aircraft, Vol. 12, No. 6, 1975, pp. 501–530.
[image:9.558.47.249.65.216.2]9Jasinski, W. J., and Selig, M. S., “Experimental Study of Open-Wheel Race-Car Front Wings,” Society of Automotive Engineers, Publ. 983042, Nov. 1998.
10Zerihan, J., “An Investigation into the Aerodynamics of Wings in Ground Effect,” Ph.D. Dissertation, Aeronautics and Astronautics, School of Engineering Sciences, Univ. of Southampton, Southampton, England, U.K., April 2001.
11Moffat, R. J., “Contributions to the Theory of Single-Sample Un-certainty Analysis,”Journal of Fluids Engineering, Vol. 104, June 1982, pp. 250–260.
12Zhang, X., “An Inclined Rectangular Jet in a Turbulent Bound-ary Layer-Vortex Flow,” Experiments in Fluids, Vol. 28, 2000,
pp. 344–354.
13Benedict, L. H., and Gould, R. D., “Towards Better Uncertainty Es-timates for Turbulence Statistics,”Experiments in Fluids, Vol. 22, No. 2, 1996, pp. 129–136.
14Zhang, X., Zerihan, J., Ruhrmann, A., and Deviese, M., “Tip Vor-tices Generated by a Single-Element Wing in Ground Effect,” 11th Interna-tional Symposium on Applications of Laser Techniques to Fluid Mechanics, Lisbon, July 2002, Paper 4-1.