Abstract— Increase in service demand due to rapid development in urban areas has extended the amount of pressure exerted on water distribution networks; thereby, causing an acute upsurge in the number of pipeline failures experienced. Failure occurrence in fiddly dolomite lands, however, may be fatal considering high levels of ground instability in such regions. It is therefore important to understand the tendencies of pipe failures in these regions, as this would enhance utilization of failure trends in predictive modeling of pipeline leakage. This however, may seem complicated, given the magnitude of inherent uncertainties accompanying pipe failure and scarcity of failure data. Nonetheless, such uncertainties can be addressed through strategic combination and utilization of facts, knowledge and auxiliary information, which can be tackled using predictive models like Bayesian Networks. In this paper therefore, we present an overview on how data uncertainty can be handled using BNs. We also identify failure tendencies and inherent uncertainties from a set of maintenance data from the City of Tshwane, and address how we intend to handle the uncertainties for effective failure prediction. Finally, we present a breakdown of data integrity concerns identified during the analysis, which warrants further research. Among the results we discover that most leakages occur along street corners and road intersections; and that small diameter pipes are most prone to failure. These analyses however, precede an intense uncertainty modeling process that is to be conducted. Information presented herein may be used to produce models for predicting pipeline leakage subject to historical failure.
Index Terms— pipeline failure, Dolomitic land, leakage prediction, distribution networks, Bayesian networks
I. INTRODUCTION
he importance of water distribution networks to urban settings that are thriving with countless number of socio-economic activities and a sharp population increase is a subject that warrants no assumption [1], [2]. These networks determine the productivity levels and also support the essence of communal safety and wellness in these regions [2], [3]. With such a high level of operational
Manuscript received June 16th, 2016; this work is supported by Tshwane University of Technology (TUT).
G. A. Ogutu1, O. P. Kogeda2 and M. Lall3 are all with Department of Computer Science, Tshwane University of Technology, Private X680, Pretoria, 0001, South Africa. Tel: +27 (012) 382-4309, Fax: + 27 (012) 382-4315 (e-mail: 1[email protected], 2[email protected], 3[email protected])
weight [3], they are likely to experience a number of breakdowns , which in most cases, are manifested through the number of leakages reported by water utilities [4], [5]. Pipeline failure refers to the “unintended loss of pipeline contents” [6], and leakages stand out as the most common form of failure that affect water distribution pipes [3]. They are inevitable [7] and are highly destructive [7 –10], thereby, prompting utility management to be on the constant lookout for effective leakage minimization strategies and techniques [2]. Water leakage results in a variety of negative effects, including property damage, environmental pollution and disturbance to other infrastructure [4], [8], [11].They also lead to a continuous reduction of the distribution networks’ reliability [12]. These effects consequently minimizes the ability of water facilities to meet their operational goals and targets [2].
Like a typical urban setting, the City of Tshwane (CoT) in Gauteng Province, South Africa boasts of a myriad of human activities and high levels of infrastructural development; underground pipeline facilities being one of them. Approximately, 23% of the total land in the city is Dolomitic [13], [14]. Dolomitic land refers to a piece of land that is underlain by dolomite rock, either directly or at shallow depths of possibly below 100m [13], [15]. These rocks are soluble in water [13 – 15]. Therefore, in the presence of pipe leakage, they may dissolve, leading to creation of voids and cavities within them. As a result, sinkholes may be formed, resulting into massive ground movements [13], [15] that are accompanied with fatal outcomes. Continued urban development however, has resulted in several sections of water distribution networks being lined in these Dolomitic regions [16], an aspect that calls for maximum attention. Determination of pipeline failure tendencies in this region is therefore very relevant, as this would encourage exploitation of these trends that can be included in predictive modeling of pipeline leakage, with the aim of leakage reduction.
According to the research reported in [28], there lacks an adequate level of understanding when it comes to the factors and processes that collectively lead to pipeline failure. In addition to this, timely identification of failures also comes as a challenge to a number of utilities [5], an aspect that lead to imprecision in capturing and recording of pipe failure history [5], [29]. These two aspects therefore, stand out as the highest contributors to uncertainty in pipe failure data.
Decoding Leakage Tendencies of Water
Pipelines in Dolomitic Land: A Case Study of
the City of Tshwane
Achieng G. Ogutu, Okuthe P. Kogeda, and Lall Manoj
II. FACTORS AFFECTING PIPELINE FAILURE IN DOLOMITIC
LAND
There exists an extended body of literature that attempts to analyze various factors that influence pipeline failure [4], [17], [18], [19]. The different factors analyzed by the abovementioned collection of literature talks about the factors that may influence pipeline failure in general. However, additional factors, specific to Dolomitic lands are relayed in [17]. Categorized as a region with collapsible tendencies [20], the soil coverage in dolomite regions are considered to undergo abrupt volume reduction in the presence of sufficient triggering mechanisms. Because of the abrupt reduction in volume, massive ground movements may be experienced. This in turn, may cause pipe breakages and cracks [13], [17], [20]. Pipe bedding or backfill [17], [20] also plays an important role with regards to support and protection of a pipe. In addition, thickness of pipe walls is also identified as an important determinant of its failure tendencies [17]. This is because the thickness of the pipe determines the amount of pressure it may handle in with regards to external load [20], [22] as well as longitudinal and circumferential deflections [17]. Last but not least, the safe span distance of a pipe is also considered to influence failure, given its strong correlation to a pipes wall thickness and diameter; factors that equally affect failure [13], [17], [20], [22].
III. REVIEW OF UNCERTAINTY MODELING IN PIPE DATA
In most cases, data recorded by utilities regarding pipeline failure tend to be either incomplete or contain unreliable information. Sometimes however, the data may be completely false [5], [29], [30]. These factors stand out as the greatest contributors to data uncertainty, hence creating difficulties in estimating failure trends in pipelines [30], [31]. Availability of predictive models fit enough to handle these uncertainties however, brings back hope to both developers and utility management. These models are dynamic enough to be used in incidences where data availability is limited, as well as in incorporation of both theoretic and expert knowledge during the modeling process [3], [30].
Through utilization of available historical records of pipeline data, these models are able to make predictions concerning the future behavior patterns of the pipelines [28], [29], [32]. The patterns identified are assumed to continue into the future, hence are used to predict failure probabilities in the future [29], [32]. This forms the basis of predictive modeling. Therefore, in situations where data availability is limited or incomplete, incorporation of expert or engineering knowledge would enhance modeling. One appropriate technique that may be employed to handle such a scenario is the use of Bayesian Networks (BNs).
A. Overview of Bayesian Networks
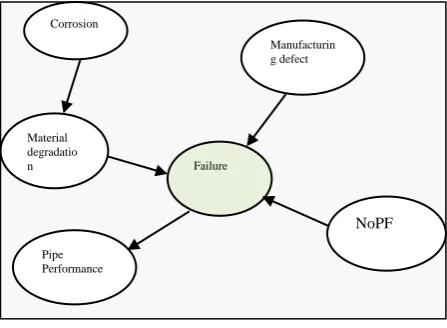
Bayesian Networks (BNs) are graphical models that principally present a system as a network created by interactions of different variables, commencing from a primary cause to the final outcome of an event. Their structures consist of nodes, which represent the system components; and arcs that link the nodes to show probabilistic dependencies between them [33 – 35]. BNs
[image:2.595.326.550.198.362.2]have the ability of integrating several scenarios, interactions and outcomes as well as swapping efficiently between investigation parameters. They also stand out, given their ability to utilize combinations of data and knowledge to model uncertainty, and in their ease of applicability in handling missing data [34], [35]. These properties have made BNs to be frequently considered in modeling environmental systems [35]. Typically, the ultimate system behavior (success or failure) of a BN is determined by the interaction among its components [34]. Fig. 1 illustrates how components of a BN interact for the ultimate success or failure of a system.
Figure 1: Simple Bayesian Network
In Fig. 1, independent components (Corrosion, Performance, Number of Previous Failure (NoPF) and Manufacturing defect) collectively affect fracture. Dependent component(s) (Thinning of pipe wall) however, is a child to its causal parent, but nonetheless, equally affects fracture. Probabilities in BNs can be computed using the Bayes’ theorem, which also enhances appropriate assignment of conditional probabilities [3].
B. Review on Applications of Bayesian Networks in
Pipeline Failure Modelling
There exists a significant body of literature that talks about how BNs have been utilized in predicting pipeline failure, given their enormous ability to handle data uncertainty. In [1], BNs are engaged in assessing deterioration rate of pipes. This is achieved by using Bayesian configurations together with prior knowledge of water assessment procedures, which are then applied to generate weights of influence of failure factors. In [3], BNs are applied to assess the risk of failure of metallic pipes, a process that highly embraced a large combination of numerous factors influential to failure through Bayesian inference. Combination of BNs together with other modeling techniques for an ultimate model creation is also demonstrated in [36] and [37] where BN are coupled with a data oriented Scoring model and Fuzzy Logic (FL) respectively, showcasing diversity and flexibility levels of BNs applicability. Additionally these models indicate that BNs are used to determine a diverse range of aspects regarding pipeline failure including risk of failure [36], [3], pipe deterioration rates [1], pipeline safety [37] among others. In this paper though, the analyses performed are carried out in preparation for the subsequent uncertainty modeling that is to be conducted, where BNs will be applied
Material degradatio n
Pipe Performance
Corrosion
Failure
Manufacturin g defect
to predict leakage incidents based on the dataset discussed below.
IV. THE CASE STUDY
Pipeline maintenance records and data pertaining to pipe network description were collected from Dorinkloof suburbs in the City of Tshwane (CoT), Gauteng province, South Africa. The reason for a regional focus was to decrease several potential variations in the data ranging from environmental to material differences, as well as construction practices so as to minimize uncertainty. In the subsequent sections, we provide a detailed description of the data obtained from the study area. To begin with, a brief history of the study area is provided. The approximate network capacity, number of recorded failure, frequency of failure in different pipe materials and sizes, among other descriptions are reported.
A. The Study Area
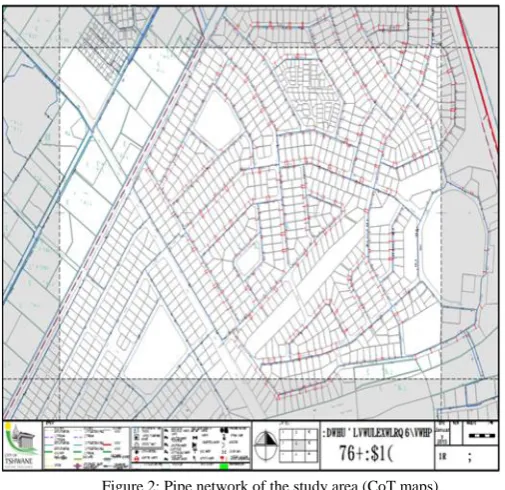
Located in fairly populated and sumptuously developed eastern regions of Pretoria, South Africa, the area contains an estimation of about 1,100 links of distribution pipes that form part of the water pipe network in the region. A link refers to a fraction or a pipe segment that basically forms part of a larger pipe length. In the area of study, the distance between the start and the end of any given link is considered as a complete pipe segment. Any rehabilitation, repair or replacement activity conducted on a link is recorded in the maintenance database, and is identified using the Municipal’s addressing blocks, also known as Erf numbers. The Erf numbers, together with street names and street numbers are then used to determine failure locations along a pipe. Fig.2 shows the pipeline network in the study area.
In Fig.2, an Erf is represented by the symmetrical shapes (mostly rectangular blocks or divisions). Every Erf is placed strategically along a street, basically to ease accessibility. All distribution pipes (in blue) are lined along the street (along pedestrian sidewalks). Service pipes (short or small red connectors) are then used to create a connection between the Erf and the distribution networks. Bulk or trunk water mains are however represented using solid (thick) red color scheme as illustrated in Fig.2.
The water pipe network in the study area is composed of four different types of pipe materials. These materials include Asbestos-Cement (AC) pipes, High-Density Polyethylene (HDPE) pipes, Steel (ST) pipes and unplasticized Polyvinyl Chloride (uPVC) pipes. However, different flavors or versions of these pipes are collectively used in the network as shown in Fig. 3.
AC pipe have been considered to be able to resist attacks from various aggressive corrosive effects of water that commonly affect metallic pipe material [23]. However, these pipes also undergo leeching, a degenerative chemical reaction, which may be compared to electrochemical corrosion in iron pipes [22], [24].
HDPE pipes are however mentioned as the most extensively used plastic pipe material by utilities around the world [25], [26] and are highly popular in transportation and distribution of natural gas. About 80% of new pipe installations currently are of HDPE pipes [26], an aspect that is also noticed in our study area. uPVC and steel pipes are equally reported to be of high exploitation in water
[image:3.595.305.558.85.330.2]distribution networks, thanks to their abilities to withstand high levels of water pressure [27].
Figure 2: Pipe network of the study area (CoT maps)
According to the values presented in Fig.3, uPVC pipes collectively account for an approximated 45% of the total network material composition, followed by HDPE pipes. Steel and AC pipes account for the lowest composition, representing 15% and 5% respectively.
Figure 3: Network material composition
[image:3.595.306.548.408.609.2]50/75/100MM
prior weights will be attached to the failure factors. Investigations on factor weights reported in [1] indicate that the quantity of weight associated with a particular causal variable greatly affects the overall condition or state of a model. This process will precede general pipe deterioration condition estimation as illustrated in (1), a general equation for estimating the deterioration rate of pipelines [38]
, * = G I 1 i
i xi
(1) Where G is the pipe deterioration rate, i is the respective variable; I the total number of variables, λ representing the variable weight and finally, x, the factor position. Taking advantage of parameter fitting possibilities provided by BNs, we will incorporate this estimation into the Bayesian theorem for effective estimation. The unknown parameter θ, in this case, leakage incidence and any other unidentified value are taken to be random variables. Their distributions are derived from prior information and newly available data [39]. This is basically enclosed in a probability function (2):
, ) ( ) ( ) ( ) ( P(y) ) P(y ) P( y) P(
d y P P y PP (2)
Where θ is the factor to be estimated, P (θ|y) represents the posterior likelihood of θ, P(θ) represents the prior probability θ, while P(y|θ) isthe probability function for the possibilityof condition y occurring based on response from the assumed causal associations and the predictor variables.
VI. DATA QUALITY CONCERNS
Major quality concerns with the data obtained from the region were largely related to unknown or unclear timeline information, especially those pertaining to replacement procedures as well as location information. Replacement dates are basically not known even though it was clear that majority of pipelines had been replaced, given the change in pipe material patterns. In addition, information about material switch was equally missing and unidentified during the analysis period.
Identification of the failed sections of pipes was estimated using block and Erf addresses provided by various service providers and assigned contactors who detailed their repair activities as well as through the use the municipal pipeline network maps that were provided. However, this information alone was not sufficient enough for identification of actual failure location in a given pipe segment. In some cases, the failure location listed in the failure record did not match any neighboring pipes in the municipal network map. It was however, assumed in these instances, that the failure record accurately described the pipe location, which was used to update our records.
These assumptions however taken into consideration may not be very helpful or significant in situations where pipeline failure modeling is dependent on critical variables such as pipe material. This is because inclusion of these parameters may introduce biasness into a model given the fact that pipes with fuller records are the only ones that would provide positive values for a particular model.
However, through expert elicitation, missing installation and replacement dates may be assigned using different techniques. An example of how this may be achieved is through introduction of binary categorical variables to
represent the missing data and assumed timelines, especially those that pertain to the replacement dates, and replaced materials. The categorical variables may therefore be used to account for the assumptions made.
VII. SIGNIFICANCE OF THE ANALYSES
Determination of pipeline failure trends especially in regions considered as high risk zones [21] is highly necessary, especially when it comes to prioritization of rehabilitation, repair and replacement activities on pipe facilities in these regions. Prioritization with regards to assessments as well as resource allocation and rehabilitation optimization is equally enhanced if the failure trends are known.
Pipeline failure trends also enhance the ability of utilities to set distribution network requirement specifications with regards to production, installation and operation of these facilities. The trends also improve our understanding of the various levels of uncertainty that accompany pipeline failure in a given region. This may therefore give room for determining various ways on how accuracy and precision during modeling of these failures can be achieved, especially when expert opinions are included.
VIII. CONCLUSION
The data presented for these analyses was availed from a single geographical location, which to a certain extent; represent a number of similarities to the network. These may be in the form of environmental concerns (pipe surrounding), installation guidelines and procedures, among others. However, some aspects of uncertainty were still spotted, especially regarding specific location of various leakages along pipe segments, and not forgetting incidents of missing data.
Nevertheless, this research highlights the importance of recording and keeping of historical failure data by utilities. Utilities are therefore encouraged to conduct leak detection campaigns as well as planned water audits have to enhance identification of possible failures. Additionally, application of basic management procedures involving inspection and data gathering are also of high importance.
Making assumptions during failure modeling is indispensable, given the number of situations that may be unattainable during model development. However, in uncertainty modeling, acknowledgement of assumptions is a necessity. Even so, availability of processes and techniques of achieving acceptable levels of assumption acknowledgement are scarce. We therefore recommend extended research aimed at determining various techniques of tackling assumption acknowledgement in uncertainty modelling.
ACKNOWLEDGMENT
REFERENCES
[1] WANG, C., NIU, Z., JIA, H. & ZHANG, H. 2010. An assessment model of water pipe condition using Bayesian inference. Journal of Zhejiang University-SCIENCE A (Applied Physics & Engineering), 11(7):495-504.
[2] QUE, A. & SADIQ, R. 2015 Evaluating risk of water mains failure using a Bayesian belief network model. European Journal of (Physics & Engineering), 11(7):495-504.
[3] KABIR, G., TESFAMARIAM, S., FRANCISQUE, A. & SADIQ, R. 2015 Evaluating risk of water mains failure using a Bayesian belief network model. European Journal of Operational Research, 240(1):220–234
[4] KLEINER, Y. & RAJANI, B. 2000. Considering time dependent factors in the statistical prediction of water main breaks. In: American Water Works Association: Infrastructure Conference [Online]. Available from: [Accessed: 2015].
[5] MAKAR, J. M. & KLEINER, Y. 2000. Maintaining water pipeline integrity. Baltimore, Maryland.
[6] CLAIR, A. M. S. & SINHA, S. 2012. State-of-the-technology review on water pipe condition, deterioration and failure rate prediction models. Urban Water, 9(2):85-112.
[7] MUHLBAUER, W. K. 2004. Pipeline risk management manual: ideas, techniques, and resources. Gulf Professional Publishing. [8] YOO, D. G., KANG, D., JUN, H. & KIM, J. H. 2014. Rehabilitation
priority determination of water pipes based on hydraulic importance.
Urban water, 6(12) 3864-3887.
[9] BAI, Y. & BAI, Q. 2014. Subsea pipeline integrity and risk
management. Gulf Professional Publishing.
[10] TABESH, M., SOLTANI, J., FARMANI, R. & SAVIC, D. 2009. Assessing pipe failure rate and mechanical reliability of water distribution networks using data-driven modeling. Journal of Hydro informatics, 11(1):1-17.
[11] YAMIJALA, S. 2007. Statistical estimation of water distribution system pipe breaks risk. Master of Science, Texas A&M University.
[12] GIANGRANDE, V. E. H. 2014. TRUNK WATER MAIN
FAILURE CONSEQUENCE MODELLING DURING NORMAL, PEAK AND FIRE FLOW CONDITIONS Masters of Applied Science, Kingston, Ontario, Canada Queen’s University
[13] TABESH, M., SOLTANI, J., FARMANI, R. & SAVIC, D. A. 2009. Assessing Pipe Failure Rate and Mechanical Reliability of Water Distribution Networks Using Data Driven Modelling. Journal of
Hydro informatics, 11(1):1-17.
[14] BUTTRICK, D. B., TROLLIP, N. Y., WATERMEYER, R. B., PIETERSE, N. D. & GERBER, A. A. 2011. A performance based approach to dolomite risk management. Environmental Earth
Sciences, 64(4):1127-1138.
[15] Department of Public Works. 2010. Appropriate development of Infrastructure on dolomite: Manual for consultants
[16] BUTTRICK, D. & VAN SCHALKWYK, A. 1998. Hazard and risk assessment for sinkhole formation on dolomite land in South Africa.
Environmental Geology, 36(1-2):170-178.
[17] Nel 2011
[18] KISHAWY, H. A. & GABBAR, H. A. 2010. Review of pipeline integrity management practices. International Journal of Pressure
Vessels and Piping, 87(7):373-380
[19] MCNEIILL, L. S. & EDWARDS, M. 2001. Iron pipe corrosion in distribution systems. Journal (American Water Works Association), 93(7):88-100.
[20] MORRIS, R. 1967. Principal causes and remedies of water main breaks. Journal (American Water Works Association), 59(7):782-798. [21] DIOP, S., STAPELBERG, F., TEGEGN, K., NGUBELANGA, S. & HEATH, L. 2011. A review on Problem Soils in South Africa. Western Cape, South Africa: Council for Geoscience.
[22] BOXALL, J., O'HAGAN, A., POOLADSAZ, S., SAUL, A. & UNWIN, D. 2007. Estimation of burst rates in water distribution mains. Institution of Civil Engineers-Water Management, 160(2):73-82.
[23] BUELOW, R. W., MILTETTE, J. R., MCFARREN, E. F. & SYMONS, J. M. 1980. The behavior of asbestos-cement pipe under various water quality conditions: a progress report. Journal
(American Water Works Association):91-102.
[24] AL-ADEEB, A. & MATTI, M. 1984. Leaching corrosion of asbestos cement pipes. International Journal of Cement Composites and
Lightweight Concrete, 6(4):233-240.
[25] SKJEVRAK, I., DUE, A., GJERSTAD, K. O. & HERIKSTAD, H. 2003. Volatile organic components migrating from plastic pipes (HDPE, PEX and PVC) into drinking water. Water research, 37(8):1912-1920.
[26] KRISHNASWAMY, R. K. 2005. Analysis of ductile and brittle failures from creep ruptures testing of high-density polyethylene (HDPE) pipes. Polymer, 46(25):11664-11672.
[27] CASSA, A., VAN ZYL, J. & LAUBSCHER, R. 2006. A numerical investigation into the behaviour of leak openings in uPVC pipes under pressure. Paper presented at the WISA2006 The Water Institute of
Southern Africa Biennial Conference and Exhibition, South Africa.
[28] RAJANI, B. & KLEINER, Y. 2001. Comprehensive review of structural deterioration of water mains: physically based models.
Urban Water, 3(3):151–164.
[29] MAILHOT, A., POULIN, A. & VILLENEUVE, J. 2003. Optimal replacement of water pipes. WATER RESOURCES RESEARCH, 39(5):11-36.
[30] MARGARITIS, D. 2003. Learning Bayesian Network Model Structure from Data. Doctor of Philosophy, Pittsburgh, Carnegie Mellon University.
[31] LE-GAT, Y. & EISENBEIS, P. 2000. Using maintenance record to forecast future failures in water networks. Urban Water, 2(3):173– 181.
[32] KLEINER, Y. & RAJANI, B. 2001. Comprehensive review of structural deterioration of water mains: statistical models. Urban
Water, 3(3):131–150.
[33] BEN-GAL, I., RUGGERI, F., FALTIN, F. & KENETT, R. 2007. Bayesian Networks. In: Encyclopedia of Statistics in Quality & Reliability. ,
[34] DOGUC, O. & RAMIREZ-MARQUEZ, J. E. 2008. A generic method for estimating system reliability using Bayesian networks.
Reliability Engineering and System Safety, 92(2):542– 550.
[35] VOINOV, A., BOUSQUET, F., 2010. Modelling with stakeholders. Environmental Modelling and Software 25, 1268-1281.
[36] BABOVIC, V., DRECOURT, J. P., KEIJZER, M. & HANSEN, P. F. 2002. A data mining approach to modeling of water supply assets.
Urban Water(4):401–414
[37] KABIR, G., SADIQ, R. & TESFAMARIAM, S. 2015. A fuzzy Bayesian belief network for safety assessment of oil and gas pipelines. Structure and Infrastructure Engineering(1):1-16. [38] ROGERS, P. D. & GRIGG, N. S. 2009. Failure assessment modeling
to prioritize water pipe renewal: two case studies. Journal of
Infrastructure Systems, 15(3):162-171.