JOURNAL OF FOREST SCIENCE, 64, 2018 (6): 260–270 https://doi.org/10.17221/7/2018-JFS
Spatial patterns of trees from different development stages
in mixed temperate forest in the Hyrcanian region of Iran
Maryam KAZEMPOUR LARSARY
1*, Kambiz TAHERI ABKENAR
1,
Hassan POURBABAEI
1, David POTHIER
2,3, Beitollah AMANZADEH
41Department of Forestry, Faculty of Natural Resources, University of Guilan, Somehsara, Iran 2Centre d’étude de la forêt (CEF), Québec, Canada
3 Département des sciences du bois et de la forêt, Faculté de foresterie, de géographie
et de géomatique, Université Laval, Québec, Canada
4 Center of Research and Education of Agriculture and Natural Resources of Guilan Province,
Rasht, Iran
*Corresponding author: [email protected]
Abstract
Kazempour Larsary M., Taheri Abkenar K., Pourbabaei H., Pothier D., Amanzadeh B. (2018): Spatial patterns of trees from different development stages in mixed temperate forest in the Hyrcanian region of Iran. J. For. Sci., 64: 260–270.
Mixed beech (Fagus orientalis Lipsky) forests are very important to the Hyrcanian region of Iran because of their high degree of naturalness and as a source of wood production. Determination of tree spatial patterns over development stages is a first step in understanding underlying processes driving regeneration and forest dynamics. Spatial patterns of trees from three development stages (initial, optimal and decay) of an untouched mixed beech forest were quanti-fied within three 1-ha plots. To prepare the stem maps, we measured each tree with a DBH larger than 7.5 cm using the azimuth-distance method. Spatial patterns were then analysed using Ripley’s K-function. Results indicated that the number of trees decreased from the initial stage to the decay stage, with tree spatial patterns being aggregated, slightly aggregated and highly randomized for initial, optimal and decay stages, respectively. Differences in spatial patterns among the development stages are not unexpected considering that such unmanaged forests are driven by gap dynamics which results in interactions between gap filling individuals.
Keywords: close-to-nature silviculture; gap dynamics; mixed beech forests; Ripley’s K-function
The Hyrcanian vegetation zone is part of the most ancient forests of the world (Marvie Mohadjer 2011) and forms a green belt covering the slopes of the Alborz mountain range and the southern coasts of the Caspian Sea. These forests are simi-lar to broadleaved forests of central Europe, but are richer in terms of species diversity (Marvie Mohadjer 2011). Oriental beech (Fagus orientalis Lipsky) has an important role in the succession dy-namics of these forests and is considered to be one of the main late-successional species in the forests
patches characterized by these three stages occur-ring adjacent to each other in space or developing in a cycle over time (Sagheb-Talebi et al. 2003; Delfan Abazari et al. 2004). The initial stage is characterized by rapid young tree growth that leads to a gradual canopy closure, subsequent high mor-tality in dense regeneration due to light competi-tion. Although the stand structure at the early ini-tial stage is still uneven-aged and multilayered, at the late initial stage, the stand structure gradually shifts to almost a single story as the remaining over-story trees die (Korpel 1995; Emborg et al. 2000). Later, the optimal stage is built by a single-layered dense canopy with small dead standing trees and little regeneration. The stand dynamics of this stage is very similar to that of managed even-aged stands (Korpel 1995; Emborg et al. 2000). In the decay stage, stem density and stand volume decrease as a result of mortality of older trees, which creates gaps that promote tree seedling establishment and development (Korpel 1995; Emborg et al. 2000).
Determining the spatial pattern of trees in each of these development stages may help to describe the dynamics of these forests by providing informa-tion on changes in between plant-plant interacinforma-tions from one development stage to the other (Dimov et al. 2005). Furthermore, better understanding of tree spatial patterns over a time gradient provides guidance for managers practicing close-to-nature silviculture intended to conserve or restore natu-rally established stand structures while prevent-ing unplanned removals (Abdollahpour, Assadi Atui 2005). Generally, there are three main tree spatial patterns in natural communities: (i) clumped or aggregated, (ii) regular or uniform, (iii) random (Wong, Lee 2005). A specific tree spatial pattern may result from various underlying mechanisms such as seed dispersal, inter- and intra-specific com-petition, ecosystem disturbances, herbivory or site heterogeneity (Wiegand, Moloney 2004). Ran-dom spatial patterns between individuals are pro-duced by nonselective behavioural patterns and site homogeneity, but may also appear temporarily when clumped patterns shift to regular patterns because of density-dependent mortality (Reyburn 2011).
Spatial point pattern analysis can be useful in surveying tree species and their associates, deter-mining the effectiveness of silvicultural interven-tions, selecting an appropriate forest inventory method, marking trees for a partial cutting treat-ment, improving the understanding of natural pro-cesses and is consequently an important tool in environmental planning and protection (Maltez-Mouro et al. 2007; Wiegand et al. 2007).
Ripley’s K-function is effective to describe tree spatial patterns at different scales (Kiani et al. 2011) and has often been used in the Hyrcanian forests (Akhavan et al. 2010, 2012; Sagheb-Talebi 2014; Amanzadeh et al. 2015) and elsewhere (Wang et al. 2003; Rozas et al. 2009; Zenner, Peck 2009; Lee et al. 2012; Poznanovic et al. 2014) within the last decade. In the Guilan province of Iran, Pour- babaei et al. (2004) characterized a random spatial pattern of maple (Acer platanoides Linnaeus) that was associated with its seed production. Habashi et al. (2007) found different spatial patterns be-tween species composing mixed Hyrcanian beech
(F. orientalis) forest while Akhavan et al. (2010)
ob-served different spatial patterns between develop-ment stages of Hyrcanian beech stands. Karami et al. (2012) concluded that both random and clumped patterns characterized the seedling spatial arrange-ment in regeneration patches of natural beech for-ests of Iran. Finally, Sagheb-Talebi (2014) found different tree spatial patterns in initial, optimal and decay stages of four old-growth oriental beech stands that were explained by climate driven differ-ences in tree density and beech tree abundance.
In Hyrcanian forests, no studies on tree spatial patterns have been carried out in different devel-opment stages of unmanaged mixed beech forests. In this study, we analysed tree spatial patterns of species within different development stages to ad-dress these questions. The results obtained from this study may be useful to establish comparisons with pure stands of oriental beech and in develop-ing silvicultural programs of natural processes.
MATERIAL AND METHODS
Study area. The study site is located in the Hyr-canian forest of the Sistan district in northern Iran (longitudes 49°49'4''E to 49°53'15''E, latitudes 36°55'10''N to 36°58'16''N) (Fig. 1). The study area covers 59 ha with an elevation range between 350 and 750 m a.s.l., average annual temperature of 14°C and average annual precipitation of 1,273 mm. Pre-cipitation is distributed evenly throughout the year, preventing drought periods. Soils are acidic brown or forest brown with textures varying from clay to clay-loam, mostly with granular structure and low permeability rate. The study area consists of a natu-rally mixed deciduous forest dominated by beech
(F. orientalis) and with a lower proportion of
Caucasian alder (Alnus subcordata C.A. von Mey-er), wych elm (Ulmus glabra Hudson), persimmon
(Diospyros lotus Linnaeus), ironwood (Parrotia
per-sica (de Candolle) C.A. von Meyer) and lime (Tilia
begonifolia Steven). Because the study area is
ex-posed to events of periodic wind disturbances, it is composed of a mosaic of small forest patches, each corresponding to a specific development stage, but forming an uneven-aged forest on the whole. The study area has developed with minimalhuman dis-turbance and without silvicultural interventions during the last decades. Hence, this forest repre-sents an untouched and unmanaged natural forest typical of ancient native forests to this region.
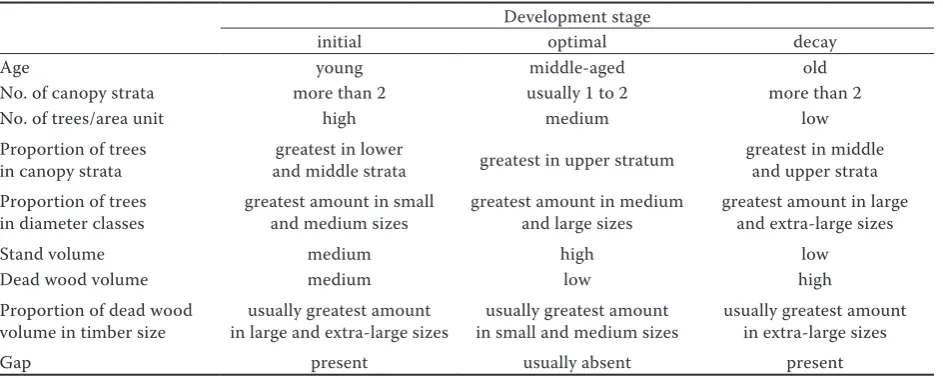
Data collection. We first conducted a forest sur-vey in the study area to locate forest patches cor-responding to different development stages. To determine the development stage of each forest patch, we used the same criteria as those of previ-ous studies: the number and volume of stems, dead
wood volume, proportion of dead wood volume by diameter class, proportion of volume by diam-eter class, presence of canopy gaps and number of tree layers (Table 1) (Delfan Abazari et al. 2004; Talebi et al. 2005; Eslami, Sagheb-Talebi 2007; Mataji, Sagheb-Sagheb-Talebi 2007; Akhavan et al. 2012; Sagheb-Talebi 2014). Then, three forest patches were randomly selected to establish 1-ha (100 m × 100 m) sample plots dur-ing the summer of 2015 in each of three develop-ment stages (initial, optimal and decay). Previous studies have confirmed the appropriateness of the 1-ha plot size to conduct the structure studies of oriental beech stands in Iran (Sagheb-Talebi, Schütz 2002; Eslami, Sagheb-Talebi 2007). All plots were established in mixed beech stands with the same local climate, elevation, soils, aspect and slope. These plots had eastern aspect with an aver-age slope of about 24°. In each plot, we recorded the species height and diameter of all trees with DBH larger than 7.5 cm along with their spatial coordinates using slope-corrected distances and azimuths from a reference point (i.e., the south-west corner of each plot). Distances and azimuths were transformed to Cartesian coordinates, and all measured trees were assigned to one of the four diameter classes: small (DBH ≤ 32.5 cm), me-dium (32.5 cm < DBH ≤ 52.5 cm), large (52.5 cm < DBH ≤ 72.5 cm), and extra-large (DBH > 72.5 cm) (Akhavan et al. 2012; Zenner et al. 2015).
Furthermore, the vertical structure of trees was analysed using the IUFRO classification scheme (Marvie Mohadjer 2011). This scheme catego-rizes a vertical structure of vegetation into upper, middle and lower story.
[image:3.595.65.290.57.226.2]Statistical analysis. We used univariate Ripley’s K-function to analyse the spatial pattern of trees in Fig. 1. Geographic map of the study area and spatial
posi-tion of the three 1-ha plots in reference to one another
Table 1. Criteria for identifying the three development stages
Development stage
initial optimal decay
Age young middle-aged old
No. of canopy strata more than 2 usually 1 to 2 more than 2
No. of trees/area unit high medium low
Proportion of trees
in canopy strata and middle stratagreatest in lower greatest in upper stratum greatest in middle and upper strata Proportion of trees
in diameter classes greatest amount in small and medium sizes greatest amount in medium and large sizes greatest amount in large and extra-large sizes
Stand volume medium high low
Dead wood volume medium low high
Proportion of dead wood
volume in timber size in large and extra-large sizesusually greatest amount in small and medium sizesusually greatest amount usually greatest amount in extra-large sizes
[image:3.595.64.536.569.758.2]–
each of the three development stages. This function considers the distance between all pairs of points (trees) in a two-dimensional space by using the num-ber of points available in a circle of radius r centred on each tree. The univariate estimator of the K -func-tion for a certain point pattern is calculated as Eq. 1:
ρ r r
n
K (1)
where:
n(r) – mean number of neighbours within a distance r
from a subject tree, ρ – stand density.
To facilitate the interpretation of results, we used the linearized L-function presented by Besag (1977). The L-function modifies the shape of the K -function, stabilizes its variance (Cressie 1993) and is calculated as Eq. 2:
πr
r K
L r (2)
Values of Lr = 0 indicate a random spatial pat-tern while values smaller and larger than 0 corre-spond to regular and aggregated spatial patterns, respectively. We applied Ripley’s isotropic correc-tion formula for edge correccorrec-tion (Ripley 1988). To test the statistical significance of the deviation of Lr values from zero under the null hypothesis of complete spatial randomness, we used the Monte Carlo simulation method. Wecomputed the 95% confidence interval of Lr with 99 random permu-tations. In this study, the range of distances used to calculate the L-function ranged between 0 and 50 m. The maximum value of r = 50 m is equal to one half of the side of each 1-ha (100 m × 100 m) plot (Salas et al. 2006; Zhang et al. 2009). The software package used for the geostatistical analy-sis was GS+ (Version 5.1, 2000) and all statistical analyses and simulations were conducted using the Programita for point pattern analysis (Wiegand 2006).
RESULTS
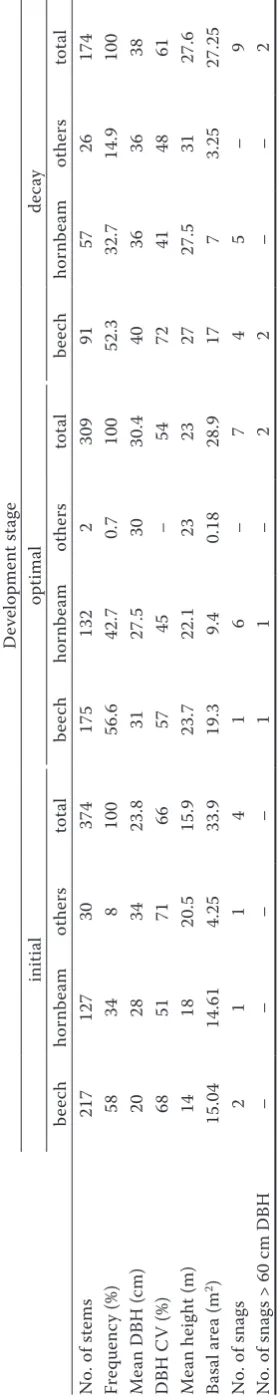
We measured the diameter and determined the Cartesian coordinates of 857 trees in the three sample plots. The initial stage had the highest fre-quency of shorter trees whereas the decay stage was mostly composed of mature trees, and the optimal stage showed a bell-shaped, skewed distribution of tree frequency (Fig. 2).
Mean tree DBH increased from initial to decay stages, while the number of trees followed the op- Table 2. S
pe cie s c harac ter istic
s of e
ac h de ve lopmen t st age ( ba se
d on 1-ha ar
ea) D eve lopmen t st age initi al optimal de cay beec h hor nb eam ot hers tot al beec h hor nb eam ot hers tot al beec h hor nb eam ot hers tot al
No. of st
ems 217 127 30 374 175 132 2 309 91 57 26 174 Fr equenc y (%) 58 34 8 100 56.6 42.7 0.7 100 52.3 32.7 14.9 100 M
ean DBH (
cm) 20 28 34 23.8 31 27.5 30 30.4 40 36 36 38 DBH C V (%) 68 51 71 66 57 45 – 54 72 41 48 61 M ean heig ht (m) 14 18 20.5 15.9 23.7 22.1 23 23 27 27.5 31 27.6 Ba sal ar ea (m 2) 15.04 14.61 4.25 33.9 19.3 9.4 0.18 28.9 17 7 3.25 27.25
No. of snag
s 2 1 1 4 1 6 – 7 4 5 – 9
No. of snag
s > 60 c
m DBH – – – – 1 1 – 2 2 – – 2 C
V – c
oeffic
ien
t of v
ar ia tion, ot hers – Acer vel uti nu m B oi ssier , Acer c app ado cicu m Gle dit sc h, A lnu s su bcord at a C .A
. von M
eyer , Ul m us gl abr a H ud son, D io spy ro s lotu s L innae us , Pa rroti a per sic a (de C andolle) C .A
. von M
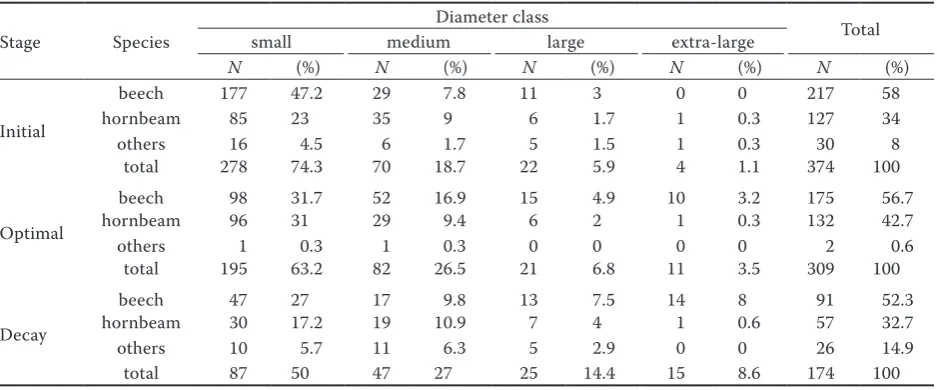
[image:4.595.324.464.57.758.2]posite trend (Table 2). Accordingly, the initial stage was associated with the largest stem number, the smallest average DBH and the highest coefficient of variation of DBH (Table 2). In the optimal stage, all trees had about the same height and DBH, as indicated by the lowest CV of DBH (Table 2). The decay stage can be recognized by the lowest stem number and basal area (Table 2) and by the greater proportion of trees in large and extra-large DBH classes (Table 3). The stem density of F. orientalis was higher than that of C. betulus in all develop-ment stages (Table 2). Similarly, the DBH of F.
ori-entalis was always larger than that of C. betulus
except in the initial stage, indicating that small di-ameter trees in this stage were mostly F. orientalis (Table 2). F. orientalis was less represented in the smallest DBH class of the decay stage compared to other stages, while species other than F.
orien-talis and C. betulus were more represented in the
decay stage in almost all DBH classes (Table 3). Frequencyof F. orientalis was higher than that of
C.betulus and other species in lower, middle and
upper stories at all development stages except in the initial stage for which the frequencyof C.
be-tulus was slightly higher than that of F. orientalis
in the upper storey (Table 4).
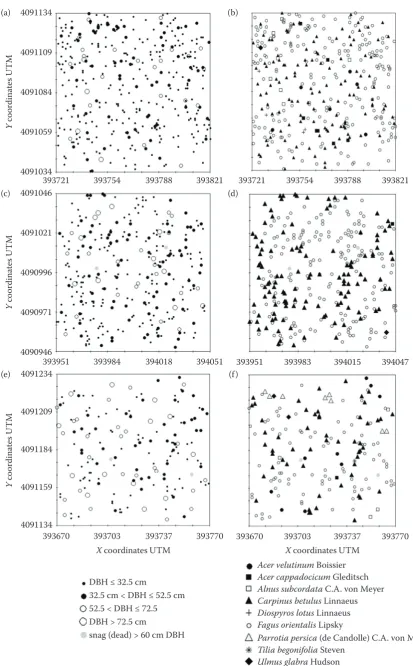
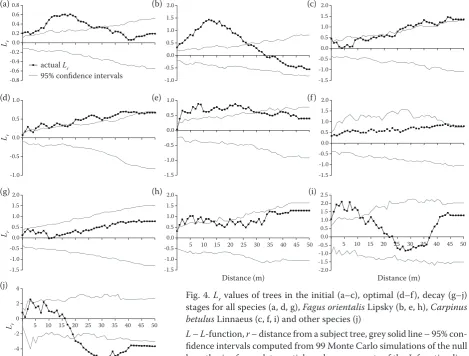
Stem maps of the initial stage were drawn to rep-resent tree diameter class and tree species (Figs 3a, b). Trees in the initial stage were mostly clumped from 0 to 28 m, although randomly distributed be-tween 28 and 50 m (Figs 4a–c).This spatial pattern correspondedapproximately to that of F. orientalis while the spatial distribution of C. betulus was
ran-Table 3. Frequency (%) and stem number (N) by species for each development stage for each of the following diameter
classes
Stage Species
Diameter class
Total
small medium large extra-large
N (%) N (%) N (%) N (%) N (%)
Initial
beech 177 47.2 29 7.8 11 3 0 0 217 58
hornbeam 85 23 35 9 6 1.7 1 0.3 127 34
others 16 4.5 6 1.7 5 1.5 1 0.3 30 8
total 278 74.3 70 18.7 22 5.9 4 1.1 374 100
Optimal
beech 98 31.7 52 16.9 15 4.9 10 3.2 175 56.7
hornbeam 96 31 29 9.4 6 2 1 0.3 132 42.7
others 1 0.3 1 0.3 0 0 0 0 2 0.6
total 195 63.2 82 26.5 21 6.8 11 3.5 309 100
Decay
beech 47 27 17 9.8 13 7.5 14 8 91 52.3
hornbeam 30 17.2 19 10.9 7 4 1 0.6 57 32.7
others 10 5.7 11 6.3 5 2.9 0 0 26 14.9
total 87 50 47 27 25 14.4 15 8.6 174 100
[image:5.595.66.287.62.180.2]small – DBH ≤ 32.5 cm, medium – 32.5 cm < DBH ≤ 52.5 cm, large – 52.5 cm < DBH ≤ 72.5 cm, extra-large – DBH > 72.5 cm
Table 4. Frequency (%) and stem number (N) by species
for each development stage for each of the following stand storeys
Stage Species
Stand story
lower middle upper
N (%) N (%) N (%)
Initial
beech 103 27.5 65 17.4 49 13
hornbeam 27 7 41 11 59 16
others 9 2.5 6 1.6 15 4
total 139 37 112 30 123 33
Optimal
beech 19 6.1 51 16.5 105 34 hornbeam 8 2.6 41 13.3 83 26.9
others 1 0.3 0 0 1 0.3
total 28 9 92 29.8 189 61.2
Decay
beech 27 15.5 23 13.2 41 23.6
hornbeam 7 4 20 11.5 30 17.2
others 5 2.9 5 2.9 16 9.2
total 39 22.4 48 27.6 87 50 Top heights were 28, 31 and 37.6 m for initial, optimal and decay stages, respectively
0 20 40 60 80 100 120
[image:5.595.305.532.276.468.2]10 20 30 40 50 60 70 80 90 100 110 120
Fig. 2. Stem diameter distribution in each developmental stage
Diameter class (cm)
No. of tr
ee
s p
er he
ct
ar
e Initial
[image:5.595.64.533.549.744.2]Fig. 3. Spatial patterns of trees in the initial (a, b), optimal (c, d), decay (e, f) stages by tree DBH (a, c, e) and also tree species (b, d, f)
DBH ≤ 32.5 cm
32.5 cm < DBH ≤ 52.5 cm 52.5 < DBH ≤ 72.5 DBH > 72.5 cm
snag (dead) > 60 cm DBH
Acer velutinum Boissier Acer cappadocicum Gleditsch Alnus subcordata C.A. von Meyer Carpinus betulus Linnaeus Diospyros lotus Linnaeus Fagus orientalis Lipsky
Parrotia persica (de Candolle) C.A. von Meyer Tilia begonifolia Steven
Ulmus glabra Hudson snag (dead) > 60 cm DBH 4091134
4091109
4091084
4091059
4091034
Y
c
oor
dina
te
s U
TM
393721 393754 393788 393821 393721 393754 393788 393821
X coordinates UTM X coordinates UTM
393951 393983 394015 394047 4091046
4091021
4090996
4090971
4090946
393951 393984 394018 394051 4091234
4091209
4091184
4091159
4091134
393670 393703 393737 393770 393670 393703 393737 393770
Y
c
oor
dina
te
s U
TM
Y
c
oor
dina
te
s U
TM
(a) (b)
(c) (d)
dom between 0 and 28 m and slightly clumped for longer distances (Figs 4b, c).
Compared to the initial stage, tree density in the optimal stage was lower, particularly for the small-est diameter class (DBH ≤ 32.5 cm) (Fig. 3c). Also, the tree diameter distribution was more uniform (Fig. 3d), as indicated by the smaller value of the coefficient of variation (Table 2).
When all species were included in the analysis of the optimal stage, Lr values were generally slightly higher than the 95% confidence interval, regard-less of the distance between trees (Fig. 4d), indi-cating a slightly clumped pattern. However, when
F. orientalis was considered alone, a clear clumped
pattern was apparent for distances < 30 m, while
C. betulus showed a clumped pattern for all
dis-tances (Figs 4e, f).
At the decay stage, tree density was significantly lower than those of the two previous stages. In ad-dition, the coefficient of variation of DBH for the decay stage was lower than that of the initial stage but higher than that of the optimal stage (Table 2, Fig. 3e). At this stage, the frequency of F.
orienta-lis was lower, but tree numbers of shade-intolerant
A. velutinum, A. cappadocicum, A. subcordata and
mid-shade-tolerant U. glabra, P. persica and T.
be-gonifolia species were larger (Fig. 3f).
When all species of the decay stage were consid-ered together, Lr values were within the 95% confi-dence interval for all distances, which indicates a random spatial distribution (Fig. 4g). In addition, since these Lr values were closer to zero than those of the optimal stage, they may be interpreted as a higher degree of randomness. F. orientalis and
C. betulus showed clumped patterns for distances
< 12 m, but random patterns for distances ≥ 12 m (Figs 4h, i). Other species in the decay stage showed a random pattern for distances < 20 m and a regu-lar pattern from 20 to 50 m (Fig. 4j).
DISCUSSION
Since the three development stages were sam-pled in areas with similar climate, soil and topog-raphy, our study shows the basic differences in the
-0.8 -0.6 -0.4 -0.2 0.0 0.2 0.4 0.6 0.8
-1.0 -0.5 0.0 0.5 1.0 1.5 2.0
-1.5 -1.0 -0.5 0.0 0.5 1.0 1.5 2.0
-1.0 -0.5 0.0 0.5 1.0
-1.5 -1.0 -0.5 0.0 0.5 1.0 1.5 2.0
-1.5 -1.0 -0.5 0.0 0.5 1.0
-1.5 -1.0 -0.5 0.0 0.5 1.0 1.5 2.0
-1.5 -1.0 -0.5 0.0 0.5 1.0 1.5 2.0
5 10 15 20 25 30 35 40 45 50
-2.0 -1.5 -1.0 -0.5 0.0 0.5 1.0 1.5 2.0 2.5
5 10 15 20 25 30 35 40 45 50
-6 -4 -2 0 2 4
[image:7.595.64.534.372.728.2]5 10 15 20 25 30 35 40 45 50
Fig. 4. Lr values of trees in the initial (a–c), optimal (d–f), decay (g–j)
stages for all species (a, d, g), Fagus orientalis Lipsky (b, e, h), Carpinus
betulus Linnaeus (c, f, i) and other species (j)
L – L-function, r – distance from a subject tree, grey solid line – 95%
con-fidence intervals computed from 99 Monte Carlo simulations of the null
hypothesis of complete spatial randomness; parts of the L-function line
that are above, below, and within confidence intervals indicate clumped, regular, and random spatial patterns, respectively
Distance (m)
Distance (m) Distance (m) Lr
Lr Lr Lr
actual Lr
95% confidence intervals
(a) (b) (c)
(d) (e) (f)
(g) (h) (i)
spatial structures of Hyrcanian forests dominated
by F. orientalis in Northern Iran. The main results
of this study indicate that the clumped spatial dis-tribution of trees generally observed at the initial stage of this mixed beech forest becomes increas-ingly random over time. The following paragraphs explain the reasons for these temporal changes in horizontal structure and discuss the implications for forest management.
The spatial distribution of species using seed re-generation strategies is largely determined by seed dispersal (Calviño-Cancela 2002). Since the co-hort of small trees was dominated by F. orientalis at the initial stage, the observed clumped distribu-tion of trees was likely related to the limited seed dispersal of this species caused by its heavy seeds (Habashi et al. 2007; Hassani, Amani 2010; Akhavan et al.2012) and to seedbed conditions. Once established, the shade-tolerant seedlings of this species can survive and develop in the under-storey to form clumped distributions at short dis-tances (< 28 m) of parent trees (Hou et al. 2004; Hao et al. 2007). This observation agrees with the results of the study by Sagheb-Talebi (2014), who observed a clumped distribution of beech trees in young stands of the Neka region of Iran at scales shorter than 25 m. Over time, however, competi-tion for resources will lead to mortality among indi-viduals within clumps, which will gradually change the spatial distribution of trees from clumped to random (Hegazy, Kabiel 2007; Lan et al. 2012).
At the initial stage, while a clumped pattern of
F. orientalis was observed for distances < 28 m,
distances > 28 m were characterized by a random pattern. According to Salas et al. (2006), clumped patterns are common for small trees (DBH ≈ 10 cm) located in canopy gaps. In addition, clumped pat-terns are typically observed in naturally regenerat-ed stands (Akhavan et al. 2012), but not in all cases (Amanzadeh et al. 2015). Indeed, as competition decreases with increasing between-tree distance, a random tree distribution gradually appeared at dis-tances larger than 20 m from a subject tree (Fig. 4b). This distance likely corresponds to the average size of the former canopy gaps that were filled by a clumped regeneration stratum of F. orientalis. Sim-ilar results have been reported by Omidvar Hos-seini et al. (2015), who observed a clumped pattern of the heavy-seeded chestnut-leaved oak (Quercus
castaneifolia C.A. von Meyer) at short distances in
dense stands while the spatial distribution shifted to random as distance increased.
In contrast with F. orientalis, the distribution of
C. betulus trees at the initial stage gave ambiguous
results: neither distinctly random no clustered pat-terns for all distances from the subject tree (Fig. 4c). On the one hand, winged seedsof C. betulus trees can be easily dispersed (Chapolagh Paridari et al. 2012), which promotes the formation of a ran-dom tree distribution. On the other hand, the light requirements of this mid-shade-tolerant species suggest that regeneration development should be clumped in canopy gaps where light is more avail-able. Hence, the marginal random-clumped tree distribution of C. betulus may result from these two opposing processes as well as the rapid colonization of regeneration niches by F. orientalis in this par-ticular sample plot (Amanzadeh 2015).
The number of small diameter trees (≤ 32.5 cm) in the optimal stage was about 11% lower than that at the initial stage (Table 3). This indicates that mor-tality induced by intra- and/or interspecific com-petition, which mostly affects suppressed trees, was effective at this stage to create a more regular spatial pattern when all species were considered together (Fig. 4d). Such tree spatial patterns were also observed by Sagheb-Talebi (2014) in beech stands at the optimal stage from the Kelardasht re-gion of Iran.
The clumped tree distribution of F. orientalis ob-served at the initial stage was still apparent at the optimal stage (Fig. 4e). In addition, the tree spatial pattern of C. betulus was clearly clumped at the op-timal stage (Fig. 4f) as was also observed by Lee et al. (2012) for Carpinuscordata Blume. When all species were considered together, however, the dis-tinct clumping of F. orientalis and C. betulus was obscured; instead, an only marginally clumped tree pattern emerged (Fig. 4d). It thus seems that the juxtaposition of clumped tree distributions of both
F. orientalis and C. betulus, each at different spatial
locations in the stand, produced an overall tenden-cy to randomization in the tree spatial pattern.
at short between-tree distances (< 13 m). Because these clumps are likely composed of regularly spaced individuals as a result of intraspecific com-petition, tree spatial distribution becomes random when all species are considered at the same time. As for larger trees, they generally tend to be regu-larly distributed in a forest stand (He et al. 1997; Sagheb-Talebi 2014). Such tree spatial pattern at this stage was also observed by Sagheb-Talebi (2014) in beech stands of the Shastkolateh region of Iran. Cheng et al. (2014) found that overma-ture trees tend to exhibit a random pattern at al-most all scales because of stochastic mortality or strong intra- and/or interspecific competition for resources.
As a general rule, clumped tree distributions are the result of regeneration establishment and de-velopment that occurred in medium to large gaps as a result of improved light and moisture regimes (Amanzadeh 2015). Over time, intra- and/or in-terspecific competition, which produces density-dependent mortality, can lead to a less aggregated or even regular tree distribution (Hou et al. 2004). Accordingly, our results show that both beech and hornbeam trees were spatially clustered at all three stages. However, when all species are considered together, the spatial pattern shifts from highly clus-tered (initial stage) through marginally clusclus-tered (optimal stage) to random (decay stage). This result is consistent with the findings of Commarmot et al. (2005), who examined the spatial patterns of virgin beech (F. sylvatica) trees in stands of vari-ous ages in Ukraine. They concluded that old trees tended to be randomly distributed, but trees in the lower storey, and to a lesser degree in the middle storey, tended to be aggregated. Establishment of tree regeneration in gaps created by tree mortal-ity was proposed to explain the formation of these clusters.
Knowledge of tree spatial distributions in unman-aged stands is essential to the 18 effective applica-tions of close-to-nature silvicultural approaches in managed stands. Consequently, implementation of management decisions should be related to the principal characteristics of mixed beech stands at each stage of their development. The primary ob-jectives of these interventions include the improve-ment of stand structure and composition, with a particular emphasis on regeneration establishment (Parhizkar et al. 2011). Uneven-aged mixed for-ests are generally resistant to natural disturbances while providing sustainable production (Alijani et al. 2014); to emulate these stand conditions, implementation of silvicultural treatments may be
an important step in promoting and maintaining a multilayered structure (Parhizkar et al. 2011; Sagheb-Talebi 2014).
In accordance with our results, we give examples of silvicultural interventions that may be applied at each development stage. At the initial stage, since self-thinning seems to be the principal pro-cess among trees in the lower and middle storeys, crop tree thinning could be applied to accelerate this natural process and, alternatively, to promote tree diversity. Because the optimal stage is charac-terized by a structure resembling that of managed even-aged stands, commercial utilization can be applied to promote the diameter growth of domi-nant trees and to help establish natural regenera-tion of shade-tolerant tree species. At the decay stage, protection of tree regeneration seems essen-tial in order to promote it. Moreover, information derived from this study gave us insight into com-petitive processes for modelling of forest dynam-ics and could also be useful as a key reference to improve the use of growth models.
References
Abdollahpour M., Assadi Atui A.R. (2005): Entwicklung der geregelten Forstwirtschaft im Iran. In: Nosrati K., Marvie Mohadjer R., Bode W., Knapp H.D. (eds): Schutz der Biologischen Vielfalt und integriertes Management der Kaspischen Wälder (Nordiran). Bonn, Bundesamt für Naturschutz: 99–120.
Akhavan R., Sagheb-Talebi K., Hassani M., Parhizkar P. (2010): Spatial patterns in untouched beech (Fagus ori-entalis Lipsky) stands over forest development stages in Kelardasht region of Iran. Iranian Journal of Forest and Poplar Research, 18: 322–336. (in Persian)
Akhavan R., Sagheb-Talebi K., Zenner E.K., Safavimanesh F. (2012): Spatial patterns in different forest development stages of an intact old-growth Oriental beech forest in the Caspian region of Iran. European Journal of Forest Research, 131: 1355–1366.
Alijani V., Sagheb-Talebi K., Akhavan R. (2014): Quantifying structure of intact beech (Fagusorientalis Lipsky) stands at different development stages (case study: Kelardasht area, Mazandaran). Iranian Journal of Forest and Poplar Research, 21: 396–410. (in Persian)
Amanzadeh B. (2015): Investigation on structure, natural stand development stages and ecological characteristics of canopy gaps in mixed stands of Nav forests, Asalem. [Ph.D. Thesis.] Sari, Sari Agricultural Sciences and Natural Resources University: 208. (in Persian)
asso-ciation of trees in mixed hornbeam stands using univariate and bivariate Ripley’s K-function (case study: reserve area, district 3 of Asalem forests). Iranian Journal of Forest and Poplar Research, 23: 37–52. (in Persian)
Besag J. (1977): Contribution to the discussion of Dr. Ripley’s paper. Journals of the Royal Statistical Society, Series B, 39: 193–195.
Calviño-Cancela M. (2002): Spatial patterns of seed dispersal and seedling recruitment in Corema album (Empertaceae): The importance of unspecialized dispersers for regenera-tion. Journal of Ecology, 90: 775–784.
Chapolagh Paridari A., Jalali G., Sonboli A., Zarafshar M. (2012): Seed and bract morphotypes of Carpinus betulus. Journal of Applied Biology, 1: 16–29. (in Persian)
Cheng X., Han H., Kang F., Song Y., Liu K. (2014): Point pat-tern analysis of different life stages of Quercus liaotungensis in Lingkong Mountain, Shanxi Province, China. Journal of Plant Interactions, 9: 233–240.
Commarmot B., Bachofen H., Bundziak Y., Bürgi A., Ramp B., Shparyk Y., Sukhariuk D., Viter R., Zingg A. (2005): Structures of virgin and managed beech forests in Uholka (Ukraine) and Sihlwald (Switzerland): A comparative study. Forest Snow and Landscape Research, 79: 45–56. Cressie N.A.C. (1993): Statistics for Spatial Data. New York,
John Wiley & Sons, Inc.: 900.
Delfan Abazari B., Sagheb-Talebi K., Namiranian M. (2004): Development stages and dynamic of undisturbed Oriental beech (Fagus orientalis Lipsky) stands in Kelardasht region (Iran). Iranian Journal of Forest and Poplar Research, 12: 307–326. (in Persian)
Dimov L.D., Chambers J.L., Lockhart B.R. (2005): Spatial continuity of tree attributes in bottomland hardwood forests in the southeastern United States. Forest Science, 51: 532–540.
Emborg J., Christensen M., Heilmann-Clausen J. (2000): The structural dynamics of Suserup Skov, a near-natural temperate deciduous forest in Denmark. Forest Ecology and Management, 126: 173–189.
Eslami A.R., Sagheb-Talebi K. (2007): Investigation on the structure of pure and mixed beech forests in north of Iran. Pajouhesh & Sazandegi Natural Resource, 77: 39–46. (in Persian)
Habashi H., Hosseini S.M., Mohammadi J., Rahmani R. (2007): Stand structure and spatial pattern of trees in mixed Hyrcanian beech forests of Iran. Iranian Journal of Forest and Poplar Research, 15: 55–64. (in Persian)
Hao Z., Zhang J., Song B., Ye J., Li B. (2007): Vertical structure and spatial associations of dominant tree species in an old-growth temperate forest. Forest Ecology and Manage-ment, 252: 1–11.
Hassani M., Amani M. (2010): Investigation on structure of Oriental beech (Fagus orientalis Lipsky) stand at optimal stage in Sangdeh forest. Iranian Journal of Forest and Poplar Research, 18: 163–176. (in Persian)
He F., Legendre P., LaFrankie J.V. (1997): Distribution patterns of tree species in a Malaysian tropical rain forest. Journal of Vegetation Science, 8: 105–114.
Hegazy A.K., Kabiel H.F. (2007): Significance of microhabitat heterogeneity in the spatial pattern and size-class struc-ture of Anastatica hierochuntica L. Acta Oecologica, 31: 332–342.
Hou J.H., Mi X.C., Liu C.R., Ma K.P. (2004): Spatial patterns and associations in a Quercus-Betula forest in northern China. Journal of Vegetation Science, 15: 407–414. Karami A., Feghhi J., Marvie Mohajer M.R., Namiranian M.
(2012): Investigation on the spatial pattern of regeneration patches in natural beech (Fagus orientalis Lipsky) forests (case study: Gorazbon district, Kheyrud forest). Iranian Journal of Forest, 4: 77–87. (in Persian)
Kiani B., Tabari M., Fallah A., Hosseini S.M., Iran-Nejad Parizi M.H. (2011): The use of nearest neighbor, mean square and Ripley’s K-function methods to determine spa-tial pattern of saxaul (Haloxylon ammodenderon C.A.Mey) in Siahkooh protected area, Yazd province. Iranian Journal of Forest and Poplar Research, 19: 356–369. (in Persian) Korpel S. (1995): Die Urwälder der Westkarpaten. Stuttgart,
Gustav Fischer Verlag: 310.
Lan G., Getzin S., Wiegand T., Hu Y., Xie G., Zhu H., Cao M. (2012): Spatial distribution and interspecific associations of tree species in a tropical seasonal rain forest of China. PLoS ONE, 7: e46074.
Lee K., Kim Y., Choung Y. (2012): Spatial pattern and as-sociation of tree species in a mixed Abies holophylla -broadleaved deciduous forest in Odaesan National Park. Journal of Plant Biology, 55: 242–250.
Leibundgut H. (1993): Europäische Urwälder. Bern, Stuttgart, Verlag Paul Haupt: 260.
Marvie Mohadjer M.R. (2011): Silviculture. 3rd Ed. Tehran,
University of Tehran Press: 418.
Mataji A., Sagheb-Talebi K. (2007): Development stages and dynamic of two Oriental beech (Fagus orientalis L.) com-munities at natural forests of Kheiroudkenar-Noshahr. Iranian Journal of Forest and Poplar Research, 15: 398–416. (in Persian)
Maltez-Mouro S., García L.V., Marañón T., Freitas H. (2007): Recruitment patterns in a Mediterranean oak forest: A case study showing the importance of the spatial component. Forest Science, 53: 645–652.
Omidvar Hosseini F., Akhavan R., Kia-Daliri H., Mataji A. (2015): Spatial patterns and intra-specific competition of chestnut-leaved oak (Quercus castaneifolia) using Ripley’s K-function (case study: Neka-Zalemrood forest – Sari). Ira-nian Journal of Natural Resources, 68: 107–120. (in Persian) Parhizkar P., Sagheb-Talebi K., Mattaji A., Namiranian M.,
Pourbabaei H., Ahani H., Bonyad A.M. (2004): Study on spa-tial pattern of Acer platanoides L. in Shafarud forests, Rez-vanshahr, Guilan. Environment Science Journal, 1: 24–30. Poznanovic S.K., Poznanovic A.K., Webster C.R., Bump J.K.
(2014): Spatial patterning of underrepresented tree species in canopy gaps 9 years after group selection cutting. Forest Ecology and Management, 331: 1–11.
Reyburn A.P. (2011): Causes and consequences of plant spatial patterns in natural and experimental Great Basin (USA) plant communities. [Ph.D. Thesis.] Logan, Utah State University: 162.
Ripley B.D. (1988): Statistical Inference for Spatial Processes. Cambridge, Cambridge University Press: 148.
Rozas V., Zas R., Solla A. (2009): Spatial structure of de-ciduous forest stands with contrasting human influence in northwest Spain. European Journal of Forest Research, 128: 273–285.
Sagheb-Talebi K. (2014): Appropriate Characteristics of Beech Stands for Application of Close to Nature Silvi-culture (Selection System) of Hyrcanian Region (Guilan, Mazandaran and Golestan Provinces). Final Report of the National Project No. 04–09-09-87033. Tehran, Research Institute of Forests and Rangelands: 116.
Sagheb-Talebi K., Schütz J.P. (2002): The structure of natural oriental beech (Fagus orientalis) forests in the Caspian re-gion of Iran and potential for the application of the group selection system. Forestry, 75: 465–472.
Sagheb-Talebi K., Delfan Abazari B., Namiranian M. (2003): Description of decay stage in a natural Oriental beech (Fagus orientalis Lipsky) forest in Iran, preliminary results. In: Commarmot B., Hamor F.D. (eds): Natural Forests in the Temperate Zone of Europe – Values and Utilization, Mukachevo, Oct 13–17, 2003: 130–134.
Sagheb-Talebi K., Delfan Abazari B., Namiranian M. (2005): Regeneration process in natural uneven-aged Caspian beech forests of Iran. Swiss Forestry Journal, 156: 477–480.
Salas C., LeMay V., Núñez P., Pacheco P., Espinosa A. (2006): Spatial patterns in an old-growth Nothofagus oblique forest in southcentral Chile. Forest Ecology and Management, 231: 38–46.
Wang Z.F., Peng S.L., Liu S.Z., Li Z. (2003): Spatial pattern of Cryptocarya chinensis life stages in lower subtropical forest, China. Botanical Bulletin of Academia Sinica, 44: 159–166.
Wiegand T. (2006): Extending Point Pattern Analysis for Objects of Finite Size and Irregular Shape Using the Pro-gramita software. Leipzig, UFZ – Centre for Environmental Research, Department of Ecological Modelling: 61. Wiegand T., Moloney K.A. (2004): Rings, circles, and
null-models for point pattern analysis in ecology. Oikos, 104: 209–229.
Wiegand T., Gunatilleke S., Gunatilleke N., Okuda T. (2007): Analyzing the spatial structure of a Sri Lankan tree species with multiple scales of clustering. Ecology, 88: 3088–3102. Wong D.W.S., Lee J. (2005): Statistical Analysis of Geographic Information with ArcView GIS and ArcGIS. New York, John Wiley & Sons, Inc.: 464.
Zenner E.K., Peck J.E. (2009): Characterizing structural con-ditions in mature managed red pine: Spatial dependency of metrics and adequacy of plot size. Forest Ecology and Management, 257: 311–320.
Zenner E.K., Sagheb-Talebi K., Akhavan R., Peck J.L.E. (2015): Integration of small-scale canopy dynamics smoothes live-tree structural complexity across development stages in old-growth Oriental beech (Fagus orientalis Lipsky) forests at the multi-gap scale. Forest Ecology and Management, 335: 26–36.
Zhang Q., Zhang Y., Peng S., Yirdaw E., Wu N. (2009): Spatial structure of alpine trees in Mountain Baima Xueshan on the southeast Tibetan Plateau. Silva Fennica, 43: 197–208.