RESEARCH ARTICLE
Diet-induced phenotypic plasticity in European eel
(
Anguilla anguilla
)
Jens De Meyer*, Joachim Christiaens and Dominique Adriaens
ABSTRACT
Two phenotypes are present within the European eel population: broad-heads and narrow-heads. The expression of these phenotypes has been linked to several factors, such as diet and differential growth. The exact factors causing this dimorphism, however, are still unknown. In this study, we performed a feeding experiment on glass eels from the moment they start to feed. Eels were either fed a hard diet, which required biting and spinning behavior, or a soft diet, which required suction feeding. We found that the hard feeders develop a broader head and a larger adductor mandibulae region than eels that were fed a soft diet, implying that the hard feeders are capable of larger bite forces. Next to this, soft feeders develop a sharper and narrower head, which could reduce hydrodynamic drag, allowing more rapid strikes towards their prey. Both phenotypes were found in a control group, which were given a combination of both diets. These phenotypes were, however, not as extreme as the hard or the soft feeding group, indicating that some specimens are more likely to consume hard prey and others soft prey, but that they do not selectively eat one of both diets. In conclusion, we found that diet is a major factor influencing head shape in European eel and this ability to specialize in feeding on hard or soft prey could decrease intra-specific competition in European eel populations.
KEY WORDS: Dimorphism, Trophic plasticity, Elver eel stage, Feeding
INTRODUCTION
By bone remodeling and changing muscle volume, fish can adapt to changes in mechanical loads they are confronted with, including changes in diet properties such as prey hardness (Greenwood, 1965; Goldspink and Howells, 1974). This capability of a genotype to develop different phenotypes in response to varying environment is known as phenotypic plasticity (Stearns, 1989; Scheiner, 1993). Several studies have shown that differences in prey type trigger such a phenotypic plasticity in fish. The Neotropical cichlidsGeophagus brasiliensisandG. steindachnerideveloped longer and shallower heads when consuming brine shrimp nauplii in comparison with fish feeding on chironomid larvae (Wimberger, 1992). Florida largemouth bass, Micropterus salmoides floridanus, raised in a hatchery had a deeper, shorter head with shorter jaw bones to feed on hard pellets, whereas wild largemouth bass, feeding on evasive fish, developed a long, fusiform head with elongated jaw bones (Wintzer and Motta, 2005). Studies on three-spined sticklebacks (Gasterosteussp.) have shown that limnetic ecotypes that primarily feed on zooplankton have longer and slender heads (Walker, 1997),
whereas benthic ecotypes had a deep head and a wide mouth, favorable for feeding on larger aquatic vertebrates (Wootton, 1994). Such trophic polymorphism has also been found in other species, such as the arctic charrSalvenlinus alpinus(Malmquist, 1992), the pygmy whitefish Prosopium coulteri (McCart, 1970) and the rainbow smeltOsmerus mordax(Taylor and Bentzen, 1993).
Also in the yellow eel stage of the European eel (Anguilla anguilla
Linnaeus 1758) and Japanese eel (Anguilla japonica), two morphotypes exist: broad- and narrow-heads (Törlitz, 1922; Thurow, 1958; Lammens and Visser, 1989; Proman and Reynolds, 2000; Kaifu et al., 2013a). This dimorphism has been validated by Ide et al. (2011) based on biometric data and is hypothesized to be the result of dietary differences. Narrow-heads feed predominantly on small, soft prey such as chironomids and amphipods, close to the river bank, whereas broad-heads feed on big, hard prey such as fish and molluscs in more open water (Thurow, 1958; Proman and Reynolds, 2000). These observations were confirmed by Cucherousset et al. (2011) based on stable isotope data. They showed that the dimorphism is the result of disruptive selection, with intermediate morphologies having a lower body condition than the extreme morphologies. Kaifu et al. (2013a) found, however, that differential somatic growth also plays a role in the development of head shape dimorphism in Japanese eel. Fast-growing eels in brackish water became narrow-headed, whereas slow-growing eels living in freshwater developed broad heads. What the exact factors influencing this dimorphism are, however, is still unclear. Also the onset at which the head dimorphism becomes expressed is still unknown. A recent study by De Meyer et al. (2015) found that European glass eels, which are considered to be non-feeding, already showed variation in both head width and snout bluntness. However, this variation in head shape did not show a clear bimodal distribution. They then hypothesized that the glass eels might be transitioning from a unimodal to a bimodal distribution, with a potential role of different genetic determination between the two morphs. The bimodality would then become apparent once the glass eels started feeding as elver eels.
In order to test whether the epigenetic effect of different feeding mechanisms onto the genotype results in a phenotypic response of the head, eventually leading to head shape dimorphism, we studied its development from the moment glass eels start to feed. At this moment, pigmentation starts and glass eels turn into elvers (Tesch, 2003). These young individuals are more prevalent to morphological changes than the more developed yellow eels, as the glass eels are still not fully osteologically and myologically developed (Hinton and McNamara, 1984; Wund et al., 2008). It can thus be expected that phenotypic plasticity in this stage is higher, allowing development of a feeding apparatus that is better suited for feeding on the prey type they capture (Wainwright, 1999). Elvers were, therefore, given either a soft or a hard diet for which different mechanical demands are required to handle the prey. We hypothesize that these different demands will induce a phenotypic Received 21 September 2015; Accepted 12 November 2015
Evolutionary Morphology of Vertebrates, Ghent University–UGent, K.L. Ledeganckstraat 35, Ghent B-9000, Belgium.
*Author for correspondence ( jendmeye.demeyer@ugent.be)
Journal
of
Experimental
response, reflecting a mechanical regime associated with food intake. We then expect that this phenotypic response may lead to the development of a broad-headed morphology in eels experiencing higher mechanical loads, while eels experiencing low loads develop a narrower head. Also, a control group was present feeding on a mixture of both diets, which allowed us to study the feeding preferences of the European eel. Expression of bimodality, and thus the development of both extreme broad-heads and extreme narrow-heads, in the control group would imply that some eels selectively feed on hard prey, whereas others selectively feed on soft prey. It is also possible that the control group specimens develop intermediate head shapes, indicating that all control eels feed on both prey types alike and therefore do not develop a morphology optimally adapted for feeding on either hard or soft prey. This study thus increases our insights into how head shape bimodality becomes expressed in European eel and the role of diet in this process.
MATERIALS AND METHODS
European glass eel samples (Anguilla anguillaLinnaeus 1758) were taken at the Leopold Canal in Zeebrugge (Belgium) in April 2014, using fyke nets (N=54). These glass eels were randomly distributed in three groups (N=18) and each group was placed in a separate 120-liter tank during a 5-month experiment. Age and sex of the eels could not be determined at this stage. Several stones were placed in the tanks for the eels to hide under. The tanks were cleaned twice a week, after which water quality and temperature were measured (Table S1).
For this study, feed was commercially obtained from Aquadip (Oss, The Netherlands). To allow acclimatization of the elvers, all groups were initially fed on softGlycerasp. during the first 2 weeks of the experiment, after which diets changed per group. The diets are chosen to match the different feeding behavior of broad- and narrow-headed yellow eels, with narrow-heads feeding on small and soft prey, and broad-heads feeding on larger and harder prey. The latter requires higher bite force and a different regime of mechanical loading. One group of elver eels got a‘hard diet’(the specimens of this group are further called ‘hard feeders’). A second group of specimens was provided with a‘soft diet’(‘soft feeders’group). A control group got a mixed diet, consisting of half of the portion that was given to both soft and hard feeders (Table S2). The ‘soft diet’ consisted mainly of
Glycera sp. and to a smaller extent, Cyclops sp. Glycera is a polychaete with a very thin cuticle, whilstCyclopssp. is very small. Because of these characteristics, prey could simply be sucked in by the eels (no further manipulation with the oral jaws was required). The
‘hard diet’consisted ofMysissp. InMysis, and crustaceans in general, the cuticular regions are calcified due to the addition of a high amount of calcium carbonate, causing great mechanical strength (Moret and Moreau, 2012; Nagasawa, 2012). Because of this, the hard feeders not only required some suction behavior, but also used shaking/biting and spinning behavior to cope with their prey.Mysissp. was chosen at the start of the experiment as a suitable hard prey because of its smaller size, whilst still large and hard enough to invoke biting behavior (Table S2). We observed that 2 months after the start of the experiment, the hard feeders no longer required extensive biting/ shaking behavior to consumeMysissp. Because of this and to provide enough nutrients to all groups, we made the diets more variable. We added larger and thicker crustaceans, Euphasia pacifica and
Gammarussp., to the hard feeders’diet for which extensive biting/ shaking or spinning behavior was necessary to tear off small pieces. We also providedTenebrio molitorlarvae with the exoskeleton still being attached, stimulating biting/shaking behavior and cockle meat (Cardiidae), which required spinning behavior because of its larger
size. To compensate for the more diverse diet for hard feeders, the diet of the soft feeders was also made more variable. Soft feeders now also received chironomid larvae andTubifexsp. Both of these prey types exhibit a thin cuticle, the first being insect larvae (D’Amico et al., 2001) and the latter being oligochaetes (Fischer and Horváth, 1977).
Tenebrio molitorlarvae without exoskeleton were also given to the soft feeders. For the consumption of all these prey types, only suction feeding was required, as observations confirmed. By making the diets more variable, we ensured that all groups were given a balanced diet. At the end of the experiment, the specimens were anesthetized with MS222 and killed using an MS222 overdose, conforming with Belgian legislation for animal welfare. The dead specimens were then fixed in 4% formaldehyde.
To study head shape bimodality, pictures of the head of all eels were taken monthly, yielding five ontogenetic data points per specimen (N=54, 49, 49, 44 and 40 from sample 1 to sample 5, respectively). For this, the eels had to be anesthetized with benzocaine (100 mg l−1). Total length of each specimen was
measured to the nearest 0.1 mm using a Mauser digital caliper from the second sample onwards, allowing the estimation of the mean growth rate per group. Growth rate was estimated as the difference in length of the specimens between two subsequent samples. Next, pictures of the head of each specimen were taken in dorsal view using an Olympus SZX9 stereomicroscope, equipped with a Colorview 8 digital camera. The specimens were then placed in a separate aquarium until recovered from anesthesia, and then transferred to 120-liter tanks.
Outlines of the heads were drawn on each picture using CorelDraw 12, with the base of the pectoral fins being used as the posterior end of the head. Subsequently, these outlines were analyzed with SHAPE (Iwata and Ukai, 2002). The contours were recorded as chaincodes, which describe the outline as a series of numbers between zero and seven (Kuhl and Giardina, 1982). The normalized elliptic Fourier descriptors (EFD) were calculated based on this chain code (normalization to be invariant of size, rotation and starting point; Kuhl and Giardina, 1982). Subsequently, both size and orientation of the contours were standardized in accordance with the size and alignment of the major axis of the first harmonic ellipse. Because of the very large number of coefficients, as well as the fact that individual coefficients do not allow any biologically relevant interpretation of shape variation, the normalized coefficients of the EFDs cannot be used directly as shape characteristics. Therefore, a principal component analysis (PCA) is used, which also generates principal component (PC) contours that allow an effective summarizing of shape variation contained in the coefficients (Rohlf and Archie, 1984). We performed PCAs on the coefficients of normalized EFDs of different datasets. First, a separate PCA was performed for each sample, to find out in what way head shape variation changed during the experiment and to determine when head shapes start to diverge between treatments. Secondly, we performed a separate PCA on the different diet groups (all samples per diet pooled), to focus on qualitative differences in head shape development between the different treatments. Only the effective components according to SHAPE, which are also associated with relevant shape variation, were maintained in the analysis. Shape variation explained by each of the effective PCs [PCs of which the proportion of variation explained is larger than 1/ (number of analyzed coefficients)] was visualized by generating Principal Component Contours using the PrincComp module of the SHAPE package. For each sample taken, a MANOVA was performed on all the effective PCs combined to find significant shape differences between the different diets. If the conditions for a
Journal
of
Experimental
MANOVA were not met, a non-parametric MANOVA was performed. Subsequently, we used ANOVA on separate PCs which were related to important shape changes (PC1, 2 and 3; see Results). This allowed the identification of specific PCs that differed significantly between the diets.
Previous research has shown that head width increases when eels become larger (Cucherousset et al., 2011) and in our study, we also observed a potential effect of size. Therefore, an additional PCA was performed on a pooled dataset of samples 3 to 5 of all diets, as from the third sample onwards, head shape started to diverge between treatments (see Results). We then performed a linear regression on scores of PC1 to PC3 and the log-scaled total body length of each diet separately to find out whether shape changes between diets differ during growth. To confirm this, at-test was performed, which allowed us to find out whether the slopes of these regressions
differed significantly between diets. However, as linear regressions with a low fit also have a low chance of detecting significant differences, we additionally performed a linear regression on the scores of PC1 to PC3 and the log-scaled total body length of the complete dataset and determined the residual values. These residuals are free of size-effects and are subsequently used for an ANOVA. Next, we also standardized the scores of PC1 to PC3 for total length and then performed an ANOVA on these length-corrected PC scores. These analyses allow us to find out whether head shapes differ significantly between diets, without influence of size. Finally, we also tested if growth rate differed significantly between the groups with a non-parametric Monte Carlo analysis (as the conditions for an ANOVA ort-test were not met), which relies on a randomized permutation procedure (10,000 replicates), using Poptools 3.2 (Greg Hood, Australia; http://www.poptools.org) in
Changes from shape at low PC scores to shape at high PC scores
Changes from shape at high PC scores to shape at low PC scores
Month 1 Month 2 Month 3 Month 4 Month 5
PC3 8.3% PC3 4.9% PC3 6.3% PC3 5.7% PC3 9.2% PC2 9.9 % PC2 7.5% PC2 8.8% PC2 6.5% PC2 12.3%
PC1 56.6% PC1 68.2% PC1 66.3% PC1 70.9% PC1 60%
H S C H S C H S C H S C H S C
H S C H S C H S C H S C H S C
H S C H S C H S C H S C H S C
A
B
C
D
E
F
G
H
I
J
K
L
M
N
O
–20,000 60,000
–20,000
80,000 80,000
–20,000
–40,000 80,000
–10,000 70,000
0
35 000 30,000
0 0
40,000 35,000
5000 5000
40,000
40,000
0
30,000
0
25,000
0
0 30,000
–20,000 20,000
*
*
[image:3.612.77.527.240.688.2]*
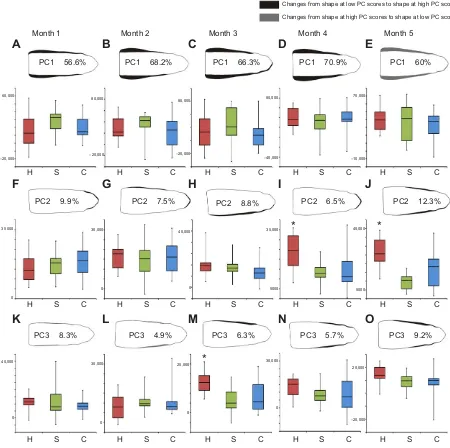
Fig. 1. Boxplots of the PC scores and principal component contours at negative and positive PC scores for the most important PCs at each sample separately in European eels.The figures indicate that at each sample (month 1–5), variation in mean width along the entire head length is the most important (PC1), followed by variation in snout bluntness (PC2) and variation in the width of the post-orbital region (PC3). The boxes represent the interquartile range, with the central point being the median PC score and the whiskers representing the minimum and maximum values. Sample sizes can be found in Table 1. H, hard diet; S, soft diet; C, control diet. Asterisks indicate significant differences.
Journal
of
Experimental
Excel 2010 (Microsoft). The null hypothesis of this analysis states that the difference between the means of two groups of variables does not differ from the difference between any pair of groups with random resampling of the variables. The P-value can then be calculated from the result as the relative number of times the difference of the replicates is in the upper 0.975 percentile (Collyer et al., 2007).
RESULTS
Size, growth rate and mortality
The Monte Carlo analysis showed that the growth rate of the hard feeders was significantly lower (mean±s.d.: 0.5±0.3 cm month−1)
than that of both the soft feeders (0.8±0.5) and the control group (0.8±0.6). Hard feeders were therefore smaller than the soft feeders and the control group at each sample from the second sample onwards (Table 1). A maximum of three specimens died in each group between each sample. The highest mortality at the end of the experiment was found in the hard feeders (39%), followed by the control group (22%) and the soft feeders (17%).
Analysis of each sample separately
The MANOVA on the PC scores of the significant PCs at the first sample indicated that no significant shape differences were present between the different groups (Phard-control=0.56, Phard-soft=0.34, Pcontrol-soft=0.71). This guarantees that the specimens are randomly
distributed over the different diets. PC1 (56.6% of the variation) is associated with variation in head broadness, whereas PC2 (9.9%)
reflects variation in snout bluntness (Fig. 1). Similar results are found after the 2 month sampling with PC1 (68.2%) being related to head broadness and PC2 to snout bluntness and slight variation in head width (7.5%). PC3 (4.9%) is related to variation in broadness of the region just posterior to the eye (Fig. 1). The MANOVA indicates that head shape is still the same among all diets, indicating that there is no effect of diet at this stage (Phard-control=0.87, Phard-soft=0.67,Pcontrol-soft=0.88).
After 3 months, differences in head shape between diets become apparent. The MANOVA analysis shows that hard feeders differ significantly from the soft feeders and the control group (Phard-control=0.02, Phard-soft=0.003,Pcontrol-soft=0.58). The
[image:4.612.48.298.80.184.2]PCA on the normalized EFDs shows that PC1 (66.3%) is again associated with mean width along the entire head length, whereas PC2 (8.8%) is mostly related to snout bluntness and partially to head width. PC3 (6.3%) keeps reflecting variation in broadness of the region just posterior to the eye, where the adductor mandibulae can be found (Fig. 1). The ANOVA on the PC3 scores shows that this region is significantly broader in the hard feeders than in the other groups (Fig. 1M). No significant differences were found between the groups for the other PCs (Table 2). Specimens of the control group are distributed across the morphospace occupied by both soft and hard feeders in sample 3. This observed trend continues in the subsequent sample. PC1 (70.9%) remains associated with mean width along the entire head length, whereas PC2 (6.5%) reflects variation in snout bluntness and to a lesser extent, also mean head width. PC3 (5.7%) continues to be related to variation in the width of the region just posterior to the eye (Fig. 1). At the final sample, the same type of head shape variation is found for PC1 (60%) and PC3 (9.2%), as at the previous samples. However, PC2 (12.3%) is now not only
Table 1. Minimum and maximum length (range) and mean length at each sample for the different diets
S2 S3 S4 S5
Hard
Range 6.4–9.2 (15) 6.8–9.8 (15) 7.0–10.2 (13) 7.6–11.6 (11) Mean±s.d. 7.8±0.9 8.1±0.9 8.6±0.9 9.5±1.1 Soft
Range 7.7–10.5 (17) 8.2–11.9 (17) 8.7–13.9 (16) 10.0–15.6 (15) Mean±s.d. 8.7±1.0 9.2±1.1 9.9±1.6 11.2±2.0 Control
Range 7.1–10.2 (17) 7.6–11.3 (17) 7.7–13.3 (15) 9.6–16.1 (14) Mean±s.d. 8.2±0.9 8.68±1.0 9.3±1.5 11.3±1.7
[image:4.612.298.565.444.720.2]Values are given in cm; S, sample number; number of individuals is shown in parentheses.
Table 2. Results from the ANOVA on the PC scores of the shape analysis at each separate sample
H–S H–C S–C
Sample 1 PC1 0.06 0.52 0.09
PC2 0.39 0.16 0.46
PC3 0.89 0.29 0.47
Sample 2 PC1 0.23 0.85 0.08
PC2 0.50 0.77 0.90
PC3 0.30 0.41 0.95
Sample 3 PC1 0.95 0.5 0.33
PC2 0.45 0.12 0.26
PC3 <0.001* <0.001* 0.58 Sample 4 PC1 0.50 0.98 0.56 PC2 0.02* 0.04* 0.93
PC3 0.18 0.33 0.92
Sample 5 PC1 0.97 0.96 0.88 PC2 <0.001* 0.01* 0.12
PC3 0.30 0.23 0.98
H, hard diet; S, soft diet; C, control diet. *Significant difference.
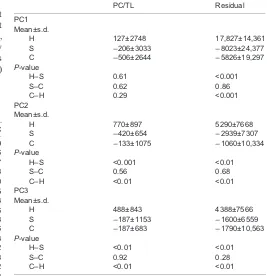
Table 3. Results from the ANOVA on the length-corrected PC scores and the residual values of the hard, soft and control diets
PC/TL Residual
PC1 Mean±s.d.
H 127±2748 17,827±14,361
S −206±3033 −8023±24,377 C −506±2644 −5826±19,297
P-value
H–S 0.61 <0.001
S–C 0.62 0.86
C–H 0.29 <0.001
PC2 Mean±s.d.
H 770±897 5290±7668
S −420±654 −2939±7307 C −133±1075 −1060±10,334
P-value
H–S <0.001 <0.01
S–C 0.56 0.68
C–H <0.01 <0.01 PC3
Mean±s.d.
H 488±843 4388±7566
S −187±1153 −1600±6559 C −187±683 −1790±10,563
P-value
H–S <0.01 <0.01
S–C 0.92 0.28
C–H <0.01 <0.01
PC/TL, length-corrected PC scores. H, hard diet (N=38); S, soft diet (N=46); C, control diet (N=46).
Journal
of
Experimental
[image:4.612.49.304.567.727.2]associated with variation in snout bluntness, but also to variation in the width of the region posterior of the eye (Fig. 1). At samples 4 and 5, a significant difference is found for the PC2 scores (and thus snout bluntness and width of the region posterior to the eye, respectively) between the hard feeders and both soft feeders and the control group (Table 2). Hard feeders thus have a blunter snout and a broader post-orbital region. No significant differences are found in mean width along the entire head length (PC1) and in width of the post-orbital region (PC3) during the final two samples (Table 2). The latter region is, however, still broader in hard feeders than in soft feeders, while mean width along the entire head length remains similar across the diets during the experiment (Fig. 1). The control group remains distributed across the shapes of both soft and hard feeders, with high variation in the PC2 and PC3 scores. Variation in PC1 scores is also high in sample 4, whereas it is much lower in the final sample.
Effects relative to total body length
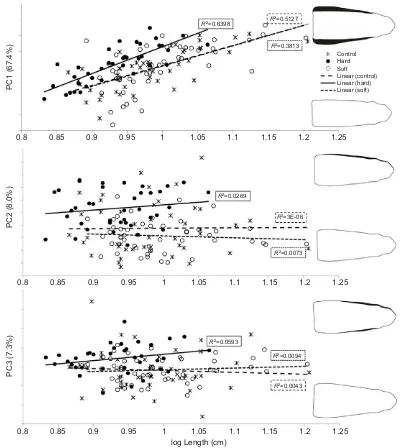
A positive relation was found between length and the PC1 scores of the pooled dataset, reflecting head width, with the strongest increase in head width observed in hard feeders, while the increase is lower and highly comparable in the control group and the soft feeders (Fig. 2). However, none of the slopes differed significantly from each other (Phard-control=0.15,Phard-soft=0.22,Pcontrol-soft=0.96). The
ANOVA on the residuals obtained from the linear regression on the PC1 scores and the log-scaled total body length of the complete dataset, however, indicated that hard feeders had significantly higher values than soft feeders and the control group (Table 3). Also the length-corrected PC scores were higher in hard feeders compared with the other diets, although the differences were non-significant according to the ANOVA (Table 3). However, as higher values in both cases are related to broader heads, we can conclude that hard feeders have broader heads than soft feeders and
0.8 0.85 0.9 0.95 1 1.05 1.1 1.15 1.2 1.25
0.8 0.85 0.9 0.95 1 1.05 1.1 1.15 1.2 1.25
0.8 0.85 0.9 0.95 1 1.05 1.1 1.15 1.2 1.25
log Length (cm)
PC3 (7.3%)
PC1 (67.4%)
PC2 (8.0%)
Control Hard Soft Linear (control) Linear (hard) Linear (soft)
R2=0.6398 R
2=0.5127
R2=0.3813
R2=0.0269
R2=3E-06
R2=0.0073
R2=0.0593
R2=0.0094
[image:5.612.104.504.60.508.2]R2=0.0043
Fig. 2. Relationship between the most important PC scores and the log(length) (expressed in centimeters) of the pooled dataset, containing samples 3–5.The figure confirms that hard feeders have broader heads and a broader adductor mandibulae region compared with soft feeders of similar length (Nhard: 38;Nsoft: 46;Ncontrol: 46). Variation explained by each PC in parentheses.
Journal
of
Experimental
specimens of the control group when corrected for body size. This size-dependent effect on head width can also explain why no significant differences could be found for the PC1 scores at each sample separately (Table 2).
Similar results are found for PC2 (snout bluntness and general head width). No significant difference is found between the slopes of the different diets according to the t-test (Phard-control=0.54, Phard-soft=0.28,Pcontrol-soft=0.72). Although the slopes do not differ
significantly, a more pronounced positive relationship is present between the PC2 scores and length of the hard feeders compared with soft feeders. In the control group, a negative relationship can be observed. None of these slopes, however, differed significantly from zero (Phard=0.81,Psoft=0.28,Pcontrol=0.53). The ANOVA on
the residuals from the linear regression on the PC2 scores again showed that hard feeders had significantly higher values, and thus more blunt snouts and broader heads, than soft feeders and specimens of the control group. These observations are confirmed
by the ANOVA on the size-corrected PC scores (Table 3). The seemingly size-independent shape variation in the control group is caused by the high variation in head shape (ranges from broad- to narrow-heads). The presence of such a variety in head shapes can explain the low fit of the slope (Fig. 2).
Finally, the slope of the PC3 scores from the hard feeders is higher than that of the soft feeders and the control group, although not significant (Phard-control=0.17,Phard-soft=0.35,P
control-soft=0.48). Fig. 2, nevertheless, indicates that, when comparing
specimens of the same length, hard feeders in general have a broader post-orbital region. This is supported by the ANOVA on the residual values and the length-corrected PC scores. Both analyses showed that hard feeders had significantly higher values, indicating that they indeed exhibit a broader post-orbital region than soft feeders and specimens of the control group (Table 3). The specimens of the control group again show a wide range of head shapes, but more narrow-heads and specimens
PC3 (4.58%)
PC1 Hard Soft Control
PC3 (5.91%)
PC1 (69.61%)
PC3 PC2
PC2 (6.05%)
[image:6.612.83.529.53.478.2]PC1 (76.19%) PC1 (73.70%)
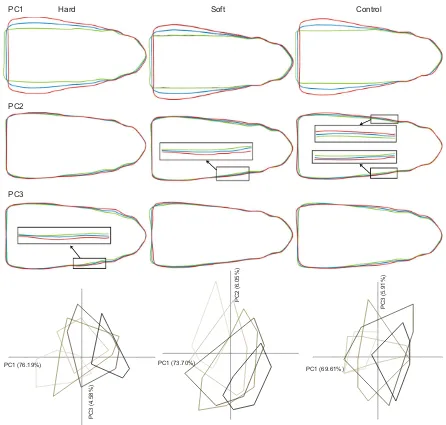
Fig. 3. Ontogenetic shift in head shape within each diet group.Red line: head shape for a PC score of mean+2s.d. Blue line: head shape for the mean PC score. Green line: head shape for a PC score of mean−2s.d. The PCAs represent axes that are associated with the most variation in mean head width and width of the post-orbital region. The outlines of the shape variation at each sample are drawn in different colors from light to dark, with the lightest being the first sample taking and the darkest the final sample. The analysis shows that mean head width increases during the experiment, independent of diet. The adductor mandibulae region, however, increases in hard feeders, whereas it decreases in soft feeders. The control group shows both patterns. Sample sizes of each diet at each sample are given in Table 1.
Journal
of
Experimental
with an intermediate head shape are present than broad-heads (Fig. 2).
Analysis of each diet separately
Finally, a PCA was performed on all samples combined for each diet separately. PC1 was associated with variation in head width for all diets (Fig. 3). Most of this variation in broadness is located at the height of the operculum in the control and the soft feeding group. In both these groups, there is only little variation in broadness of the post-orbital region, indicating that this region did not change substantially during the experiment. This was not the case for hard feeders, for which a strong increase of the post-orbital region is observed during the experiment (Fig. 3). Also, PC3 (4.6%) of the hard feeders, PC2 (6.1%) of the soft feeders and both PC2 (9.1%) and PC3 (5.9%) of the control group are related to variation in the post-orbital region. In the soft feeding group, a general trend towards a narrower head can be observed during the experiment, whereas the head shape differentiates towards a broad, narrow or intermediate in the control group (Fig. 3).
DISCUSSION
This is the first study that investigated diet-induced morphological plasticity of the head in European eel. Previous studies investigating the effect of diet on head shape dimorphism were based on either stomach content (Törlitz, 1922; de Nie, 1987; Lammens and Visser, 1989; Proman and Reynolds, 2000) or on stable isotope analysis (Cucherousset et al., 2011) in yellow eels. They found that broad-headed eels tend to feed more on hard and large prey, such as fish and mollusks, whereas narrow-headed eels consume smaller and more soft-bodied prey, especially chironomids. The specimens of these studies were all larger than 30 cm, due to which earlier potential influences of feeding were not taken into consideration. Our study shows that diet can already affect head shape early after the glass eels start to feed. We found no significant difference in head shape between the different diets in the first two samples. The diet of hard feeders only consisted of Mysissp., which in those stages required biting behavior. It is possible that the use of this behavior does not result in an immediate phenotypic response and that a certain period is required before phenotypic differences become apparent. However, withMysissp. being small, it is equally likely that hard feeders did not yet need to generate high bite forces to fragment this prey, explaining that no differences in head shape could be observed between hard and soft feeders. To solve this possible issue, we added new prey types that were larger and broader than Mysis sp. and required more extensive biting and spinning behavior. To consume these new prey types, hard feeders thus needed to generate higher bite forces. This was not the case for soft feeders, who could easily consume their prey just by suction feeding. From the third sample onwards, significant differences were found between the head shapes of soft and hard feeders, with the hard feeders developing a broader head. These observations thus support our hypothesis that the different demands of each diet lead to a phenotypic response in head width, which can be linked to the head shape dimorphism observed in the wild. However, part of the variation in head width might be caused by the use of anesthetized, but still respiring, eels. Therefore, the opercula could be expanded during picture taking, introducing random variation in the mean width along the entire head length captured in the first PC of the used analyses. However, because of its random nature, this variation most likely does not influence the different presented analyses. Indeed, mean head width of all specimens does increase with body length during the experiment, independent of diet, strongly suggesting that
opercular expansion is not the only factor influencing the width along the entire head length. This is also supported by the results of the PCA on the pooled data set, as head width increases faster with length in hard feeders than in the other groups. Consequently, hard feeders will have broader heads than soft feeders or control group specimens of similar length. It can thus be concluded that opercular expansion can introduce random variation in head shape, but does not influence the results of the PCAs.
Interestingly, hard feeders specifically develop a broader post-orbital region than soft feeders. This region broadens and bulges when the hard feeders grew larger, whereas no such bulging is observed in the soft feeding group. These trends could explain the eventual head shape bimodality observed in yellow eels (Ide et al., 2011) and correspond to the transitional phenotypic distribution among glass eels, as shown by De Meyer et al. (2015). The post-orbital region contains the adductor mandibulae muscles. Studies on several lacertid reptiles have shown that a larger post-orbital region allows bigger muscles to attach, increasing the bite force of broader headed specimens (Herrel et al., 1996, 1999; Gvoždík and Van Damme, 2003). A broadening of the post-orbital region in hard feeding eels therefore suggests that they develop larger muscles, allowing larger bite forces, which facilitates tearing of small pieces of the hard prey. Prey of the soft feeders was sucked in and soft feeders thus rely less on high bite forces. Therefore, our second hypothesis is also supported, with hard feeders developing broad heads, which is most probably related to larger jaw closing muscles, which can generate higher forces during contraction, and the skeleton consequently has to deal with increased loads caused by biting onto harder prey. The same observations are made for yellow eels in a study by De Schepper et al. (2007). Broad-headed yellow eels did not only exhibit larger jaw adductors enabling larger bite forces, but also had a lengthened lower jaw and maxillary and an enlarged coronoid process, increasing the surface for insertion of the adductor mandibulae muscles (Törlitz, 1922; Thurow, 1958; De Schepper et al., 2007).
In contrast to hard feeders, soft feeders develop a narrower and sharper head. Many aquatic vertebrates are known to strike towards their prey (i.e. ram), combined with a form of suction to draw the prey into the mouth (Higham et al., 2006). The sharp and narrow head of soft feeders could be advantageous for this feeding strategy. Studies on aquatic snakes showed that specimens with a narrow and sharp head strike more rapidly towards their prey because they experience less hydrodynamic drag during movement through the water (Alfaro, 2002; Hibbitts and Fitzgerald, 2005). A similar scenario is possible for the European eel, with soft feeders being able to strike more rapidly towards their prey, as their head shape decreases hydrodynamic drag. This faster strike could also be beneficial for suction. While suction feeding has not been studied in European eel, Mehta and Wainwright (2007) showed that in American eel (Anguilla rostrata) suction feeding is caused by depression of the hyoid and expansion of the oral cavity. Muller et al. (1982) stated that a fast forward translation of the head, in combination with an open mouth and closed branchiostegal and opercular valves, increases the pressure in the mouth cavity, thus lowering the energy required to expand the head for suction feeding. If soft feeders would strike more rapidly, this could also decrease the energy expenditure for head expansion compared with hard feeders (Van Wassenbergh et al., 2007). Finally, as a consequence of the strike, bow waves are produced by the movement of the head, which could alert the prey. Also in this case, a more bullet-shaped head is beneficial compared with a broad and blunt head, as it decreases the produced bow wave, diminishing the chance of alerting the prey. The broader and blunter snouts of the hard feeders would create a
Journal
of
Experimental
larger bow wave, increasing the risk to alert the prey. As hard feeders feed on larger and more evasive prey, we would therefore expect that there is also a selective pressure towards narrower heads. Head shape of the European eel might thus be a trade-off between increasing bite force and decreasing hydrodynamic drag, with some eels being more specialized in the former to deal with hard prey and others in the latter to deal with soft and small prey.
Observations in the control group support this hypothesis. Although overall head shape of the control group differed significantly with hard feeders and not with soft feeders, variability in snout bluntness and width of the post-orbital region was high (Figs 1, 3), suggesting that some specimens are more likely to feed on hard prey, whereas most prefer soft prey. Nevertheless, control feeders develop a narrower post-orbital region than hard feeders of the same length, indicating that the mean hardness of the consumed prey of control feeders was lower than that of the hard feeders, which solely got hard prey. This suggests that the diet of control feeders, even when preferring hard prey, did not solely consist of hard prey, but also of soft prey.
What could be the advantage for eel populations to develop two distinct morphologies of the head? The ability to show a potential phenotypic response to encountered prey type might lead to decreased intra-specific competition. Eels specialized in feeding on hard prey do not compete with eels feeding on soft prey and vice versa, thus decreasing competition between animals and allowing a higher density of eels to co-occur in a single habitat. Cucherousset et al. (2011) showed that eels with an intermediate head shape had a lower fitness than extreme morphologies, indicating that there is indeed a selective pressure to specialize on either soft or hard feed. Our study thus showed that differences in the consumed prey type can induce phenotypic responses in European elver eels that mimic head shape dimorphism, as observed in natural populations. Other factors can, however, also play a role. One of these factors is somatic growth, as several studies showed that differential growth can lead to the development of broad- and narrow-heads. The observations of these studies are, however, contradictory, due to which the relationship between growth and head shape is still unclear. Various studies have reported that narrow-headed eels had a slower somatic growth than broad-headed ones (Törlitz, 1922; Rahn, 1955; Tesch, 1977). Proman and Reynolds (2000) found, on the contrary, that farm-grown European eels, which grew faster than wild ones, developed narrow heads. Similar results were observed by Kaifu et al. (2013a), who studied the lengths of Japanese eels at a certain age. They showed that slow-growing Japanese eels in freshwater became broad-headed, whereas faster-growing eels in brackish water became narrow-headed. Earlier research (Kaifu et al., 2013b) had shown that eels from both the freshwater and the brackish water had similar diets, feeding both mainly on benthic crustaceans (mud shrimpUpogebia majorfor brackish water eels and crayfrishProcambarus clarkiifor freshwater specimens). They concluded that somatic growth is the most important factor in head shape differentiation, with diet differences only playing a minor role, as the exoskeleton of crayfish is harder than that of mud shrimp. Our study supports the observation that broad-heads grow slower than narrow-heads. The slower growth, however, could be caused by the different feeding modes required to handle the different prey types. In anguillids, three basic feeding modes exist (Deelder, 1970; Tesch, 1977): (1) small items can be drawn into the mouth by inertial suction; (2) larger items are grasped in the mouth, and subsequently the eels shake their head and body to tear off small pieces; and (3) rotational feeding, during which large items are taken into the mouth, followed by spinning of the eel on the long
axis to tear these large prey into smaller pieces. Helfman and Winkelman (1991) studied the net energy uptake of these different feeding types in American eels (Anguilla rostrata). Energy costs were lowest for suction feeding, and increased when shaking and rotational feeding were used. Eels using spinning also fed more slowly and ate less food. The difference in growth that we observed could thus be caused indirectly by diet differences, as hard feeders applied both shaking and spinning behavior, whereas soft feeders could suck in their prey, resulting in different net energy uptake.
Although a variety of prey types was administered in both treatments, it cannot be excluded that the different growth rates reflect differences in the quality and quantity of particular nutrients. Next to different feeding modes, which require different underlying mechanisms, diet-induced morphological plasticity could in this case be ( partially) caused by the different nutrient levels of each diet. Shape differences in the head and body have been found in Neotropical cichlids as a result of different prey items being administered (brine shrimp nauplii versus chironomid larvae) (Wimberger, 1993). In our study, we tried to minimize particular nutrient deficiencies in the treatments by using a variety of prey types that have similar protein, fat and carbohydrate levels (Table S2). We cannot, however, exclude vitamin deficiencies, causing the slower growth rate of hard feeders. However, the heads of the control group specimens show a wide range of shapes, from narrow-heads to broad-heads, while having the most variable diet and a growth rate comparable to that of soft feeders. Next to this, the observed pattern of head shape change in the elvers is consistent with the shape differences of yellow eels feeding on either soft or hard prey (Lammens and Visser, 1989; Proman and Reynolds, 2000; Cucherousset et al., 2011). It seems unlikely that nutrient deficiencies would cause a phenotypic response that is adaptive to deal with certain prey. If certain nutrients are lacking, we would expect muscles to weaken and their volumes to decrease (Tacon, 1992). However, the broader heads of eels are related to larger jaw muscles, which allows them to cope with hard prey (De Schepper, 2007), contradicting the effects of nutrient deficiencies. These observations therefore strongly suggest that the head shape differences are not caused by nutritional differences in our study. It could still be possible that growth rate, nutritional differences and diet differences are related to each other. In this case, different prey consumed by hard feeders would lead to differences in nutrient uptake, which then again would influence growth rate and eventually head shape. Future research is necessary to exclude that nutritional differences influence the head shape dimorphism in European eel.
A final factor that we cannot exclude is the influence of genetic head shape determination. Head shape differentiation can be influenced by genetic mutations and differential gene expression levels and by exposure to different environmental conditions. Aubret et al. (2004) found that tiger snakes (Notechis scutatus) of island populations could consume larger prey than mainland populations due to an increased head size. Neonates of the island population had larger heads than neonates of the mainland population with a similar size, indicating that this adaptation was partially genetically determined. Next to this, the jaw size increased more rapidly in island tiger snakes exposed to large prey compared with those exposed to small prey, indicating that head shape is also influenced by the prey the snakes encounter. A similar scenario is possible for the European eel, with differential expression of genes causing an initial difference in head shape and exposure to hard feed leading to the development of broader heads. De Meyer et al. (2015) found that there is already considerable variation in head width and snout bluntness of European glass eels, although this variation is not yet bimodal. This could suggest that part of the observed head
Journal
of
Experimental
shape variation in our research is partially influenced by differential gene expression, with bimodality appearing once eels start feeding.
In conclusion, we found that differences in diet lead to changes in head morphology in European eel and that these changes can become observable early in the elver eel stage (smaller than 10 cm). Hard feeders develop broader heads and a broader adductor mandibulae region, whereas soft feeders develop narrow heads and a less broad adductor mandibulae region. To find out whether these differences in head shape are actually related to musculoskeletal adaptations, resulting in different bite forces, future research should focus on the musculoskeletal system of both morphotypes.
Whilst our study found that head shape dimorphism is primarily determined by the consumed prey, we could not test the reversibility in head morphology, as too few specimens remained at the end of the experiment for the data to be reliable. It would be interesting, however, to find out if broad-heads can become narrow-headed and vice versa when diets change, a phenomenon known as phenotypic flexibility (Piersma and Drent, 2003). Finally, future research should also look for a potential genetic basis of the head shape dimorphism, as it is not unlikely that genetic determination also plays a role in head shape differentiation.
Acknowledgements
The authors would like to thank the personnel of INBO (Institute for Nature and Forest Research) for their help with the sample collection.
Competing interests
The authors declare no competing or financial interests.
Author contributions
J.D.M. was responsible for the monthly picture taking, the shape analysis and interpretation of the results. Both J.D.M. and J.C. were responsible for feeding the eels and cleaning the aquaria. D.A. was the supervisor of the experiment, gave advice about the applied methods and feeding regime and helped with the writing of the paper.
Funding
This research was funded by a Special Research Fund (BOF) of Ghent University (BOF 13/24J/052) grant to J.D.M. The Flemish Science Foundation (FWO, project number 3G014911) funded J.C.
Supplementary information
Supplementary information available online at
http://jeb.biologists.org/lookup/suppl/doi:10.1242/jeb.131714/-/DC1
References
Alfaro, M. E.(2002). Forward attack modes of aquatic feeding garter snakes.Funct.
Ecol.16, 204-215.
Aubret, F., Shine, R. and Bonnet, X. (2004). Evolutionary biology: adaptive developmental plasticity in snakes.Nature431, 261-262.
Collyer, M. L., Stockwell, C. A., Adams, D. C. and Reiser, M. H. (2007). Phenotypic plasticity and contemporary evolution in introduced populations: evidence from translocated populations of white sands pupfish (Cyrpinodon
tularosa).Ecol. Res.22, 902-910.
Cucherousset, J., Acou, A., Blanchet, S., Britton, J. R., Beaumont, W. R. C. and Gozlan, R. E. (2011). Fitness consequences of individual specialisation in resource use and trophic morphology in European eels.Oecologia167, 75-84. D’Amico, L. J., Davidowitz, G. and Nijhout, H. F.(2001). The developmental and
physiological basis of body size evolution in an insect.Proc. R. Soc. B Biol. Sci. 268, 1589-1593.
Deelder, C. L.(1970). Synopsis of biological data on the eelAnguilla anguilla (Linnaeus) 1758.FAO Fisheries Synopsis80, 73 pp.
De Meyer, J., Ide, C., Belpaire, C., Goemans, G. and Adriaens, D.(2015). Head shape dimorphism in European glass eels (Anguilla anguilla). Zoology118, 413-423.
de Nie, H. W.(1987). Food, feeding periodicity and consumption of the eelAnguilla
anguilla (L.) in the shallow eutrophic Tjeukemeer (The Netherlands). Arch.
Hydrobiol.109, 421-443.
De Schepper, N.(2007). Cranial musculature ofAnguilla anguilla(Anguilliformes): functional implications related to narrow-headedness and broad-headedness. In Evolutionary morphology of body elongation in teleosts: aspects of convergent evolution. PhD dissertation, Ghent University, Ghent, Belgium, 292 pp.
Goldspink, G. and Howells, K.(1974). Work-induced hypertrophy in exercised normal muscles of different ages and the reversibility of hypertrophy after cessation of exercise.J. Physiol.239, 179-193.
Greenwood, P. H.(1965). Environmental effects on the pharyngeal mill of a cichlid fish,Astatoreochromis alluaudi, and their taxonomic implications.Proc. Linn. Soc.
Lond.176, 1-10.
Gvoždı́k, L. and Van Damme, R.(2003). Evolutionary maintenance of sexual dimorphism in head size in the lizardZootoca vivipara: a test of two hypotheses.
J. Zool.259, 7-13.
Helfman, G. S. and Winkelman, D. L.(1991). Energy trade-offs and foraging mode choice in American eels.Ecology72, 310-318.
Herrel, A., Van Damme, R. and De Vree, F.(1996). Sexual dimorphism of head size
inPodarcis hispanica atrata: testing the dietary divergence hypothesis by bite
force analysis.Neth. J. Zool.46, 253-262.
Herrel, A., Spithoven, R., Van Damme, R. and De Vree, F. (1999). Sexual dimorphism of head size in Gallotia galloti: testing the niche divergence hypothesis by functional analyses.Funct. Ecol.13, 289-297.
Hibbitts, T. J. and Fitzgerald, L. A. (2005). Morphological and ecological convergence in two natricine snakes.Biol. J. Linn. Soc.85, 363-371.
Higham, T. E., Day, S. W. and Wainwright, P. C.(2006). Sucking while swimming: evaluating the effects of ram speed on suction generation in bluegill sunfish
Lepomismacrochirus using digital particle image velocimetry.J. Exp. Biol.208,
2653-2660.
Hinton, R. J. and McNamara, J. A.(1984). Effect of age on the adaptive response of the adult temporomandibular joint.Angle Orthod.54, 154-162.
Fischer, E. and Horváth, I.(1977). Cytochemical studies on the cuticle and epidermis
ofTubifex tubifexMüll. with special regard to the localization of polysaccharides,
heavy metals and the DAB-reactivity.Histochemistry54, 259-271.
Ide, C., De Schepper, N., Christiaens, J., Van Liefferinge, C., Herrel, A., Goemans, G., Meire, P., Belpaire, C., Geeraerts, C. and Adriaens, D.(2011). Bimodality in head shape in European eel (Anguilla anguilla).J. Zool.285, 230-238.
Iwata, H. and Ukai, Y.(2002). SHAPE: a computer program package for quantitative evaluation of biological shapes based on elliptic Fourier descriptors.J. Hered.93, 384-385.
Kaifu, K., Yokouchi, K., Miller, M. J., Aoyama, J. and Tsukamoto, K.(2013a). Head-shape polymorphism in Japanese eelsAnguilla japonicain relation to differences of somatic growth in freshwater and brackish habitats.J. Fish Biol.82, 1308-1320.
Kaifu, K., Miyazaki, S., Aoyama, J., Kimura, S. and Tsukamoto, K.(2013b). Diet of Japanese eelsAnguilla japonicain the Kojima Bay-Asahi river system, Japan.
Environ. Biol. Fishes96, 439-446.
Kuhl, F. P. and Giardina, C. R.(1982). Elliptic fourier features of a closed contour.
Comput. Graph. Image Process.18, 236-258.
Lammens, E. H. R. R. and Visser, J. T.(1989). Variability of mouth width in European eel,Anguilla anguilla, in relation to varying feeding conditions in three Dutch lakes.Environ. Biol. Fishes26, 63-75.
Malmquist, H. J.(1992). Phenotype-specific feeding behaviour of two arctic charr
Salvelinus alpinusmorphs.Oecologia92, 354-361.
McCart, P. (1970). Evidence for the existence of sibling species of pygmy whitefish (Proposium coulteri) in three Alaskan lakes. InBiology of Coregonid
Fishes(ed. C. C. Lindsey and C. S. Woods), pp. 81-98. Winnipeg: University
Manitoba Press.
Mehta, R. S. and Wainwright, P. C.(2007). Biting releases constraints on moray eel feeding kinematics.J. Exp. Biol.210, 495-504.
Moret, Y. and Moreau, J.(2012). The immune role of the arthropod skeleton.
Invertebr. Surviv. J.9, 200-206.
Muller, M., Osse, J. W. M. and Verhagen, J. H. G. (1982). A quantitative hydrodynamical model of suction feeding in fish.J. Theor. Biol.95, 49-79. Nagasawa, H. (2012). The crustacean cuticle: structure, composition and
mineralization.Front. Biosci.E4, 711-720.
Piersma, T. and Drent, J. (2003). Phenotypic flexibility and the evolution of organismal design.Trends Ecol. Evol.18, 228-233.
Proman, J. M. and Reynolds, J. D.(2000). Differences in head shape of the European eel,Anguilla anguilla(L.).Fish. Manag. Ecol.7, 349-354.
Rahn, J.(1955). Untersuchungen über Alter und Wachstum des Aalbestandes im Sakrower See.Z. Fischerei4, 235-256.
Rohlf, F. J. and Archie, J. W.(1984). A comparison of Fourier methods for the description of wing shape in mosquitoes (Diptera: Culicidae).Syst. Zool.33, 302-317.
Scheiner, S. M.(1993). Genetics and evolution of phenotypic plasticity.Annu. Rev.
Ecol. Syst.24, 35-68.
Stearns, S. C.(1989). Evolutionary significance of phenotypic plasticity.Bioscience 39, 436-445.
Tacon, A. G. J.(1992). Nutritional fish pathology. Morphological signs of nutrient deficiency and toxicity in farmed fish. FAO Fish Technical paper 330. Rome: FAO. 75 pp.
Taylor, E. B. and Bentzen, P.(1993). Evidence for multiple origins and sympatric divergence of trophic ecotypes of smelt (Osmerus) in northeastern North America.
Evolution47, 813-832.
Journal
of
Experimental
Tesch, F. W.(1977).The Eel: Biology and Management of Anguillid Eels. London: Chapmann and Hall. 434 pp.
Tesch, F. W.(2003).The Eel, 5th edn. Oxford: Blackwell Science. 408 pp. Thurow, F.(1958). Untersuchungen ûber die spitz und breitköpfigen Varianten des
Flussaales.Arch. Fischereiwiss.9, 79-97.
Törlitz, H. (1922). Anatomische und entwicklungsgeschichtliche Beiträge zur Artfrage unseres Flussaales.Z. Fischerei21, 1-48.
Van Wassenbergh, S., Herrel, A., Adriaens, D. and Aerts, P.(2007). No trade-off between biting and suction feeding performance in clariid catfish.J. Exp. Biol.210, 27-36.
Wainwright, P. C. (1999). Ecomorphology and prey capture in fishes. In
Ichthyology: Recent Research Advances (ed. D. N. Saksena), pp. 403-415.
New Delhi: Oxford and IBH Publishing.
Walker, J. A.(1997). Ecological morphology of lacustrine threespine stickleback
Gasterosteus aculeatusL. (Gasterosteidae) body shape.Biol. J. Linn. Soc.61, 3-50.
Wimberger, P. H. (1992). Plasticity of fish body shape. The effects of diet, development, family and age in two species ofGeophagus(Pisces: Cichilidae).
Biol. J. Linnean Soc.45, 197-218.
Wimberger, P. H.(1993). Effects of vitamin C deficiency on body shape and skull osteology in Geophagus brasiliensis: implications for interpretations of morphological plasticity.Copeia1993, 343-351.
Wintzer, A. P. and Motta, P. J.(2005). Diet-induced phenotypic plasticity in the skull morphology of hatchery-reared Florida largemouth bass,Micropterus salmoides
floridanus.Ecol. Freshw. Fish14, 311-318.
Wootton, R. J.(1994). Energy allocation in the threespine stickleback. InThe
Evolutionary Biology of the Threespine Stickleback(ed. M. A. Bell and S. A.
Foster), pp. 114-143. Oxford: Oxford University Press.
Wund, M. A., Baker, J. A., Clancy, B., Golub, J. L. and Foster, S. A.(2008). A test of the ‘flexible stem’ model of evolution: ancestral plasticity, genetic accommodation, and morphological divergence in the threespine stickleback radiation.Am. Nat.172, 449-462.
Journal
of
Experimental