SHORT COMMUNICATION
Echo-acoustic flow affects flight in bats
Kathrin Kugler1, Wolfgang Greiter2, Harald Luksch2, Uwe Firzlaff2and Lutz Wiegrebe1,*
ABSTRACT
Flying animals need to react fast to rapid changes in their environment. Visually guided animals use optic flow, generated by their movement through structured environments. Nocturnal bats cannot make use of optic flow, but rely mostly on echolocation. Here, we show that bats exploit echo-acoustic flow to negotiate flight through narrow passages. Specifically, bats’flight between lateral structures is significantly affected by the echo-acoustic salience of those structures, independent of their physical distance. This is true even though echolocation, unlike vision, provides explicit distance cues. Moreover, the bats reduced the echolocation sound levels in stronger flow, probably to compensate for the increased summary target strength of the lateral reflectors. However, bats did not reduce flight velocity under stronger echo-acoustic flow. Our results demonstrate that sensory flow is a ubiquitous principle for flight guidance, independent of the fundamentally different peripheral representation of flow across the senses of vision and echolocation.
KEY WORDS: Echolocation, Sonar, Navigation, Flow field, Flight guidance
INTRODUCTION
Flight allows for fast navigation in 3D space. For visually guided animals in flight, stationary objects in the close environment produce patterns of visual motion on the retina, commonly referred to as optic flow (Gibson, 1994). Numerous studies have shown that optic flow is an important entity in perception that guides motion in space in many flying animals (Bhagavatula et al., 2011; Dyhr and Higgins, 2010; Frye and Dickinson, 2007; Srinivasan, 1996). Optic flow is also important for avoiding collisions or estimating time to contact (Wagner, 1982; Wang and Frost, 1992).
Bats, as the only flying mammals, typically cannot use vision to negotiate flight close to structures because of their nocturnal life style. Instead, bats mostly rely on echolocation, i.e. the auditory analysis of the echoes of self-generated sounds that are emitted at varying rates (Griffin and Grinnell, 1958). Unlike vision, echolocation provides explicit distance information through the analysis of echo delay (Simmons, 1971, 1973). Specifically, at a given speed of sound, the delay between a sonar emission and the reception of the echo encodes the distance of the reflective surface in metres. Bats have evolved specialised neural circuits in the auditory brainstem and midbrain to measure echo delay, resulting in a cortical chronotopic map (O’Neill and Suga, 1979; Portfors and Wenstrup, 1999, 2001; Suga, 1970, 1990). Azimuth and elevation of a
reflective surface have to be binaurally computed, because the sensory epithelium for sound (the organ of Corti) does not provide explicit spatial information. Thus, compared with vision, echolocation provides relatively sparse spatial information in azimuth and elevation, but more explicit distance information.
For a bat flying through structured 3D space, distances and angles of sound-reflecting surfaces change continuously, effectively creating an echo-acoustic flow. This continuous flow, however, is discretely sampled by bats and thus is not necessarily perceived as continuous.
Echo-acoustic flow is especially required during commuting flight–when bats follow the edges of vegetation to travel between roosting and feeding sites–in order to keep the lateral distance to passing objects constant, as is typically observed in field studies (Holderied et al., 2006).
Both experimental and theoretical work has indicated that bats might perceive echo-acoustic flow (Bartenstein et al., 2014; Lee et al., 1992; Müller and Schnitzler, 1999, 2000) but the unequivocal use of echo-acoustic flow for navigation by bats has not been demonstrated. Here, we tested the hypothesis that, despite the explicit distance information provided by echolocation, bats still recruit echo-acoustic flow field information to adjust their distance from lateral structures in flight. If this were true, we would expect bats flying between structures that differ in the strength of their echo-acoustic flow to fly closer to the structure that elicits the weaker flow.
MATERIALS AND METHODS Experimental setup
The experimental setup was a flight tunnel (Fig. 1A) consisting of two echo-attenuated, terminal cubes and a 3 m-long, removable test zone in between. The terminal cubes could be separated from the test zone with curtains and each contained one feeder. Audio was recorded via four ultrasonic microphones (SPU0410LR5H, Knowles, Itasca, IL, USA) positioned centrally on the back walls of the terminal cubes (20 and 91 cm height). Analog signals were preamplified (Octopre LE, Focusrite, High Wycombe, UK) and AD converted by an audio interface (Ultralite, MOTU, Cambridge, MA, USA) at 192 kHz.
The floor of the test zone was lined with white cloth to achieve high contrast in the video; its ceiling consisted of visually and acoustically transparent gauze. It was lit along both side walls with infrared LED strips (Synergy 21 LED Flex Strip infrared 86417, ALLNET GmbH Computersysteme, Germering, Germany). An infrared camera (A602f, Basler, Ahrensburg, Germany) at 3.54 m height recorded videos at 20 frames s−1. For audio-visual synchronization, the camera was triggered via the audio interface.
Stimuli and experimental procedure
Stimuli for this experiment were the structured side walls of the test zone. Each side wall was planked vertically on one side and horizontally on the other side with tongue-and-groove panelling, which creates periodic ridges and grooves. Vertical ridges induce Received 17 February 2016; Accepted 21 March 2016
1
Division of Neurobiology, Department Biology II, LMU Munich, Großhaderner Str. 2, 82152 Planegg-Martinsried, Germany.2Lehrstuhl für Zoologie, Technische Universität München, Liesel-Beckmann-Str. 4, 85354 Freising, Germany.
*Author for correspondence ([email protected])
L.W., 0000-0002-9289-6187
Journal
of
Experimental
strong echo-acoustic flow because they are orientated perpendicular to the flight direction and result in time-variant echoes. Horizontal ridges induce weaker echo-acoustic flow because they are orientated parallel to the flight direction. Two experiments were conducted, using stimuli that vary in the strength of echo-acoustic flow when presented in vertical orientation: (i) broad panelling (weaker echo-acoustic flow)–ridge width 7.5 cm, groove width 1.5 cm; and (ii) fine panelling (stronger echo-acoustic flow) – ridge width 3 cm, groove width 1.5 cm.
Rotating the side walls changes the orientation of the ridges between horizontal and vertical. This resulted in eight experimental conditions [4 arrangements of walls (both vertical, both horizontal, one vertical and the other horizontal or vice versa) times 2 flight directions]. A sequence of random permutations of the eight conditions was pre-generated and experimental trials for each animal were acquired according to this sequence.
Training
Seven adult bats (3 female, 4 male) of the species Phyllostomus discolorWagner 1843 were trained to fly back and forth between the two feeders. Five training days were followed by two resting days. Training took place in a dark, echo-attenuated flight room (2.1×1.2×2.4 m).
Data acquisition
Data acquisition took place on 10 consecutive days. The start of a trial was initiated by opening the curtain to the test zone; after the animal had passed the test zone, the experimenter closed the curtain behind it. Audio and video ringbuffer recordings (5 s duration) were saved. All technical equipment was controlled with a custom-written Matlab program (MathWorks, Natick, MA, USA)
using Soundmexpro (HörTech, Oldenburg, Germany), and the Matlab image acquisition and data acquisition toolboxes.
Data analysis
Only trials without reversal of flight direction were analysed. Custom-written Matlab programs were used for all data analyses: automatic 2D flight path reconstruction, calculation of flight velocity and audio analyses. Some trials could not be analysed for audio because of a microphone defect.
All analyses were applied on the individual level for each experimental animal. Tests comparing the broad and fine panelling were applied on the results of one specific bat, i.e. only on data recorded with bats which participated in both experiments.
Flight path analyses were performed using all data points in the respective combination of flight direction and wall arrangement that lay within the central 1 m of the test zone.
Homogeneity of flight paths
A Brown and Forsythe test was used to test whether an animal’s flight paths in the central 1 m of the test zone showed equal variances with concordant vertical and concordant horizontal ridges. The range between the first and the third quartile was used as a measure for the homogeneity of the flight paths of all flights of one bat. These values were compared to determine with which ridge orientation flight paths were more homogeneous.
Analysis of number of calls and inter-call intervals (ICIs)
We tested whether the number of calls produced in the central 2 m of the flight tunnel differed for flights between vertically ridged walls and flights between horizontally ridged walls (two-sided Wilcoxon rank sum test). We checked with a Kruskal–Wallis test
B
A
C
D
IR camera 1 m
Microphones
Feeder with light barrier
3 m test zone
Deviation from midline (cm)
30
20
10
0
–10
–20
–30
50 100 150 200 250 Position in flight tunnel (cm)
Bat 1 Bat 3 Bat 4 Bat 5 Bat 6 Bat 1 Bat 3 Bat 4 Bat 5 Bat 6
Bat 1 Bat 4 Bat 5 Bat 6 Bat 7 Bat 1 Bat 4 Bat 5 Bat 6 Bat 7
–30 0 30 –30 0 30
5 m
Deviation from midline (cm)
[image:2.612.49.378.52.386.2]1.2 m
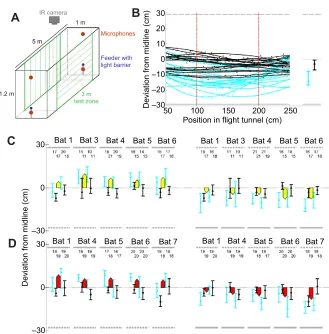
Fig. 1. Experimental setup and bat flight path analysis.(A) Schematic drawing of the set-up with a central test zone and two terminal cubes, separable with curtains. Bats’flights were monitored via an infrared (IR) camera centred above the test zone, and echolocation calls were recorded with two ultrasonic microphones (at 20 and 91 cm height at midline) in each of the terminal cubes. After each flight, the bat was rewarded from the feeder platform. The structures of the lateral walls in the test zone (either vertical or horizontal ridges) could easily be changed in between trials by rotating the lateral walls. (B) Left: example flight paths from bat 6 for lateral walls with orthogonal orientation to each other (blue paths, ridging illustrated by grey lines) and for lateral walls with concordant orientation (black paths, both walls with vertical ridges). Medians and interquartile range of the flight paths are shown on the right. (C) Medians and interquartile ranges of flight paths for all bats with broad ridges oriented either concordantly vertical (black) or orthogonally (blue). The panel on the left shows results for horizontal ridges on the‘upper’wall and vertical ridges on the‘lower’wall; the right panel, vice versa. The first two data points for each bat represent flights from left to right; the second two data points represent flights from right to left. The number of flights is given above the respective bar. Mean deviations between concordant and orthogonal ridges are represented by the coloured arrows. The direction and magnitude of the coloured arrows clearly show that the bats always flew closer to the side with the weaker echo-acoustic flow. (D) Data for the experiment with the fine ridges in the same format as C.
Journal
of
Experimental
whether the distribution of ICIs differed across these conditions. The skewness of the distributions, which quantifies the extent to which a distribution deviates from symmetry, was calculated. A Gaussian distribution has a skewness of zero (fully symmetric) whereas the ICI distributions show an asymmetry in favour of short ICIs. In this case, the skewness is larger than zero.
Experiments were approved by the Regierung von Oberbayern (55.2-1-54-2532-221-14) and conducted under the principles of laboratory animal care and the regulations of the German Law on Animal Protection. Approval to keep and breed the bats was issued by Munich district veterinary office.
RESULTS AND DISCUSSION
Example flight paths of a bat from left to right between vertical, concordant ridges are shown in Fig. 1B (black paths). When ridging was changed to horizontal on one wall, the bat chose to fly significantly closer to that wall and, consequently, further from the vertically ridged wall (Fig. 1B, blue paths). The medians and interquartile ranges of the bat’s deviation from the midline within the central 1 m of the corridor are shown on the right of Fig. 1B. Overall, 645 flight paths from 5 bats were analysed with a ridge spacing of 9 cm. Fig. 1C shows how median flight paths differed between orthogonal (blue) and concordant vertical (black) ridge conditions when the vertical ridges were presented on one wall (Fig. 1C, left) or the other (Fig. 1C, right). Net lateral deviations for both flight directions are represented by the yellow arrows. All bats consistently and significantly shifted their flight paths towards the wall with horizontal ridges inducing lower echo-acoustic flow (P<0.05, two-sided rank sum test).
We repeated the whole experiment, replacing the side walls with walls where the ridge spacing was reduced from 9 cm to 4.5 cm; 750 trials from 5 bats were analysed. Data show that with this finer spacing of the ridges, the bats also significantly deviated in their flight trajectory between concordant and orthogonal ridges, again flying significantly closer to the horizontal ridges (Fig. 1D, red arrows). The magnitude of this deviation, however, was not significantly different from that with the 9 cm spacing (Wilcoxon signed rank test).
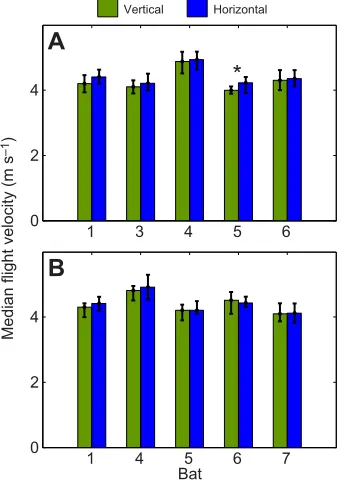
Next, we compared peak flight velocity to assess whether bats adjust their flight velocity to balance echo-acoustic flow. With the 9 cm ridges, all bats tended to fly faster when the horizontal ridges were presented on both walls than with vertical ridges (Fig. 2A). This was, however, only significant for bat 5 (P≤0.05, two-sided Wilcoxon rank sum test). With the finer spacing between ridges (Fig. 2B), the differences in flight velocity between concordant vertical and concordant horizontal ridges were even less pronounced. We conclude that flight velocity was not significantly affected by echo-acoustic flow as presented here.
We then tested how homogeneous the flight paths were between the lateral walls when both of them had either horizontal or vertical ridges. Specifically, we tested whether the stronger echo-acoustic flow of the vertical ridges leads the bats to fly along more homogeneous paths than with horizontal ridges. With broad ridge spacing, we found this to apply in 8 of 10 cases (5 bats times 2 flight directions). With fine ridge spacing, we found this to apply in 6 of 10 cases (P≤0.05, Brown and Forsythe test). Note, however, that we also found the opposite effect (less homogeneous flight paths with vertical ridges) in 1 of 10 cases each for broad and fine ridges. Overall, the bats showed more homogeneous flight paths when exposed to stronger echo-acoustic flow.
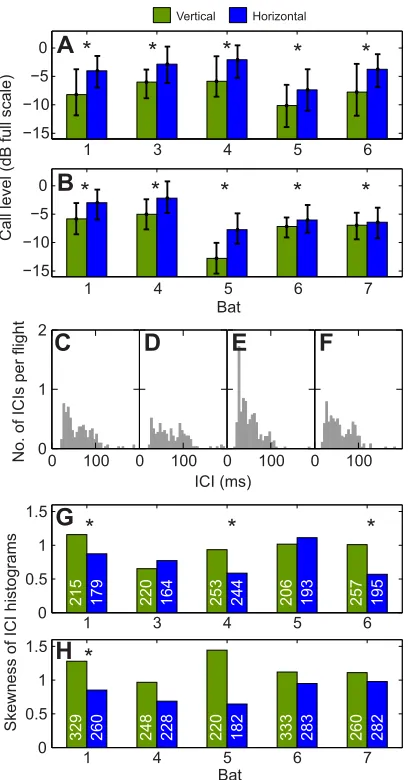
The ultrasonic recordings during flights show that all animals produced significantly fainter calls when both walls were vertically
ridged than when they were horizontally ridged (P≤0.05, two-sided Wilcoxon rank sum test). This is true for both the broad ridge spacing (4715 calls from 595 flights; Fig. 3A) and the fine ridge spacing (5702 calls from 704 flights; Fig. 3B). Only call onsets (root mean square of the first 0.4 ms) were analysed to make sure that echoes from the reverberant test zone did not contaminate the analysis. The bats did not alter their rate of sonar emission, either per distance or per time, between the vertical and horizontal ridges. Again, this is true for both the broad and the fine ridge spacing (data not shown). However, some of the bats changed their temporal ensonification strategy: specifically, the distribution of ICIs changed significantly (see Fig. 3C–F for example ICI histograms of bat 1) in that the skewness of the ICI histogram became less positive when the vertical ridges were replaced with horizontal ridges. This means that, while the bats did not produce significantly more calls with vertical ridges, the ICIs were more often shorter. Quantitative results for the analysis on the skewness of ICI histograms are shown in Fig. 3G,H.
Taken together, the current psychophysical experiments show that echolocating bats (P. discolor) adjust their flight paths between structured surfaces according to the strength of echo-acoustic flow elicited by these surfaces. Our bats always chose to fly closer to the side wall that elicited the weaker echo-acoustic flow. This is surprising because, unlike all visually guided flyers (insects and birds), bats have explicit information about their distance to objects through the neural analysis of echo delay. Our data show that the perceptual valence of echo-acoustic flow was ranked over these explicit echo-acoustic distance cues. Thus, our results demonstrate that sensory flow elicited by self-motion is a ubiquitous principle for guidance of flight in the animal kingdom, independent of the sensory modality and the fundamentally different peripheral sensory representation of the perceptual cues mediating the flow information.
1 3 4 5 6
0 2 4
A
Vertical Horizontal
1 4 5 6 7
0 2 4
Median flight velocity (m s
–1
)
Bat
B
[image:3.612.355.525.442.684.2]*
Fig. 2. Peak flight velocity.(A) Broad ridge spacing (9 cm). (B) Fine ridge spacing (4.5 cm). Green bars represent flight velocities with concordant vertical ridges; blue bars represent flight velocities with concordant horizontal ridges. Data are medians and interquartile range. The asterisk indicates a significant difference in flight velocity (Wilcoxon rank sum test,P<0.05).
Journal
of
Experimental
The neurobiological basis for the stronger perceptual valence of echo-acoustic flow compared with explicit echo-acoustic distance cues is not completely clear, but recent research has thrown some light on this. It has been known for some decades that target distance is explicitly encoded by specialised neurons in the brain of various bat species (Mittmann and Wenstrup, 1995; O’Neill and Suga, 1979; Olsen and Suga, 1991) and represented in a chronotopic map of echo delay in the bat auditory cortex (e.g. Bartenstein et al., 2014; Hagemann et al., 2010; O’Neill and Suga, 1979). However, it has recently been shown that this map is‘blurry’and responses depend critically on the actual combination of echo intensity and delay (Hechavarría et al., 2013). Indeed, Bartenstein et al. (2014) found
that neurons in the auditory cortex encode echo-acoustic flow information on the geometric relationship between a target and the bat’s flight trajectory, rather than echo delay. Thus, the classical chronotopic map as it has been described in the bat cortex may not encode echo delay per se. It may rather encode echo delay as it changes over time in typical fly-by situations that elicit echo-acoustic flow. This may provide a neurophysiological basis for the bats’perceptual preference described in our experiments.
How is echo-acoustic flow represented in the bat auditory system? Clearly the peripheral sensory representation of flow fields is fundamentally different across vision and echolocation: while in vision, the retina provides explicit spatial information for the time-variant structures, it is not even clear to what extent these structures are perceptually resolved in echolocation. A vertical ridge that generates the flow information in the current experiments can be approximated as a vertical line reflector that reflects into all azimuths. In response to a bat’s call, many of these line reflectors will generate reflections that add up to a complex echo with increasing delays and decreasing amplitudes (due to geometric and atmospheric attenuation). Horizontal ridges, in contrast, will reflect relatively little energy back to the bat. Thus, it is conceivable that the bats did not perceive the vertical passing ridges as time-variant but simply as louder. In line with this, the bats reduced the call level with vertical ridges compared with horizontal ridges, an exemplification of automatic gain control, as ubiquitously observed in echolocating bats and whales (Au and Benoit-Bird, 2003; Hartley, 1992; Kick and Simmons, 1984; Linnenschmidt et al., 2012). However, the complex echoes generated by the ridges change periodically with a repetition rate equal to the product of ridge spacing and flight velocity. With the current (broad) ridge spacing of 11 m−1and peak flight velocity around 4.5 m s−1(see Fig. 2), echoes change periodically with a frequency of 49.5 Hz. But, our bats produced much fewer calls in flight, of the order of 16 s−1 (not shown). Thus, the ridge periodicity is strongly undersampled by the bats. Fontaine and Peremans (2011) have shown how bats can reconstruct the wing beat of insects despite such echo-acoustic undersampling, namely by adaptively adjusting and distributing ICIs. The fact that some of our bats indeed showed changes in the skewness of the ICI histograms (see Fig. 3C–H) corroborates this hypothesis.
In summary, the current experiments demonstrate that echolocating bats recruit flow field information to adjust their flight paths along structured layouts. These findings are in agreement with previous reports on birds and insects and thus corroborate the ubiquitous nature of flow field-guided navigation. However, bats assess lateral structures by echolocation, not vision, and the peripheral sensory representations of spatial information across these senses are fundamentally different. It is tempting to speculate that this difference results in the remarkable finding that our bats did not reduce flight velocity under stronger flow, an effect readily observed in birds and insects (e.g. Baird et al., 2005; Bhagavatula et al., 2011; David, 1982; Srinivasan, 1996). Our bats also did not change the ensonification rate and showed only small variations in temporal ensonification patterns. These data suggest that the explicit distance cues provided by echolocation, unlike vision, lead to a lower perceptual weighting of flow field information in bats compared with visually guided flyers. As all of our experiments were conducted in the dark, it may be informative in future studies to assess the extent to which bats flying in the light can recruit (optic) flow field information to negotiate flight through narrow passages. The relative salience of optic versus echo-acoustic flow field precepts may also vary strongly across bat species, as some
Vertical Horizontal
1 3 4 5 6
−15 −10 −5
0
A
1 4 5 6 7
−15 −10 −5 0
Call level (dB full scale)
Bat
B
No. of ICIs per flight
C
0 100
0 1 2
E
0 100
F
0 100
D
ICI (ms)
0 100
1 3 4 5 6
0 0.5 1 1.5
215 179 220 164 253 244 206 193 257 195
G
1 4 5 6 7
0 0.5 1 1.5
Skewness of ICI histograms
Bat
H
329 260 248 228 220 182 333 283 260 282
*
*
*
*
*
*
*
*
*
*
*
*
*
*
Fig. 3. Analysis of ensonification parameters.(A,B) Analyses of echolocation call levels for the broad (A) and fine (B) ridges. Data show that bats called significantly fainter with concordant vertical ridges (green) than with concordant horizontal ridges (blue). Data are medians and interquartile range. Asterisks show significant differences (two-sided Wilcoxon rank sum test, P<0.05). (C–F) Example inter-call interval (ICI) histograms of bat 1 (C, vertical broad ridges; D, horizontal broad ridges; E, vertical fine ridges; F, horizontal fine ridges). The ICI axis is truncated at 200 ms; maximal ICIs across bats and experimental conditions ranged between 102 and 233 ms. (G,H) Analyses of the skewness of the ICI distributions for the broad (G) and fine (H) ridges. Asterisks show where the distribution of ICIs differs significantly between concordant vertical ridges and concordant horizontal ridges. Numbers within the bars represent the number of ICIs on which each skewness analysis was based.
Journal
of
Experimental
[image:4.612.74.278.55.445.2]bats are quite active in daylight or dusk (e.g.Saccopteryx bilineata), while many purely nocturnal, insectivorous bats appear to have somewhat reduced vision (e.g.Pteronotus parnellii).
Acknowledgements
The authors would like to thank Cynthia F. Moss and Herbert Peremans for in-depth and fruitful discussions on the topic.
Competing interests
The authors declare no competing or financial interests.
Author contributions
K.K., U.F. and L.W. designed the experiments; K.K. and W.G. built the setup; K.K. executed the experiments and analysed the data; K.K., W.G., H.L., U.F. and L.W. wrote the paper.
Funding
This work was funded by a research grant from the Deutsche
Forschungsgemeinschaft (Wi 1518/12) to L.W. and by a research stipend of the Andrea von Braun Stiftung (Foundation) to K.K.
References
Au, W. W. L. and Benoit-Bird, K. J. (2003). Automatic gain control in the
echolocation system of dolphins.Nature423, 861-863.
Baird, E., Srinivasan, M. V., Zhang, S. and Cowling, A.(2005). Visual control of
flight speed in honeybees.J. Exp. Biol.208, 3895-3905.
Bartenstein, S. K., Gerstenberg, N., Vanderelst, D., Peremans, H. and Firzlaff,
U.(2014). Echo-acoustic flow dynamically modifies the cortical map of target
range in bats.Nat. Commun.5, 4668.
Bhagavatula, P. S., Claudianos, C., Ibbotson, M. R. and Srinivasan, M. V.(2011).
Optic flow cues guide flight in birds.Curr. Biol.21, 1794-1799.
David, C. T.(1982). Compensation for height in the control of groundspeed by
Drosophilain a new,‘barber’s pole’wind tunnel.J. Comp. Physiol.147, 485-493.
Dyhr, J. P. and Higgins, C. M.(2010). The spatial frequency tuning of
optic-flow-dependent behaviors in the bumblebeeBombus impatiens.J. Exp. Biol.213,
1643-1650.
Fontaine, B. and Peremans, H. (2011). Compressive sensing: a strategy for
fluttering target discrimination employed by bats emitting broadband calls.
J. Acoust. Soc. Am.129, 1100.
Frye, M. A. and Dickinson, M. H.(2007). Visual edge orientation shapes free-flight
behavior inDrosophila.Fly1, 153-154.
Gibson, J. J.(1994). The visual perception of objective motion and subjective
movement.Psychol. Rev.101, 318-323.
Griffin, D. R. and Grinnell, A. D.(1958). Ability of bats to discriminate echoes from
louder noise.Science128, 145-147.
Hagemann, C., Esser, K.-H. and Kossl, M.(2010). Chronotopically organized
target-distance map in the auditory cortex of the short-tailed fruit bat.
J. Neurophysiol.103, 322-333.
Hartley, D. J.(1992). Stabilization of perceived echo amplitudes in echolocating
bats. I. Echo detection and automatic gain control in the big brown bat,Eptesicus
fuscus, and the fishing bat,Noctilio leporinus.J. Acoust. Soc. Am.91, 1120.
Hechavarrı́a, J. C., Macıas, S., Vater, M., Voss, C., Mora, E. C. and Kó ̈ssl, M.
(2013). Blurry topography for precise target-distance computations in the auditory
cortex of echolocating bats.Nat. Commun.4, 2587.
Holderied, M. W., Jones, G. and von Helversen, O. (2006). Flight and
echolocation behaviour of whiskered bats commuting along a hedgerow:
range-dependent sonar signal design, Doppler tolerance and evidence for‘acoustic
focussing’.J. Exp. Biol.209, 1816-1826.
Kick, S. A. and Simmons, J. A.(1984). Automatic gain control in the bat’s sonar
receiver and the neuroethology of echolocation.J. Neurosci.4, 2725-2737.
Lee, D. N., van der Weel, F. R., Hitchcock, T., Matejowsky, E. and Pettigrew, J. D.
(1992). Common principle of guidance by echolocation and vision.J. Comp.
Physiol. A171, 563-571.
Linnenschmidt, M., Beedholm, K., Wahlberg, M., Hojer-Kristensen, J. and
Nachtigall, P. E.(2012). Keeping returns optimal: gain control exerted through
sensitivity adjustments in the harbour porpoise auditory system.Proc. R. Soc. B
Biol. Sci.279, 2237-2245.
Mittmann, D. H. and Wenstrup, J. J.(1995). Combination-sensitive neurons in the
inferior colliculus.Hear. Res.90, 185-191.
Müller, R. and Schnitzler, H.-U. (1999). Acoustic flow perception in cf-bats:
properties of the available cues.J. Acoust. Soc. Am.105, 2958.
Müller, R. and Schnitzler, H. U.(2000). Acoustic flow perception in cf-bats:
extraction of parameters.J. Acoust. Soc. Am.108, 1298.
Olsen, J. F. and Suga, N.(1991). Combination-sensitive neurons in the medial
geniculate body of the mustached bat: encoding of target range information.
J. Neurophysiol.65, 1275-1296.
O’Neill, W. E. and Suga, N.(1979). Target range-sensitive neurons in the auditory
cortex of the mustache bat.Science203, 69-73.
Portfors, C. V. and Wenstrup, J. J.(1999). Delay-tuned neurons in the inferior
colliculus of the mustached bat: implications for analyses of target distance.
J. Neurophysiol.82, 1326-1338.
Portfors, C. V. and Wenstrup, J. J.(2001). Topographical distribution of
delay-tuned responses in the mustached bat inferior colliculus.Hear. Res.151, 95-105.
Simmons, J. A.(1971). Echolocation in bats: signal processing of echoes for target
range.Science171, 925-928.
Simmons, J. A.(1973). The resolution of target range by echolocating bats.
J. Acoust. Soc. Am.54, 157.
Srinivasan, M. V.(1996). Visual processing. Flies go with the flow.Nature384, 411.
Suga, N.(1970). Echo-ranging neurons in the inferior colliculus of bats.Science
170, 449-452.
Suga, N.(1990). Cortical computational maps for auditory imaging.Neural Netw.
3, 3-21.
Wagner, H.(1982). Flow-field variables trigger landing in flies.Nature297, 147-148.
Wang, Y. and Frost, B. J.(1992). Time to collision is signalled by neurons in the
nucleus rotundus of pigeons.Nature356, 236-238.