METHODS & TECHNIQUES
Using accelerometers to remotely and automatically characterize
behavior in small animals
Talisin T. Hammond1,2,*, Dwight Springthorpe1, Rachel E. Walsh1,2and Taylor Berg-Kirkpatrick3
ABSTRACT
Activity budgets in wild animals are challenging to measure via direct observation because data collection is time consuming and observer effects are potentially confounding. Although tri-axial accelerometers are increasingly employed for this purpose, their application in small-bodied animals has been limited by weight restrictions. Additionally, accelerometers engender novel complications, as a system is needed to reliably map acceleration to behaviors. In this study, we describe newly developed, tiny acceleration-logging devices (1.5–2.5 g) and use them to characterize behavior in two chipmunk species. We collected paired accelerometer readings and behavioral observations from captive individuals. We then employed techniques from machine learning to develop an automatic system for coding accelerometer readings into behavioral categories. Finally, we deployed and recovered accelerometers from free-living, wild chipmunks. This is the first time to our knowledge that accelerometers have been used to generate behavioral data for small-bodied (<100 g), free-living mammals.
KEY WORDS: Behavioral ecology, Animal behavior, Acceleration, Machine learning, Chipmunks, Activity budget
INTRODUCTION
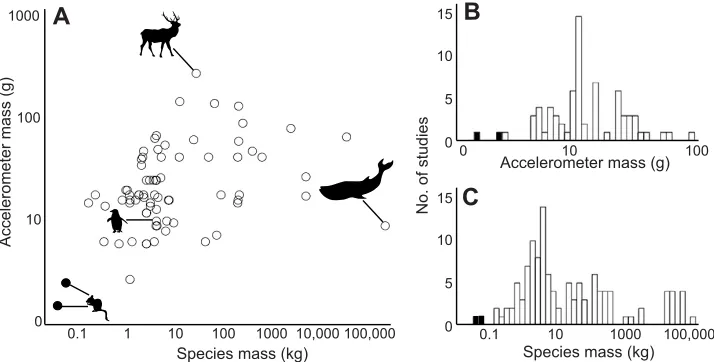
Historically, constructing accurate behavioral activity budgets for wild animals has been difficult because of challenges associated with observer effects, evasive study organisms and extensive time investment. Remote monitoring of behavior with accelerometers is an increasingly common method for measuring behavior in wild animals while mitigating these problems (Brown et al., 2013; Davis et al., 1999; Kays et al., 2015; Lagarde et al., 2008; Nakamura et al., 2015; Shamoun-Baranes et al., 2012; Weimerskirch et al., 2005; Wilmers et al., 2015). Thus far, accelerometers have mainly been deployed on larger species because of the weight limitations imposed by smaller-bodied animals (Fig. 1). This technology, however, could be particularly beneficial for small-bodied species, which are often cryptic and difficult to observe in the wild.
While useful, accelerometers do engender a novel set of complications associated with the need to reliably map acceleration patterns to specific behaviors. Many simultaneous recordings of paired behavioral observations and accelerometer readings must be collected to determine the correct mapping. Machine-learning techniques have successfully been used to complete this task (Carroll et al., 2014; Bidder et al., 2014; Escalante et al., 2013; Gao et al., 2013;
Grünewälder et al., 2012; Martiskainen et al., 2009; McClune et al., 2014; Nathan et al., 2012; Sakamoto et al., 2009). Previously, machine-learning algorithms have not modeled sequential correlations between behaviors and have not allowed for flexible lengths of behavioral segments, two constraints that may limit system accuracy. In this study, we used newly engineered acceleration-logging devices of our own design to study two free-living, small-bodied species: the alpine (Tamias alpinusMerriam 1893) and lodgepole [Tamias speciosus(Merriam 1890)] chipmunks. These species are the subject of considerable research because of their divergent responses to the past century of climate change in Yosemite National Park, CA, USA; despite being closely related and co-occurring at some sites,T. alpinuscontracted its range significantly upwards in elevation, while T. speciosus did not (Moritz et al., 2008). Behavior may serve as an important first-line response mechanism for responding to environmental change (Sih et al., 2011). Because chipmunks are difficult to observe directly, remote monitoring technologies like accelerometers provide a potentially important tool for studying their behavior.
We conducted a validation study by collecting simultaneous video and accelerometer records of captive chipmunk behavior. We then trained a hidden semi-Markov model on this dataset and used the resulting system to predict behaviors for accelerometer logs from free-living animals. To establish biological relevance, we tested whether the data reflected rhythmicity and seasonality of behavior, predicting that animals would be day-active and more active in summer than in autumn (Bahnak and Kramm, 1977; Kramm and Kramm, 1980; Wauters et al., 1992). BecauseT. alpinus’s range shift has been attributed to climate change (Moritz et al., 2008; Rubidge et al., 2010) and past work suggests that this species may be particularly sensitive to dry heat (Heller and Poulson, 1972), we also hypothesized that its behavior might be more temperature dependent than that of T. speciosus, and predicted that, in contrast to T. speciosus,T. alpinus would show higher activity in the early morning and late afternoon (07:00–10:00 h and 15:00–18:00 h) than at midday (11:00–14:00 h), when temperatures are typically warmer. By combining the use of newly engineered accelerometers with the validation of behavioral data and application of new computational methods, we demonstrate that acceleration loggers can be used to remotely measure behavioral activity budgets of small-bodied species (Fig. 2).
MATERIALS AND METHODS
Animal Care and Use Committees at the Universities of California, Berkeley and Santa Barbara approved all procedures; methods followed American Society of Mammalogists guidelines (Sikes and Gannon, 2011).
Accelerometers
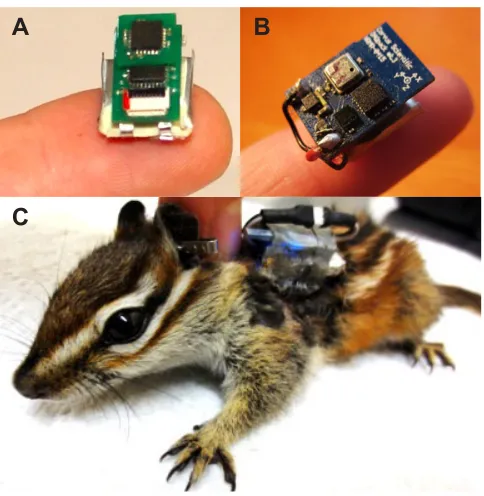
Transmitting accelerometers deployed in the lab (Fig. 3A,C; similar to Lopes et al.,2014) weighed∼1.5 g and took constant readings at Received 15 December 2015; Accepted 9 March 2016
1
Department of Integrative Biology, 1001 Valley Life Sciences Building, University
of California Berkeley, Berkeley, CA 94720-3160, USA.2Museum of Vertebrate
Zoology, 3101 Valley Life Sciences Building, University of California Berkeley,
Berkeley, CA 94720-3160, USA.3Language Technologies Institute, 5000 Forbes
Ave., Carnegie Mellon University, Pittsburgh, PA 15213, USA.
*Author for correspondence ([email protected])
Journal
of
Experimental
200 Hz. For machine learning, data were down-sampled to 20 Hz per axis, the lowest sampling frequency that resulted in negligible decreases in machine-learning accuracy.
Logging accelerometers, made of similar parts, were deployed in the field (Fig. 3B). Devices weighed ∼1.5–2.5 g (depending on battery; mass includes battery and weather proofing) and were composed of an ATtiny13 microcontroller (Atmel Corp., San Jose, CA, USA), an MPU-9250 6-axis inertial measurement unit (Invensense, San Jose, CA, USA), MR25H40 magnetoresistive memory (Everspin, Chandler, AZ, USA) and a lithium-polymer battery (Powerstream, Orem, UT, USA). Including housing, tags represented ∼3.5–5% of the study species’ body mass. Devices were programmed to record only tri-axial acceleration at 20 Hz per axis for 10 s, with 15 min between each 10 s sample. This regime allowed for∼4.5 days of data to be collected before the memory was filled; because we expected to re-capture animals after 2–5 days (based on glue longevity), this allowed data collection throughout the anticipated sampling period.
Captive studies
Both chipmunk species were live-trapped in Inyo National Forest, CA, USA, transported to the Sierra Nevada Aquatic Research Laboratory (Mammoth Lakes, CA, USA), and housed as described in Hammond et al. (2015).
For each trial, a transmitting accelerometer was glued (Duo Eyelash Adhesive, American International Industries, Commerce, CA, USA) to the focal animal and activated at the same time as a camera used to film the subject’s behavior. Each study animal was placed in an opaque, Plexiglas arena (∼9×61×61 cm), with aspen shavings, large rocks, sticks, food and water. A secondary, runway arena (244×30×30 cm) made of polypropylene lined with mesh flooring for traction was used to capture longer distance running behaviors. Animals were filmed in arenas while accelerometers transmitted data. Approximately 28 h of synchronous accelerometer
and video data were collected from 7T. alpinus(3 females, 4 males) and 11 T. speciosus (7 females, 4 males). Videos were scored according to an ethogram (Table 1). Behavioral scores were time matched to accelerometer readings to generate annotated acceleration datasets.
Feature extraction
We extracted several feature types from each behavioral segment (see ‘Hidden semi-Markov model’, below, for definition of segment). We extracted mean, variance, minimum and maximum from both the actual and the absolute values of each of the three accelerometer axes
Species mass (kg) Accelerometer mass (g)
1000
100
10
0
0.1 1 10 100 1000 10,000 100,000
Species mass (kg)
No. of studies
Accelerometer mass (g)
15
10
5
0
B
A
C
0 10
15
10
5
0
100
1000 100,000
[image:2.612.128.485.59.240.2]0.1 10
[image:2.612.313.563.519.699.2]Fig. 1. Plot and histograms of focal species and accelerometer mass in previous behavioral studies employing accelerometers.Non-exhaustive literature searches using Web of Science [search terms: TOPIC: (accelerometer animal behavior) AND TOPIC: (wild OR field OR“free living”)] and Google Scholar [accelerometer AND“animal behavior”AND (wild OR field OR“free ranging”OR“free roaming”OR“free living”)−dairy−cattle–cow] were conducted. Studies on domesticated animals and captive/trained animals housed in non-naturalistic environments were excluded. Where possible, species mass provided in each paper was used; otherwise, values from Animal Diversity Web (https://animaldiversity.ummz.umich.edu/) and peer-reviewed publications were used. Accelerometer mass listed in the paper was used when available; otherwise, if make and model were provided, we located mass online if possible. In cases where the device mass included the weight of GPS or VHF technology, we did not include that study in A and B. Studies that included >1 accelerometer model or species are shown a corresponding number of times. (A) Relationship between species and accelerometer mass in selected literature (N=61 papers). (B) Histogram showing the distribution of accelerometer mass in selected literature (N=61 papers). (C) Histogram showing the distribution of focal species mass in studies employing accelerometers (N=104 papers). Species/accelerometers from this study are indicated by filled circles/bars. Note the log scale for thex-axis in A–C and they-axis in A.
Table 1. Behavioral categories
Behavior 5 4 3 2
Sitting
Standing Still (N=2348, 12.6) Lying
Walking
Not still Running
Locomotion (N=6364, 3.24) Jumping
Climbing Moving in place Nesting Scratching
In-place movement (N=3081, 8.5) Drinking
Digging Rubbing
Eating Eating (N=199, 0.93) Grooming Grooming (N=515, 2.72)
Manually scored behavioral labels (left column) were collapsed into two, three, four or five broad behavioral categories for the machine-learning training. Sample size (number of instances, number of hours) for each
behavior is listed.
Journal
of
Experimental
(separately for each axis), and from the sequence of magnitudes of the vector of all three acceleration axes (together). We extracted covariance features for each pair of axes. From the sequence of acceleration vector magnitudes, we also extracted spectral features derived from the lowest eight components of an averaged sliding Fourier magnitude spectrum with a window size of 16 frames.
Hidden semi-Markov model
To map behaviors to accelerometer output, we used a hidden semi-Markov model (HSMM; Levinson, 1986; Jelinek, 1998), a structured predictor that jointly scores entire sequences of
behavioral labels and segmentations. The HSMM uses
additional features identifying transitions between and lengths of individual behaviors. It is a structured extension of the support vector machine (SVM), capable of learning longer range correlations. Let x be the full sequence of input accelerometer frames and let xt:rbe the segment of frames between timestand r. Let y=[(l1,t1,r1),(l2,t2,r2),…] be a behavioral labeling of x where li denotes the label of the ith segment, while ti and ri denote the start and end frames of the ith segment, respectively. The predicted behavioral labeling under our model is:
^yðxÞ ¼argmaxy[YðxÞ½score(y;x;wÞ: ð1Þ
Y(x) denotes the set of all possible valid segmentations and labeling of x. The score our model assigns to each possible labeling is parameterized byw, a vector of weights, written as:
Scoreðy;x;wÞ ¼ X sizeðyÞ
i¼1 wTfðl
i;xti:riÞ ! zfflfflfflfflfflfflfflfflfflfflfflfflfflfflfflfflffl}|fflfflfflfflfflfflfflfflfflfflfflfflfflfflfflfflffl{Segment features
þ X
sizeðyÞ 1
i¼1 wTgðl
i;liþ1Þ
! zfflfflfflfflfflfflfflfflfflfflfflfflfflfflfflfflfflfflffl}|fflfflfflfflfflfflfflfflfflfflfflfflfflfflfflfflfflfflffl{Transition features :
ð2Þ
The model score decomposes into two types of potential function that score (1) individual labels assigned to individual segments or (2) transitions between neighboring labels. Each potential is a sum of weighted features. The segment feature function,f, characterizes segments of the input paired with a particular label. This differs from a Markov model, which only incorporates features on individual frames. The transition feature function, g, captures sequential dependences between behavioral labels.
Training a structured predictor involves choosing parameterwto optimize the value of a learning objective on training data. We used a structured SVM objective (Taskar et al., 2005; Tsochantaridis et al., 2004) optimized with stochastic subgradient descent (Kummerfeld et al., 2015). Our implementation used a structured prediction library (Kummerfeld et al., 2015) available at https:// github.com/tberg12/murphy.git; all models evaluated here were built on this framework (available upon request). Training was relatively fast, with the most complex model training in <15 min.
Compared predictive models
We developed two additional systems as points of comparison for the HSSM. The first was an SVM, a machine-learning method that has been used in past behavioral studies (e.g. Nathan et al.,2012; Campbell et al., 2013). With this classifier, we predicted behaviors by dividing the accelerometer output into a series of 4 s fixed
B
A
[image:3.612.318.560.55.303.2]C
Fig. 3. Transmitting and logging accelerometers.(A) Transmitting accelerometer used in captive studies. (B) Logging accelerometer used in field studies. (C) CaptiveTamias speciosuswearing an accelerometer.
Acceleration
Time
x
y
z
Eat Run Still
Accele
ra
tio
n
x
y
z
Unlabeled data
In-place movement
Loco- motion Still Field
activity budget Repeat (cross- validate) Feature extraction
• Summary statistics • Spectral features
Train Machine learning on random sample
Test Predict for
non-overlapping random sample
Calculate system accuracy
Validated machine learning system Labeled
data
Generate labels Lab validation
[image:3.612.52.299.55.325.2]Field deployment
Fig. 2. Flow-chart of the successful method for validating and applying accelerometers.Captive animals were filmed while they were wearing accelerometers. After manually scoring film footage with behaviors, accelerometer and behavioral datasets were linked to generate labeled accelerometer data from which features (summary statistics, spectral features, etc.) were extracted. Machine learning was trained on features for all individuals except one, and then was tested on that individual. Accuracy was calculated for that individual, and then the procedure was repeated for all individuals and an average accuracy was calculated. Once a suitably accurate system was generated, it was applied to unlabeled accelerometer data collected from unobserved wild animals to generate automatically labeled behavioral activity budgets.
Journal
of
Experimental
segments and making independent behavioral classifications for each segment. The second, a baseline system, was a method that checks whether the mean acceleration norm is above a pre-defined threshold in each segment of the input signal. We set the thresholds on the training data in order to maximize training accuracy using a grid search procedure.
Hyper-parameters for all models were tuned by grid search to maximize accuracy on a held-out set consisting of all trials from a single experimental animal (e.g. SVM segment size was set to maximize held-out accuracy). Data for this animal were not included in the final evaluation.
Automated system assessment
For consistency between the baseline models, which use pre-defined segments, and the HSMM, which predicts variably sized segments, all predicted behavioral labels were evaluated at frame level. Specifically, manual video annotation was used to assign a correct label to each acceleration frame (a singlex,yandzrecord from the accelerometer). The labels for our model were used to assign predicted labels to individual frames. Precision and recall metrics were computed by comparing the sequence of correct to predicted frame labels.
Cross-validation was used to determine system accuracy. To do this, we withheld data for one individual from the training data set, completed system training, then calculated the accuracy of the interpretation of the removed individual’s data by the resulting system. We repeated this process for all individuals and averaged the results, weighted by the quantity of data per individual. This procedure controlled for over-fitting the machine learning to individual-specific behaviors and thus prevented inflated accuracies. Precision and recall were calculated for each behavioral category.
Field deployment data analysis
For field deployment, 30 logging accelerometers (T. alpinus N=15, T. speciosus N=15) were glued (Blink Ultra-Plus Lash Glue, Seoul, Korea) to animals in Yosemite National Park, CA, USA (37.845041, −119.494957) between 11 and 19 July and 29 September and 3 October 2015. To increase the chances of recovery, accelerometers were attached to individuals that had already been captured and released at least twice. Twenty functional accelerometers were recovered via re-trapping (T. alpinus N=4 females/1 male summer, N=3 females/1 male autumn; T. speciosus N=5 females/2 males
summer, N=1 female/3 males autumn). On average, T. alpinus individuals weighed 38±4.8 g andT. speciosus56±8.0 g.
The three-label HSMM system was applied to field data and non-parametric, two-tailed tests were used to assess data for diurnality, seasonality and interspecific differences in activity budgets.
RESULTS AND DISCUSSION
Validation study and machine learning
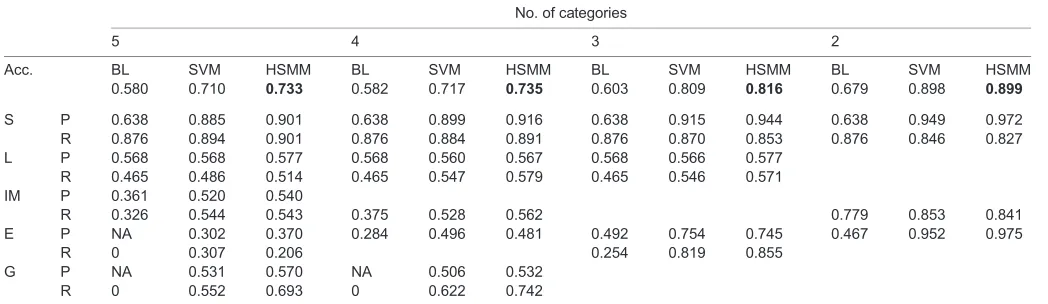
Behaviors were collapsed into 2–5 categories (Table 1). The system performed equally well for both species; thus, we pooled data for training and testing. In general the HSMM performed best, followed closely by the SVM and then the baseline optimum-threshold system (Table 2).
Field deployment
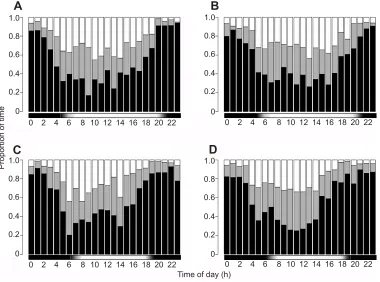
[image:4.612.46.570.70.222.2]On average, field-deployed accelerometers collected data from T. alpinusfor 58.3±17.0 h per individual, and fromT. speciosusfor 51.1±17.8 h per individual. Animals spent a significantly greater proportion of time active (not‘still’) during the day than the night, confirming diurnality (T. alpinus: 0.57±0.11 day, 0.24±0.06 night; T. speciosus: 0.59±0.09 day, 0.26±0.06 night; paired Wilcoxon signed rank test, T. alpinus V=45, P=0.004; T. speciosus V=66, P=0.0005; Fig. 4). The length of the active period decreased from summer to autumn (T. alpinus: 13.20±1.09 h summer, 10.75±2.63 h autumn; T. speciosus: 13.14±1.46 h summer, 10.25±2.88 h autumn); this difference was significant when data from the two species were combined for analysis (Wilcoxon rank sum test,W=82,P=0.0083) and was mainly driven by a pattern of earlier termination of activity. Animals spent a higher proportion of time in locomotion during summer than autumn (T. alpinus: 0.23±0.04 summer, 0.17±0.04 autumn; T. speciosus: 0.22±0.05 summer, 0.17±0.04 autumn); this difference was significant when the two species were combined for analyses (Wilcoxon rank sum test,W=80,P=0.012). This was true not only when averaged across all hours but also for exclusively daylight hours (T. alpinus: 0.32±0.07 summer, 0.25±0.06 autumn; T. speciosus: 0.30±0.05 summer, 0.24±0.07 autumn; Wilcoxon rank sum test, W=74, P=0.047), suggesting that animals were spending less time active per hour of daylight. All P-values were still significant when corrected for multiple testing using false discovery rate adjustments. There were no significant interspecific differences in the overall average proportion of time spent active (Wilcoxon rank sum tests, allP>0.88). BothT. speciosusand T. alpinusshowed patterns of Table 2. Accuracy, precision and recall for baseline versus machine-learning systems
No. of categories
5 4 3 2
Acc. BL SVM HSMM BL SVM HSMM BL SVM HSMM BL SVM HSMM
0.580 0.710 0.733 0.582 0.717 0.735 0.603 0.809 0.816 0.679 0.898 0.899
S P 0.638 0.885 0.901 0.638 0.899 0.916 0.638 0.915 0.944 0.638 0.949 0.972
R 0.876 0.894 0.901 0.876 0.884 0.891 0.876 0.870 0.853 0.876 0.846 0.827
L P 0.568 0.568 0.577 0.568 0.560 0.567 0.568 0.566 0.577
R 0.465 0.486 0.514 0.465 0.547 0.579 0.465 0.546 0.571
IM P 0.361 0.520 0.540
R 0.326 0.544 0.543 0.375 0.528 0.562 0.779 0.853 0.841
E P NA 0.302 0.370 0.284 0.496 0.481 0.492 0.754 0.745 0.467 0.952 0.975
R 0 0.307 0.206 0.254 0.819 0.855
G P NA 0.531 0.570 NA 0.506 0.532
R 0 0.552 0.693 0 0.622 0.742
Overall accuracy (Acc.) for optimum-threshold baseline (BL), support vector machine (SVM) and hidden semi-Markov model (HSMM) systems with 2–5 behavioral categories is presented in the first row, with values for the best performing system in bold. For each system, precision (P) and recall (R) are presented for the selected behavioral categories (S, still; L, locomotion; IM, in-place movement; E, eating; G, grooming).
Journal
of
Experimental
spending more time active at midday (11:00–14:00 h) than in the morning/late-afternoon (07:00–10:00 h, 15:00–18:00 h), but this comparison was only significant for T. speciosus in autumn (Wilcoxon rank sum test, W=60, P=0.03). Interspecific comparisons of these time of day-specific and season-specific activity levels did not reveal any significant differences (Wilcoxon rank sum tests, allP>0.49), though visual inspection of the data did suggest a potential pattern of interspecific differences in autumn, whenT. alpinusshowed brief activity peaks around 06:00 h and 14:00 h in contrast to T. speciosus, which had higher inactivity around 06:00 h and peak activity at midday.
Discussion
Using newly developed, low-mass, data-logging accelerometers in combination with advanced machine-learning techniques, we have shown that successful accelerometer deployment is possible for small-bodied, free-living animals. We have also provided the first quantitative descriptions of activity budgets in the focal species. While the data did not support our hypothesis that, in contrast toT. speciosus,T. alpinuswould spend more time active in the morning and late afternoon than at midday, when temperatures are higher, visual inspection of activity rhythms does suggest the possibility of more fine-scale interspecific differences, and future studies with larger sample sizes can explore the impacts of various environmental variables on activity budgets in these species.
Validation techniques
Conducting a validation study is a critical first step for using accelerometers to collect data on the activity budgets of free-living animals. Validation studies should collect time-matched, paired
datasets consisting of behavioral observations and accelerometer readings. A variety of methods can determine whether accelerometer data are reliably correlated with behaviors, some of which are being developed for general use (Gao et al., 2013; Resheff et al., 2014; Sakamoto et al., 2009). In some cases where an independent captive study is not possible, animals may be observed in zoos or in the wild, or surrogate species may be used (Campbell et al., 2013; Grünewälder et al., 2012; Nathan et al., 2012; Wang et al., 2015). Additionally, we assessed the accuracy of our system using a cross-validation method, which generated a system that was robust to individual differences in behavior.
Machine learning and assessment
While the HSMM did improve system performance, the enhancement was modest. However, it is possible that integrating adaptive segment length and sequential correlations – properties unique to the HSMM – into future automated accelerometer interpretation models could be useful in other study systems, particularly when constant recording is possible.
All systems were most inaccurate at identifying locomotion. This could be due to the short time scale of locomotory behaviors, particularly in captivity: average locomotory behaviors were approximately 1.8 s, versus 7.2 s for in-place movement and 18 s for still. This may have made it difficult to perfectly identify start and end times for locomotion. This will likely be a general challenge for using accelerometers to remotely identify behaviors of small animals, which have less inertia, meaning they can accelerate more quickly (Randall et al., 2002) and are able to start and complete behaviors on shorter time scales than larger animals. Using high-speed video and/or recording data in larger arenas during validation studies could help ameliorate this problem.
Time of day (h) 1.0
0.8
0.6
0.4
0.2
0 1.0
0.8
0.6
0.4
0.2
0
1.0
0.8
0.6
0.4
0.2
0 1.0
0.8
0.6
0.4
0.2
0
Proportion of time
A
B
C
D
0 2 4 6 8 10 12 1416 18 20 22 0 2 4 6 8 10 12 14 16 18 20 22 0 2 4 6 8 10 12 1416 18 20 22
[image:5.612.112.492.59.341.2]0 2 4 6 8 10 12 1416 18 20 22
Fig. 4. Three-category hidden semi-Markov model (HSMM)-labeled activity budgets for wild chipmunks in summer and autumn.The mean percentage time spent on each behavioral category according to the three-category HSMM (black: still, gray: in-place movement, white: locomotion), averaged across individuals, is plotted against time forTamias alpinusin (A) summer (N=5) and (C) autumn (N=4), andT. speciosusin (B) summer (N=7) and (D) autumn (N=4). Horizontal bars indicate the approximate light:dark cycle.
Journal
of
Experimental
Limitations and future directions
The methods described here are promising, but come with some limitations. First, battery life is an issue when studying small animals because of the limitations on weight; consequently, non-continuous recording may be necessary. Our field-recording regime was conservative but, with enough animals, sufficient for generating meaningful activity budgets. Future studies can employ adaptive programming, including logging only when movement is initiated or during specific times of interest. Second, wearing an accelerometer may alter animal behavior. Although we limited accelerometers to <5% of body mass, future studies should examine impacts of this weight. Third, our attachment method (glue-on) and data-acquisition strategy (non-transmitting) limited weight but required individuals to be recaptured relatively quickly; future work could explore the feasibility of low-weight collar or harness attachments.
Accelerometers offer important improvements over more traditional methods of monitoring animal activity, particularly for small-bodied or cryptic species that are difficult to observe directly. This technology makes data collection more efficient and machine learning can facilitate the accurate interpretation of accelerometer output. Understanding how behavior varies with season and climate could be informative for predicting and understanding responses to climate change, which is relevant to the focal species (Moritz et al., 2008). Although improvements to this technology will no doubt be forthcoming, use of accelerometers has the potential to generate numerous novel insights into the biology of small-bodied animals.
Acknowledgements
We thank the hardworking field assistants who contributed to this study; E. A. Lacey, J. S. Brashares and R. L. Caldwell for guidance in study design; and E. A. Lacey and three anonymous reviewers for valuable comments on the manuscript.
Competing interests
The authors declare no competing or financial interests.
Author contributions
D.S. designed the accelerometers. T.T.H. designed and executed the study with help from R.E.W. T.B.-K. implemented machine learning. T.T.H. prepared the manuscript with input from all authors.
Funding
National Science Foundation GRFP to T.B. and T.T.H. National Science Foundation DDIG, Valentine Eastern Sierra Reserve, American Museum of Natural History, American Society of Mammalogists, and UC Berkeley Museum of Vertebrate Zoology to T.T.H. Berkeley Initiative in Global Change Biology and Gordon and Betty Moore Foundation to R.E.W.
References
Bahnak, B. R. and Kramm, K. R. (1977). The influence of environmental temperature and photoperiod on activity in the red squirrel, Tamiasciurus hudsonicus.Int. J. Biometeorol.21, 348-356.
Bidder, O. R., Campbell, H. A., Gómez-Laich, A., Urgé, P., Walker, J., Cai, Y., Gao, L., Quintana, F. and Wilson, R. P.(2014). Love thy neighbour: automatic animal behavioural classification of acceleration data using the k-nearest neighbour algorithm.PLoS ONE9, e88609.
Brown, D. D., Kays, R., Wikelski, M., Wilson, R. and Klimley, A. P.(2013). Observing the unwatchable through acceleration logging of animal behavior.
Anim. Biotelem.1, 20.
Campbell, H. A., Gao, L., Bidder, O. R., Hunter, J. and Franklin, C. E.(2013). Creating a behavioural classification module for acceleration data: using a captive surrogate for difficult to observe species.J. Exp. Biol.216, 4501-4506.
Carroll, G., Slip, D., Jonsen, I. and Harcourt, R.(2014). Supervised accelerometry analysis can identify prey capture by penguins at sea. J. Exp. Biol. 217, 4295-4302.
Davis, R. W., Fuiman, L. A., Williams, T. M., Collier, S. O., Hagey, W. P., Kanatous, S. B., Kohin, S. and Horning, M.(1999). Hunting behavior of a marine mammal beneath the Antarctic fast ice.Science283, 993-996.
Escalante, H. J., Rodriguez, S. V., Cordero, J., Kristensen, A. R. and Cornou, C.
(2013). Sow-activity classification from acceleration patterns: a machine learning approach.Comput. Electron. Agric.93, 17-26.
Gao, L., Campbell, H. A., Bidder, O. R. and Hunter, J.(2013). A Web-based semantic tagging and activity recognition system for species’accelerometry data.
Ecol. Inform.13, 47-56.
Grünewälder, S., Broekhuis, F., Macdonald, D. W., Wilson, A. M., McNutt, J. W., Shawe-Taylor, J. and Hailes, S.(2012). Movement activity based classification of animal behaviour with an application to data from cheetah (Acinonyx jubatus).
PLoS ONE7, e49120.
Hammond, T. T., Palme, R. and Lacey, E. A.(2015). Contrasting stress responses of two co-occurring chipmunk species (Tamias alpinus and T. speciosus).Gen.
Comp. Endocrinol.211, 114-122.
Heller, H. C. and Poulson, T.(1972). Altitudinal zonation of chipmunks (Eutamias): adaptations to aridity and high temperature.Am. Midl. Nat.87, 296-313.
Jelinek, F.(1998).Statistical Methods for Speech Recognition. Cambridge, MA: MIT press.
Kays, R., Crofoot, M. C., Jetz, W. and Wikelski, M.(2015). Terrestrial animal tracking as an eye on life and planet.Science348, aaa2478.
Kramm, K. R. and Kramm, D. A.(1980). Photoperiodic control of circadian activity rhythms in diurnal rodents.Intl. J. Biometeorol.24, 65-76.
Kummerfeld, J. K., Berg-Kirkpatrick, T., Klein, D.(2015). An empirical analysis of optimization for max-margin nlp.Proceedings of the Conference on Empirical
Methods in Natural Language Processing, 273-279.
Lagarde, F., Guillon, M., Dubroca, L., Bonnet, X., Ben Kaddour, K., Slimani, T. and El mouden, E.H.(2008). Slowness and acceleration: a new method to quantify the activity budget of chelonians.Anim. Behav.75, 319-329.
Levinson, S.(1986). Continuously variable duration hidden Markov models for automatic speech recognition.Comp. Speech Lang.1, 29-45.
Lopes, P. C., Springthorpe, D. and Bentley, G. E.(2014). Increased activity correlates with reduced ability to mount immune defenses to endotoxin in zebra finches.J. Exp. Zool. A Ecol. Genet. Physiol.321, 422-431.
Martiskainen, P., Järvinen, M., Skön, J.-P., Tiirikainen, J., Kolehmainen, M. and Mononen, J. (2009). Cow behaviour pattern recognition using a three-dimensional accelerometer and support vector machines.Appl. Anim. Behav. Sci.119, 32-38.
McClune, D. W., Marks, N. J., Wilson, R. P., Houghton, J. D. R., Montgomery, I. W., McGowan, N. E., Gormley, E. and Scantlebury, M.(2014). Tri-axial accelerometers quantify behaviour in the Eurasian badger (Meles meles): towards an automated interpretation of field data.Anim. Biotelem.2, 5.
Moritz, C., Patton, J. L., Conroy, C. J., Parra, J. L., White, G. C. and Beissinger, S. R. (2008). Impact of a century of climate change on small-mammal communities in Yosemite National Park, USA.Science322, 261-264.
Nakamura, I., Goto, Y. and Sato, K.(2015). Ocean sunfish rewarm at the surface after deep excursions to forage for siphonophores.J. Anim. Ecol.84, 590-603.
Nathan, R., Spiegel, O., Fortmann-Roe, S., Harel, R., Wikelski, M. and Getz, W. M.(2012). Using tri-axial acceleration data to identify behavioral modes of free-ranging animals: general concepts and tools illustrated for griffon vultures.J. Exp. Biol.215, 986-996.
Randall, D., Burggren, W. W., French, K. and Eckert, R.(2002).Eckert Animal
Physiology: Mechanisms and Adaptations. New York, USA: W.H. Freeman.
Resheff, Y. S., Rotics, S., Harel, R., Spiegel, O. and Nathan, R. (2014). AcceleRater: a web application for supervised learning of behavioral modes from acceleration measurements.Mov. Ecol.2, 27.
Rubidge, E. R., Monahan, W. B., Parra, J. L., Cameron, S. E. and Brashares, J. S.
(2010). The role of climate, habitat, and species co-occurrence as drivers of change in small mammal distributions over the past century.Glob. Change Biol. 17, 696-708.
Sakamoto, K. Q., Sato, K., Ishizuka, M., Watanuki, Y., Takahashi, A., Daunt, F. and Wanless, S.(2009). Can ethograms be automatically generated using body acceleration data from free-ranging birds?PLoS ONE4, e5379.
Shamoun-Baranes, J., Bom, R., van Loon, E. E., Ens, B. J., Oosterbeek, K. and Bouten, W.(2012). From sensor data to animal behaviour: an oystercatcher example.PLoS ONE7, e37997.
Sih, A., Ferrari, M. C. O. and Harris, D. J.(2011). Evolution and behavioural responses to human-induced rapid environmental change.Evol. Appl.4, 367-387.
Sikes, R. S. and Gannon, W. L.(2011). Guidelines of the American Society of Mammalogists for the use of wild mammals in research.J. Mammal.92, 235-253.
Taskar, B., Chatalbashev, V., Koller, D. and Guestrin, C. (2005). Learning structured prediction models: A large margin approach.Proceedings of the 22nd
International Conference on Machine learning, 896-903.
Tsochantaridis, I., Hofmann, T., Joachims, T. and Altun, Y.(2004). Support vector machine learning for interdependent and structured output spaces.
Proceedings of the 21st International Conference on Machine learning, 104.
Wang, Y., Nickel, B., Rutishauser, M., Bryce, C. M., Williams, T. M., Elkaim, G. and Wilmers, C. C.(2015). Movement, resting, and attack behaviors of wild pumas are revealed by tri-axial accelerometer measurements.Mov. Ecol.3, 2.
Wauters, L., Swinnen, C. and Dhondt, A. A.(1992). Activity budget and foraging behaviour of red squirrels (Sciurus vulgaris) in coniferous and deciduous habitats.
J. Zool.227, 71-86.
Journal
of
Experimental
Weimerskirch, H., Le Corre, M., Ropert-Coudert, Y., Kato, A. and Marsac, F.
(2005). The three-dimensional flight of red-footed boobies: adaptations to foraging in a tropical environment?Proc. R. Soc. B Biol. Sci.272, 53-61.
Wilmers, C. C., Nickel, B., Bryce, C. M., Smith, J. A., Wheat, R. E. and Yovovich, V. (2015). The golden age of bio-logging: how animal-borne sensors are advancing the frontiers of ecology.Ecology96, 1741-1753.