Original Article
Association of common variants of FTO in women with
polycystic ovary syndrome
Hongxi Xue1,2,3,4, Han Zhao1,3,4, Yueran Zhao1,3,4, Xin Liu1,3,4, Zijiang Chen1,3,4, Jinlong Ma1,3,4
1Center for Reproductive Medicine, Shandong Provincial Hospital Affiliated to Shandong University, Shandong
Provincial Key Laboratory of Reproductive Medicine, Jinan, China; 2Department of Reproductive Medicine, Rizhao
City Hospital of Traditional Chinese Medicine, Rizhao, China; 3National Research Center for Assisted
Reproduc-tive Technology and ReproducReproduc-tive Genetics, Jinan, China; 4The Key Laboratory for Reproductive Endocrinology of
Ministry of Education, Jinan, China
Received August 30, 2015; Accepted September 28, 2015; Epub October 1, 2015; Published October 15, 2015
Abstract: Background: Polycystic ovary syndrome (PCOS) is a common and complex multisystemic genetic disease. Previous genome-wide association study (GWAS) of PCOS has found several potentially causative single nucleotide polymorphisms (SNPs) in Han Chinese population. The goal of present investigation was to assess the potential association between rs1121980, rs1421085, rs1558902, rs8050136 SNPs and PCOS. In order to make a better elucidation of this disease, further investigations of association between SNPs susceptibility and PCOS become necessary. Methods: In the present study, we enrolled 212 patients with PCOS and 198 control subjects. Four polymorphisms of FTO gene (rs1121980, rs1421085, rs1558902, rs8050136) were genotyped by Taqman-MGB
method, and their relationship with PCOS was speculated. Results: The allele frequency has no significant differ -ence between the PCOS group and the controls. Genotype frequencies of the four SNPs in the additive, dominant
and recessive models showed no significant difference between PCOS cases and controls. Conclusions: Our results
demonstrate that FTO gene has little association in PCOS development.
Keywords: FTO, genome-wide association study (GWAS), polycystic ovary syndrome (PCOS)
Introduction
Polycystic ovary syndrome (PCOS) is the most frequent heterogeneous endocrine-metabolic disorder in women of reproductive age, with a prevalence of 5-10% of Chinese women aged 19~45 years [1]. The clinical manifestations of PCOS are diverse, characterized by menstrual irregularities, infertility, acne, anovulation and
hirsutism, which can lead to a significant
decrease in quality of life, mood disorders and sexual dysfunction [2, 3]. Affected PCOS patients are also at higher risk of developing various clinical implications, including type 2 diabetes mellitus (T2DM), cardiovascular dis-ease (e.g. obesity, insulin resistance and ath-erosclerosis), endometrial carcinoma. Familial aggregation analysis and clinical traits demon-strate the pathogenesis of PCOS is associated with multiple genetic and environmental fac-tors [4]. It is widely accepted that the etiology of PCOS is strongly heritable, and genetic
approaches are rapidly uncovering new regions of the genome that appear to confer risk for PCOS. Recent genome-wide association study
(GWAS) identified several genetic loci that were
Materials and methods
Subjects
A total of 212 PCOS cases and 198 unrelated controls of Han Chinese women were recruited consecutively during May 2006 to February
2007 from Reproductive Hospital Affiliated to
Shandong University. PCOS cases patients were 23 to 43 years old, with an average age of 29.32 years old, and controls patients were 24 to 40 years old, with an average age of 31.43 years old. Recruitment of PCOS patients was based on European Society for Hu- man Reproduction and Embryology/American Society for Reproductive Medicine (ESHRE/ ASRM) diagnostic criteria [7], meeting at least two of the following three features: oligo and/or anovulation; clinical and/or biochemical hyper-androgenism; and the presence of 12 or more follicles with a diameter of 2~9 mm in either
side of the ovary, and/or total ovary volume ≥10
mL on ultra-sound. Patients with other diseas-es such as androgen-secreting tumor, congeni-tal adrenal hyperplasia and Cushing syndrome were excluded. The controls were healthy women exhibited regular menstrual cycles. The inclusion criteria for these participants include male factor (aspermia, hypospermia and asthe-nozoospermia), and participants with hyperan-drogenism and polycystic ovaries morphology were excluded. All individuals who were receiv-ing hormonotherapy durreceiv-ing last 3 months were excluded. The study has been approved by the Institutional Review Board of the Reproductive
Hospital Affiliated to Shandong University. All
the participant subjects of this study have given written informed consent the procedures of using their biological data and materials.
Sample collection, hormonal and biochemical measures
A blood test was performed on the 3rd-5th day of the menstrual cycle. For patients of without regular menstrual cycle and dominant follicle while receiving transvaginal ultrasound exami-nation, hormonal and biochemistry detection was performed after an overnight fast. Fasting blood samples of all subjects were collected during the follicular phase of one menstrual cycle. Body mass index (BMI) was calculated as body weight (kg) divided by body height squared (m2). Waist hip ratio (WHR) was calculated as hipline (cm) divided by waistline (cm). Serum
luteinizing hormone (LH), follicle stimulating hormone (FSH), testosterone (T), androstenedi-one (A) and insulin concentrations were deter-mined by chemiluminescence immunoassay (AU640 automatic biochemistry analyzer; Olympus Company, Hamburg, Germany). 75 g oral glucose tolerance test (OGTT) was carried out for PCOS patients. The glucose levels and insulin levels at 0 min and 120 min were evalu-ated. Glucose levels, total cholesterol (TC) and triglycerides (TG) were determined by oxidase methods. High-density lipoprotein (HDL-C) by synthetic polymer/detergent HDL-C assay and low-density lipoprotein (LDL-C) by surfactant LDL-C assay. The homeostasis model assess-ment (Homa-IR) method was applied to deter-mine insulin resistance according to the formu-la: fasting glucose (mmol/L)*fasting insulin (m IU/L)/22.5.
Genotyping
Genomic DNA was extracted from EDTA antico-agulated blood using the standard salting out
method (2). Taqman-MGB fluorescence quanti -tative polymerase chain reaction (PCR) were carried out on the Light Cycle system (Roche480) as followings: initial denaturation at 95°C for 10 min, followed by 40 cycles of denaturation at 95°C for 30 s, annealing at 56°C for 30 s, extension at 72°C for 40 s. The primer sequences of FTO were as follows:
rs1121980 forward: 5’-AACCAAAAGCCAGATA- AGGAGAC-3’; reverse: 5’-GGAAGGCACAATAAG- AGGAGAT-3’; rs1421085 forward: 5’-CAAAAG- CAGGAGATGACACACA-3’; reverse: 5’-GTAGAC- TAAACAGGGCTAAGGA-3’; rs1558902 forward: 5’-GTCTTGAGTTAGCTGAAGTTCTCTT-3’; reverse: 5’-TATCAAGTTAGGGTACGTTGCA-3’; rs8050136 forward: 5’-CAACCAAGGTCCTTATAGGAAGAGC- 3’; reverse: 5’-TGGTCATGTCTGATCTAGAGTAC- CC-3’. PCR products were analyzed using 2% agarose gel electrophoresis stained with ethid-ium bromide.
DNA sequencing
The FTO PCR products (212 PCOS cases and 198 unrelated controls) were sequenced in both directions. All were done by automatic genotype sequencing instrument (ABI Prism 3100-Avant) in Peking Huada Gene Company.
Statistical analysis
evaluate the relationship between each SNPs, pairwise linkage-disequilibrium (LD) (D9 and
correlation coefficients r2) were calculated by
Haploview. Chi-square test was used to com-pare allele frequencies of rs1121980, rs1421085, rs1558902 and rs8050136. Data was presented as odds ratio (OR) and 95%
con-fidence interval (95% CI). Genotypes of each
SNPs were analyzed by additive (+/+ vs. +/- vs. -/-), dominant (+/+ plus +/- vs. -/-) and recessive (+/+ vs. +/- plus -/-). Genotype-phenotype
cor-between rs1121980 and rs1421085 (D9 = 0.235, r2 = 0.037), rs1121980 and rs1558902 (D9 = 0.174, r2 = 0.126), rs1121980 and rs8050136 (D9 = 0.573, r2 = 0.405). rs1421085 and rs1558902 (D9 = 0.315, r2 = 0.059), rs1421085 and rs8050136 (D9 = 0.381, r2 = 0.533), rs1558902 and rs1558902 (D9 = 0.425, r2 = 0.276). The allele frequen-cies of rs1121980, rs1421085, rs1558902 and rs8050136 were shown in Table 2. In the PCOS group, allele frequency of rs1121980
has no statistically significance compared with
the control group (P = 0.324, OR = 0.985, 95% CI = 1.073-1.241), even adjustment for age and BMI (P = 0.582). Moreover, statistical differ-ence of allele frequency was not found in rs1421085 (P = 0.486, OR = 1.135, 95% CI = 0.861-1.109), rs1558902 (P = 0.127, OR = 1.248, 95% CI = 0.684-1.153) and rs8050136 (P = 0.249, OR = 1.217, 95% CI = 0.973-1.115). Genotype frequency of the four SNPs was fur-ther analyzed by chi-square test under additive, dominant and recessive models (Table 3). In
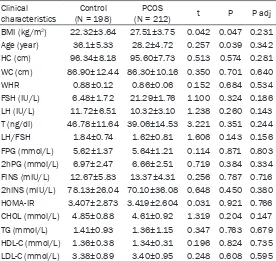
[image:3.612.92.368.83.344.2]the additive model, no significant difference Table 1. Clinical characteristics in PCOS cases and controls
Clinical
characteristics (N = 198)Control (N = 212)PCOS t P P adj BMI (kg/m2) 22.32±3.64 27.51±3.75 0.042 0.047 0.231
Age (year) 36.1±5.33 28.2±4.72 0.257 0.039 0.342 HC (cm) 96.34±8.18 95.60±7.73 0.513 0.574 0.281 WC (cm) 86.90±12.44 86.30±10.16 0.350 0.701 0.640 WHR 0.88±0.12 0.86±0.06 0.152 0.684 0.534 FSH (IU/L) 6.48±1.72 21.29±1.76 1.100 0.324 0.186 LH (IU/L) 11.72±6.51 10.32±3.10 1.238 0.260 0.143 T (ng/dl) 46.78±11.64 39.06±14.53 3.221 0.351 0.244 LH/FSH 1.84±0.74 1.62±0.81 1.606 0.143 0.156 FPG (mmol/L) 5.62±1.37 5.64±1.21 0.114 0.871 0.803 2hPG (mmol/L) 6.97±2.47 6.66±2.51 0.719 0.384 0.334 FINS (mIU/L) 12.67±5.83 13.37±4.31 0.256 0.787 0.716 2hINS (mIU/L) 78.13±26.04 70.10±36.08 0.648 0.450 0.380 HOMA-IR 3.407±2.873 3.419±2.604 0.031 0.921 0.766 CHOL (mmol/L) 4.85±0.88 4.61±0.92 1.319 0.204 0.147 TG (mmol/L) 1.41±0.93 1.36±1.15 0.347 0.763 0.679 HDL-C (mmol/L) 1.36±0.38 1.34±0.31 0.196 0.824 0.735 LDL-C (mmol/L) 3.38±0.89 3.40±0.95 0.248 0.608 0.595
Independent student’s t test and Mann-Whitney U-test; Data are expressed as mean ± SD; PCOS: Polycystic ovary syndrome; BMI: body mass index; FSH: follicle-stimulating hormone; LH: luteinizing hormone; T: testosterone; CHOL: total cholesterol; TG: triglycerides; HDL-C: High-density lipoprotein cholesterol; LDL-C: low-density lipoprotein cholesterol. P adj: P value after age and BMI adjustment in logistic regression.
Table 2. Allele frequencies in PCOS cases and controls
SNPs Allele PCOS Control OR P rs1121980 T/C 74/350 70/326 0.985 0.324 rs1421085 C/T 52/376 43/353 1.135 0.486 rs1558902 A/T 61/363 47/349 1.248 0.127 rs8050136 A/C 56/368 44/352 1.217 0.249
OR: odds ratio. PCOS, Polycystic ovary syndrome; Allele, the data of rs1121980, rs1421085, rs1558902 and rs8050136 are presented as T/C, C/T, A/T and A/C, Adjust-ment study, adjusted by body mass index in logistic
regres-sion. 95% CI, 95% Confidence Interval.
relation of PCOS was analyzed by independent sample T test. In phenotype analysis, Chi-square test, independent T test were analyzed, and logistic regression analysis used for age and BMI adjustment by SPSS17.0 software (SPSS Inc., Chicago, IL, USA). Statistic
sig-nificant level was defined as
P<0.05. Results
[image:3.612.91.297.450.519.2]was found in rs1121980 (P = 0.990), rs1421085 (P = 0.560), rs1558902 (P = 0.487) and rs8050136 (P = 0.489). In dominant
model, no significant difference was found in all
four SNPs rs1121980 (P = 0.746), rs1421085 (P = 0.521), rs1558902 (P = 0.436) and rs8050136 (P = 0.371). Moreover, there was
also no significant difference in recessive
model. Discussion
Recent replication analyses and genome-wide association studies reported that FTO gene variants have an association with PCOS, mostly
in Asians [8]. In the present study, we identified
the common FTO SNPs rs1121980, rs1421085, rs1558902 and rs8050136 have no associa-tion with PCOS in a cohort of Women from Shandong Province. Furthermore, Allele fre-quencies and genotype frefre-quencies of the four
FTO SNPs showed no significant difference in
PCOS cased and controls, indicating that FTO SNPs rs1121980, rs1421085, rs1558902 and rs8050136 were not candidates in PCOS devel-opment. Moreover, the risk alleles of FTO SNPs (rs1121980, rs1421085, rs1558902, rs805- 0136) was associated with testosterone. Whereas, no correlation was found to the other clinical characteristics.
Bioinformatics analysis have uncovered that FTO is one of the members of the AlkB family of non-heme Fe (II)/2-OG-dependent oxidative DNA/RNA demethylases [9]. FTO may partici-pates in CREB signaling pathway through
inter-acting with CaMKII and finally evokes NPY,
which resulting in regulation of food intake and energy homeostasis by acting through NPY1R and BDNF.
CaMKII, a serine/threonine protein kinase
fam-opment, proliferation, transport, neuronal func-tion and so on [12-14]. CaMKII has also been demonstrated to regulate hepatic glucose homeostasis in obesity [15].
Acknowledgements
This research was supported by the National Basic Research Program of China (973 pro-gram) (2012CB944700 and 2011CB944502), the Science Research Foundation Item of No-Earnings Health Vocation (201002013). We also acknowledge Yongzhi Cao, Li You, Zhao Wang, Shizhen Su, and Yuehong Bian for speci-men collection and technology support. Disclosure of conflict of interest
None.
Address correspondence to: Dr. Jinlong Ma, Shan- dong Provincial Key Laboratory of Reproductive
Medicine, Shandong Provincial Hospital Affiliated to
Shandong University, 324 Jingwu Road, Jinan 250000, China. Tel: 531-85651190; Fax: +86-531-87068226; E-mail: jinlongvma@163.com
References
[1] Sirmans SM and Pate KA. Epidemiology, diag-nosis, and management of polycystic ovary syndrome. Clin Epidemiol 2013; 6: 1-13. [2] Barthelmess EK and Naz RK. Polycystic ovary
syndrome: current status and future perspec-tive. Front Biosci 2014; 6: 104-119.
[3] Traub ML. Assessing and treating insulin resis-tance in women with polycystic ovarian syn-drome. World J Diabetes 2011; 2: 33-40. [4] Retraction notice to “Association of
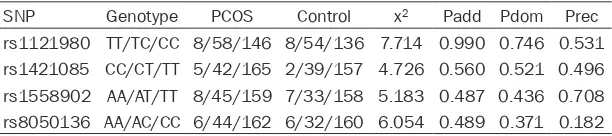
[image:4.612.91.397.82.150.2]anti-Mulle-rian hormone and small-dense low-density li-poprotein cholesterol with hepatosteatosis in young lean women with and without polycystic ovary syndrome” (Eur. J. Obstet. Gynecol. Re-prod. Biol. 182 (2014) 240-246). Eur J Obstet Table 3. Genotype frequencies in PCOS cases and controls
SNP Genotype PCOS Control x2 Padd Pdom Prec
rs1121980 TT/TC/CC 8/58/146 8/54/136 7.714 0.990 0.746 0.531 rs1421085 CC/CT/TT 5/42/165 2/39/157 4.726 0.560 0.521 0.496 rs1558902 AA/AT/TT 8/45/159 7/33/158 5.183 0.487 0.436 0.708 rs8050136 AA/AC/CC 6/44/162 6/32/160 6.054 0.489 0.371 0.182
Padd: P value of the additive genotype model (rs1121980: TT/TC/CC; rs1421085: CC/CT/TT; rs1558902: AA/AT/TT; rs8050136 AA/AC/CC) in the two groups. Pdom: P
value of the dominant genotype model (rs1121980: TT+TC/CC; rs1421085: CC+CT/TT; rs1558902: AA+AT/TT; rs8050136 AA+AC/CC) in the two groups. Prec: P value of the recessive genotype model (rs1121980: TT/TC+CC; rs1421085: CC/CT+TT; rs1558902: AA/AT+TT; rs8050136 AA/AC+CC) in the two groups.
and δ in mammals [10].
devel-[5] Yuan H, Zhu G, Wang F, Wang X, Guo H and Shen M. Interaction between common variants of FTO and MC4R is associated with risk of PCOS. Reprod Biol Endocrinol 2015; 13: 55. [6] Li G, Chen Q, Wang L, Ke D and Yuan Z.
Asso-ciation between FTO gene polymorphism and cancer risk: evidence from 16,277 cases and 31,153 controls. Tumour Biol 2012; 33: 1237-1243.
[7] Rotterdam EA-SPcwg. Revised 2003 consen-sus on diagnostic criteria and long-term health risks related to polycystic ovary syndrome (PCOS). Hum Reprod 2002; 19: 41-47.
[8] Li T, Wu K, You L, Xing X, Wang P, Cui L, Liu H, Cui Y, Bian Y, Ning Y, Zhao H, Tang R and Chen ZJ. Common variant rs9939609 in gene FTO confers risk to polycystic ovary syndrome. PLoS One 2013; 8: e66250.
[9] Sanchez-Pulido L and Andrade-Navarro MA. The FTO (fat mass and obesity associated) gene codes for a novel member of the non-heme dioxygenase superfamily. BMC Biochem 2007; 8: 23.
[10] Miller SG and Kennedy MB. Distinct forebrain and cerebellar isozymes of type II Ca2+/ calmodulin-dependent protein kinase associ-ate differently with the postsynaptic density fraction. J Biol Chem 1985; 260: 9039-9046.
[11] Means AR. Regulatory cascades involving calmodulin-dependent protein kinases. Mol Endocrinol 2000; 14: 4-13.
[12] Hudmon A and Schulman H. Neuronal CA2+/ calmodulin-dependent protein kinase II: the role of structure and autoregulation in cellular function. Ann Rev Biochem 2002; 71: 473-510.
[13] Hudmon A and Schulman H. Structure-func-tion of the multifuncStructure-func-tional Ca2+/calmodulin-dependent protein kinase II. Biochem J 2002; 364: 593-611.
[14] Soderling TR and Derkach VA. Postsynaptic protein phosphorylation and LTP. Trends Neu-rosci 2000; 23: 75-80.