www.impactjournals.com/oncotarget/ Oncotarget, Vol. 7, No. 30
MiRNA-200a expression is inverse correlation with hepatocyte
growth factor expression in stromal fibroblasts and its high
expression predicts a good prognosis in patients with non-small
cell lung cancer
Yongbing Chen1, Menghua Du2, Jin Wang2, Pengfei Xing2, Yongsheng Zhang3, Feng
Li3, Xueguan Lu2,4
1Department of Thoracic Surgery, the Second Affiliated Hospital of Soochow University, Suzhou, China 2Department of Oncology & Radiotherapy, the Second Affiliated Hospital of Soochow University, Suzhou, China 3Department of Pathology, the Second Affiliated Hospital of Soochow University, Suzhou, China
4Department of Radiation Oncology, Fudan University Shanghai Cancer Center, Shanghai, China
Correspondence to: Xueguan Lu, email: [email protected]
Keywords: lung cancer, stromal fibroblasts, miRNA-200a, hepatocyte growth factor, prognosis Received: January 02, 2016 Accepted: June 06, 2016 Published: June 27, 2016
ABSTRACT
Cancer-associated fibroblasts (CAFs) play an important role in favoring tumor progression. However, little is known concerning expression of miRNA-200a and its potential target gene hepatocyte growth factor (HGF) in CAFs. In the present study, we investigated expression levels and prognostic significance of miRNA-200a and HGF in stromal fibroblasts of non-small cell lung cancer (NSCLC), and evaluated the correlation between miRNA-200a and HGF. In situ hybridization and immunohistochemical staining were used to investigate expression levels of miRNA-200a and HGF in 134 formalin-fixed paraffin-embedded tumor specimens from clinical stage I -IIIA NSCLC, respectively. The results showed a significant inverse correlation existed between miRNA-200a and HGF expression level in stromal fibroblasts (χ2 =
21.778, p = 0.000). In vitro, the upregulation of miRNA-200a reduced expression of HGF protein in human CAFs. The 3-year overall survival (OS) rates with low and high miRNA-200a expression in stromal fibroblasts were 39.0% and 53.4%, respectively (χ2=4.25, p=0.039). The 3-year OS rates with low and high HGF expression in stromal
fibroblasts were 60.3% and 31.8%, respectively (χ2=12.55, p=0.000). The multivariate
analysis showed that clinical stage and HGF expression level in stromal fibroblasts were the independent predictive factors of OS. These results suggested that miRNA-200a expression was inverse correlation with HGF expression in stromal fibroblasts. High miRNA-200a and low HGF expression in stromal fibroblasts may predict a good prognosis in patients with NSCLC.
INTRODUCTION
Lung cancer is the most common cause of cancer-related death for man and women, with an overall 5-year survival rate of 15%. Approximately 85% of lung cancer patients are NSCLC [1-2]. Tumor recurrence and distant metastases are the most common events appeared after surgical resection, which lead to poor prognosis [3]. In the past decades, treatment and molecular characteristics relating to prognosis of NSCLC were mainly focused on the cancer cells. However, recent studies revealed that
the progression of tumors towards a malignant phenotype does not only depend on the cell-autonomous properties of cancer cells themselves but is also deeply influenced by tumor stroma [4]. Tumor stroma promotes tumor growth, invasion, metastases, and resistance to treatment as well as to mediate immune reaction against tumor cells [5]. The tumor stroma is formed by CAFs, macrophages, and other inflammatory cells as well as blood/lymphatic capillaries [6], and the CAFs is thought to be the main players among the cohabitating stromal cell types [7]. They favor tumor progression through secretion of soluble factors, as growth
factors or inflammatory chemokines, as well as remodeling tumor extra-cellular matrix (ECM) and tumor metabolism, increasing of motility and stemness of cancer cells, and preparation of metastatic niche [4, 8]. HGF is a protein produced by CAFs that involves in promoting growth, motility and morphogenesis in cancer [9]. Grugan et al [10] found that HGF secreted by CAFs fosters the ability of transformed esophageal epithelial cells to invade into ECM. Until now, there had many studies to investigate the prognostic value of HGF expression in cancer cells for multiple cancer types [11-14]. However, little is known concerning the prognostic implication of HGF expression in stromal fibroblasts.
MicroRNAs (miRNAs) are small non-coding RNA gene products about 21-25 nucleotides long, which play a pivotal role as oncogenes or tumor suppressors in various cancers [15]. In the past few years, miRNAs have emerged as promising molecular factors with potential for clinical applications in cancer diagnosis and therapy [16]. MiRNA-200 is a family of tumor suppressor miRNAs consisting of five members (miRNA-200a, miRNA-200b, miRNA-200c, miRNA-429, and miRNA-141), which is significantly involved in inhibition of epithelial-to-mesenchymal transition (EMT), repression of cancer stem cells self-renewal and differentiation, modulation of cell division and apoptosis, and reversal of chemoresistance [16]. In previous studies, miRNA-200a expression has been shown to downregulate several prognostic markers for cancer patients, such as ZEB1, ZEB2, ATRX, DLC1, HFE and HNRNPA3 [17-18]. We used TargetScan analysis (http://www.targetscan.org) to predict that HGF may be one of the target gene regulated by 200a. However, not much is known regarding miRNA-200a expression in tumor stromal fibroblasts and the
relationship between miRNA-200a and HGF in cancer. In present study, therefore, we separately investigate the expression levels of miRNA-200a and its potential target gene HGF in stromal fibroblasts and cancer cells from specimens of NSCLC, and evaluate the prognostic significance of these markers in patients with clinical stage I -IIIA NSCLC after curative resection.
RESULTS
Expression of miRNA-200a and HGF in stromal
fibroblasts and cancer cells
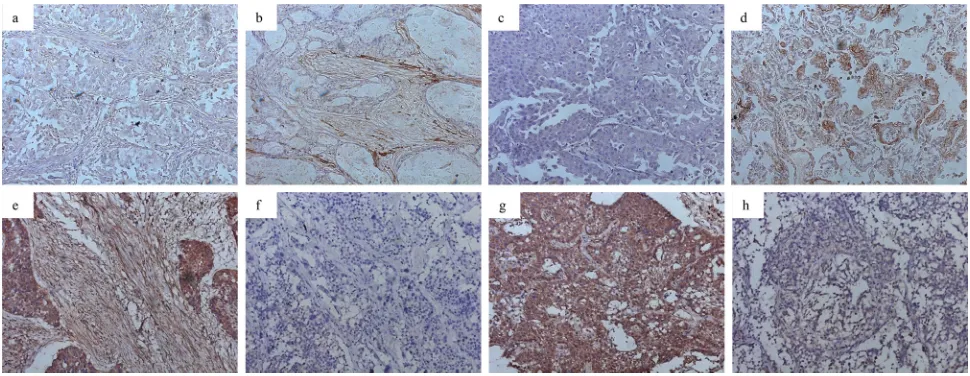
The expression of miRNA-200a and HGF was observed mainly in the cytoplasm. The percentages of high miRNA-200a expression in stromal fibroblasts and cancer cells were 59.7% (80/134) and 52.2% (70/134), respectively (Figure 1a–1d). The percentages of high HGF expression in stromal fibroblasts and cancer cells were 46.3% (62/134) and 82.1% (110/134), respectively (Figure 1e–1h). The analysis revealed a significant inverse correlation between miRNA-200a and HGF expression levels in stromal fibroblasts (χ2 = 21.778, p = 0.000;
Table 1). No significant association was found between miRNA-200a and HGF expression levels in cancer cells (χ2 = 2.239, p = 0.135).
[image:2.612.64.549.483.671.2]To determine the regulatory role of miRNA-200a on HGF, we tested the effect of miRNA-200a elevation on HGF protein expression in human CAFs in vitro. Twenty-four hours after transfection, real-time PCR results showed that relative expression of miRNA-200a in the mimic-transfected group to be upregulated ~8-fold compared to control groups (p< 0.05; Figure 2a). The upregulation of
Figure 1: Expression of miRNA-200a and HGF in NSCLC (magnification ×200).a. low miRNA-200a in stromal fibroblasts;
b. high miRNA-200a in stromal fibroblasts; c. low miRNA-200a in cancer cells; d. high miRNA-200a in cancer cells; e. high HGF
miRNA-200a reduced the expression level of HGF protein in human CAFs. (Figure 2b)
Association of miRNA-200a and HGF expression and clinicopathologic characteristics
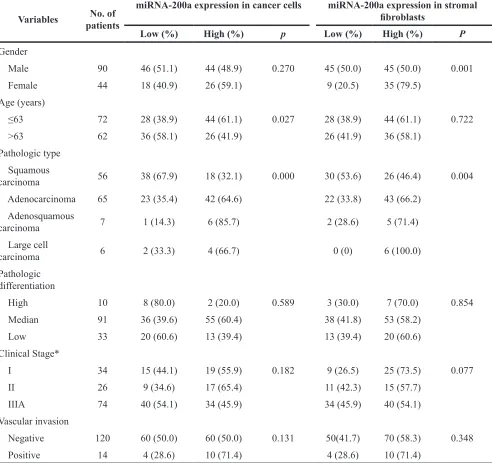
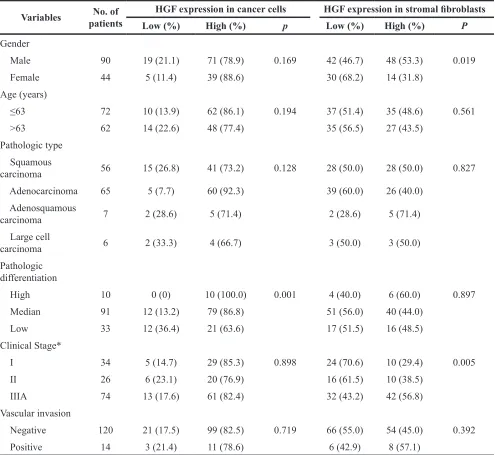
With regard to age, gender, clinical stage, pathologic type, pathologic differentiation and vascular invasion, the significant difference that correlated with miRNA-200a expression in stromal fibroblasts was observed for gender (p=0.001) and pathologic type (p=0.004), respectively. The significant associations were found between miRNA-200a expression in cancer cells and age (p=0.027) and pathologic type (p=0.000) (Table 2). The significant difference that correlated with HGF expression in stromal fibroblasts was observed for gender (p=0.019) and clinical stage (p=0.005), respectively. The significant associations were found between HGF expression in cancer cells and pathologic differentiation (p=0.001) (Table 3).
Prognosis analysis
The median duration of follow-up for these patients was 28 months (range, 1-58 months). The Kaplan-Meier
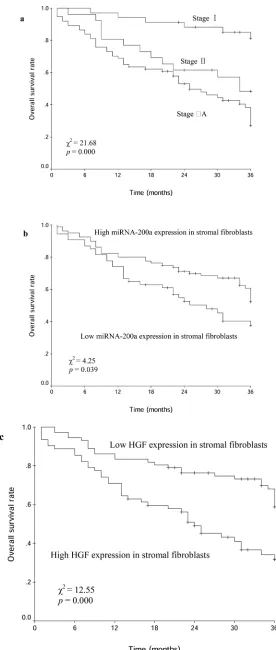
plots showed that the 3-year OS rate of all patients was 46.7%. The 3-year OS rates with clinical stage I, II and IIIA were 81.3%, 48.4% and 27.0%, respectively (χ2=21.68, p=0.000; Figure 3a). The 3-year OS rates
with low and high miRNA-200a expression in stromal fibroblasts were 37.6% and 52.3%, respectively (χ2=4.25,
p=0.039; Figure 3b). The 3-year OS rates with low and high HGF expression in stromal fibroblasts were 58.8% and 31.8% (χ2=12.55, p=0.000; Figure 3c). The
multivariate analysis using by Cox proportional hazard model was fitted to investigate significant covariates including variables relation to OS: clinical stage, miRNA-200a and HGF expression in stromal fibroblasts. The clinical stage and HGF expression level in stromal fibroblasts were identified as the independent predictive factors of OS (Table 4). For 56 patients with squamous carcinoma, the 3-year OS rates with low and high miRNA-200a expression in stromal fibroblasts were 39.8% and 59.7%, respectively (χ2=1.86, p=0.172). The 3-year
OS rates with low and high HGF expression in stromal fibroblasts were 67.4% and 30.6% (χ2=8.67, p=0.003).
[image:3.612.64.554.354.674.2]For 78 patients with non-squamous carcinoma, the 3-year OS rates with low and high miRNA-200a expression in stromal fibroblasts were 34.3% and 48.7%, respectively
Table 1: Association between miRNA-200a and HGF expression levels in stromal fibroblasts
HGF expression level No. of patients miRNA-200a expression level p Low (%) High (%)
Low 72 16 (22.2) 56 (77.8) 0.000
[image:3.612.63.556.373.444.2]High 62 38 (61.3) 24 (38.7)
(χ2=2.68, p=0.102). The 3-year OS rates with low and
high HGF expression in stromal fibroblasts were 54.0% and 32.1% (χ2=4.57, p=0.032). For 74 patients with the
stage IIIA, the 3-year OS rates with low and high HGF expression in stromal fibroblasts were 43.6% and 13.0%, respectively (χ2=10.99, p=0.001). However, no significant
association was found between low and high miRNA-200a/HGF expression levels in cancer cells with respect to OS in these patients, respectively (40.8% vs. 51.8%, χ2=2.30, p=0.130; 56.8% vs. 45.1%, χ2=0.04, p=0.843).
DISCUSSION
The previous studies have revealed the dysregulation of miRNA-200a in various cancers, including bladder
[image:4.612.63.556.67.530.2]cancer, breast cancer, colorectal cancer, endometrial cancer, gastric cancer, prostate cancer, and lung cancer [17, 19-22]. However, the function of miRNA-200a may differ depending on cancer types. van Kempen et al [19] showed that decreased expression level of miRNA-200a was correlation with increasing thickness in primary melanomas and metastases. Moreover, progressive loss of miRNA-200a expression was associated with disease progression. Barron et al [20] also found that miRNA-200a overexpression can reduce prostate cancer cell growth and its lower expression may predict biochemical relapse following radical prostatectomy in prostate cancer patients. On the contrary, miRNA-200a was found to be high expression in ovarian cancer cells compared to normal human ovarian surface epithelial cells. Its high
Table 2: Association between miRNA-200a expression and clinicopathologic features
Variables patientsNo. of
miRNA-200a expression in cancer cells miRNA-200a expression in stromal fibroblasts
Low (%) High (%) p Low (%) High (%) P
Gender
Male 90 46 (51.1) 44 (48.9) 0.270 45 (50.0) 45 (50.0) 0.001
Female 44 18 (40.9) 26 (59.1) 9 (20.5) 35 (79.5)
Age (years)
≤63 72 28 (38.9) 44 (61.1) 0.027 28 (38.9) 44 (61.1) 0.722
>63 62 36 (58.1) 26 (41.9) 26 (41.9) 36 (58.1)
Pathologic type Squamous
carcinoma 56 38 (67.9) 18 (32.1) 0.000 30 (53.6) 26 (46.4) 0.004
Adenocarcinoma 65 23 (35.4) 42 (64.6) 22 (33.8) 43 (66.2)
Adenosquamous
carcinoma 7 1 (14.3) 6 (85.7) 2 (28.6) 5 (71.4)
Large cell
carcinoma 6 2 (33.3) 4 (66.7) 0 (0) 6 (100.0)
Pathologic differentiation
High 10 8 (80.0) 2 (20.0) 0.589 3 (30.0) 7 (70.0) 0.854
Median 91 36 (39.6) 55 (60.4) 38 (41.8) 53 (58.2)
Low 33 20 (60.6) 13 (39.4) 13 (39.4) 20 (60.6)
Clinical Stage*
I 34 15 (44.1) 19 (55.9) 0.182 9 (26.5) 25 (73.5) 0.077
II 26 9 (34.6) 17 (65.4) 11 (42.3) 15 (57.7)
IIIA 74 40 (54.1) 34 (45.9) 34 (45.9) 40 (54.1)
Vascular invasion
Negative 120 60 (50.0) 60 (50.0) 0.131 50(41.7) 70 (58.3) 0.348
expression correlated with decreased progression-free survival [21-22]. Our results showed that miRNA-200a expression in cancer cells was correlated with pathologic type (p=0.000; Table 2). However, no significant association was found to be miRNA-200a expression level in cancer cells with respect to OS in patients with NSCLC. There had strong evidence in basic research to demonstrate that miRNA-200a inhibits EMT and suppresses lung cancer cell migration and invasion [16, 23]. Conversely, one function overexpression study has yielded conflicting results on the role of miRNA-200a in lung cancer cell migration [24]. These results indicate that the role of miRNA-200a in NSCLC is rather complex.
The present study tried to explore miRNA-200a expression level in stromal fibroblasts and evaluate
its prognostic value in NSCLC. Our results showed that miRNA-200a expression of stromal fibroblasts in squamous carcinoma was higher than in non-squamous carcinoma (p=0.004; Table 2), as well as its expression in cancer cells. Furthermore, the 3-year OS rate was higher in patients with high miRNA-200a expression in stromal fibroblasts compared to those with low miRNA-200a expression (p=0.039; Figure 2b). However, no significant difference of OS was found between low and high miRNA-200a expression of stromal fibroblasts in patients with squamous carcinoma or non-squamous carcinoma, respectively (p=0.172; p=0.102). We think that the limited number of patients is the main cause of these results.
[image:5.612.61.556.63.518.2]TargetScan analysis suggests that HGF may be one of the target gene regulated by miRNA-200a. Our
Table 3: Association between HGF expression and clinicopathologic features
Variables patientsNo. of HGF expression in cancer cells HGF expression in stromal fibroblasts Low (%) High (%) p Low (%) High (%) P
Gender
Male 90 19 (21.1) 71 (78.9) 0.169 42 (46.7) 48 (53.3) 0.019
Female 44 5 (11.4) 39 (88.6) 30 (68.2) 14 (31.8)
Age (years)
≤63 72 10 (13.9) 62 (86.1) 0.194 37 (51.4) 35 (48.6) 0.561
>63 62 14 (22.6) 48 (77.4) 35 (56.5) 27 (43.5)
Pathologic type Squamous
carcinoma 56 15 (26.8) 41 (73.2) 0.128 28 (50.0) 28 (50.0) 0.827
Adenocarcinoma 65 5 (7.7) 60 (92.3) 39 (60.0) 26 (40.0)
Adenosquamous
carcinoma 7 2 (28.6) 5 (71.4) 2 (28.6) 5 (71.4)
Large cell
carcinoma 6 2 (33.3) 4 (66.7) 3 (50.0) 3 (50.0)
Pathologic differentiation
High 10 0 (0) 10 (100.0) 0.001 4 (40.0) 6 (60.0) 0.897
Median 91 12 (13.2) 79 (86.8) 51 (56.0) 40 (44.0)
Low 33 12 (36.4) 21 (63.6) 17 (51.5) 16 (48.5)
Clinical Stage*
I 34 5 (14.7) 29 (85.3) 0.898 24 (70.6) 10 (29.4) 0.005
II 26 6 (23.1) 20 (76.9) 16 (61.5) 10 (38.5)
IIIA 74 13 (17.6) 61 (82.4) 32 (43.2) 42 (56.8)
Vascular invasion
Negative 120 21 (17.5) 99 (82.5) 0.719 66 (55.0) 54 (45.0) 0.392
results showed that a significant inverse correlation existed between miRNA-200a and HGF expression levels of stromal fibroblasts (p = 0.000; Table 1) in NSCLC specimen, whereas no significant association was found between miRNA-200a and HGF expression level in cancer cells (p = 0.135). Furthermore, in vitro, we confirmed overexpression of miRNA-200a decreased HGF protein level in human CAFs.
HGF, a ligand of c-Met proto-oncogene, has been reported to increase tumorigenetic, vascularizing, and motogenic effects on lung cancer. Most of previous studies have reported that HGF was commonly overexpressed in NSCLC and its overexpression was associated with poor prognosis in patients with NSCLC [25-26]. Our results showed that the percentage of high HGF expression in cancer cells was 82.1%. HGF expression level in cancer cells was associated with pathologic differentiation (p=0.001; Table 3). However, HGF expression level in cancer cells with respect to OS was no significant association. Similarly, Pan et al [14] also found that the relapse-free survival and OS had no
significant differences between lung adenocarcinoma patients with high HGF expression and those with low HGF expression. In addition, we found that high HGF expression level in stromal fibroblasts of NSCLC was 46.3%, and its expression level was correlated with clinical stage (p=0.005). Furthermore, the 3-year OS rate was higher in patients with low HGF expression in stromal fibroblasts compared to those with high HGF expression in stromal fibroblasts. The multivariate analysis showed that HGF expression level in stromal fibroblasts was an independent prognostic factor for NSCLC patients. The OS rate was also higher in low HGF expression compared to high HGF expression of stromal fibroblasts in patients with squamous carcinoma and non-squamous carcinoma, respectively (p=0.003; p=0.032).
[image:7.612.57.560.75.412.2]In conclusion, the results suggested that miRNA-200a expression was inverse correlation with HGF expression in stromal fibroblasts. High miRNA-200a and low HGF expression in stromal fibroblasts may predict a good prognosis in patients with NSCLC.
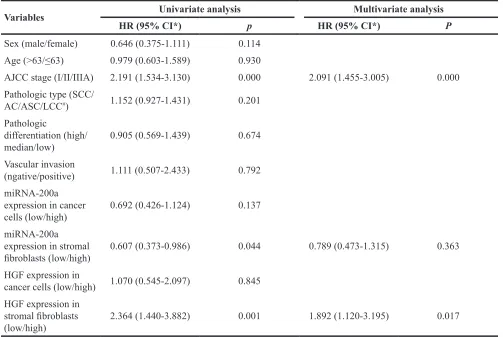
Table 4: Prognostic factors evaluated by univariate and multivariate analysis using Cox proportional hazard model (n=134)
Variables Univariate analysis Multivariate analysis
HR (95% CI*) p HR (95% CI*) P
Sex (male/female) 0.646 (0.375-1.111) 0.114
Age (>63/≤63) 0.979 (0.603-1.589) 0.930
AJCC stage (I/II/IIIA) 2.191 (1.534-3.130) 0.000 2.091 (1.455-3.005) 0.000
Pathologic type (SCC/
AC/ASC/LCC#) 1.152 (0.927-1.431) 0.201
Pathologic
differentiation (high/
median/low) 0.905 (0.569-1.439) 0.674
Vascular invasion
(ngative/positive) 1.111 (0.507-2.433) 0.792
miRNA-200a expression in cancer
cells (low/high) 0.692 (0.426-1.124) 0.137
miRNA-200a expression in stromal
fibroblasts (low/high) 0.607 (0.373-0.986) 0.044 0.789 (0.473-1.315) 0.363
HGF expression in
cancer cells (low/high) 1.070 (0.545-2.097) 0.845 HGF expression in
stromal fibroblasts
(low/high) 2.364 (1.440-3.882) 0.001 1.892 (1.120-3.195) 0.017
Abbreviation: #SCC/AC/ASC/LCC: squamous carcinoma/adenocarcinoma/adenosquamous carcinoma/large cell carcinoma
MATERIALS AND METHODS
Patients and specimen selection
The paraffin-embedded postoperative tissue specimens were obtained from the archives of department of pathology, the Second Affiliated Hospital of Soochow University, between January of 2010 and June of 2012. One hundred and thirty-four specimens of clinical stage I-IIIA NSCLC were retrieved. Approval for current project was obtained from the local ethics committee together with written informed consent from each patient.
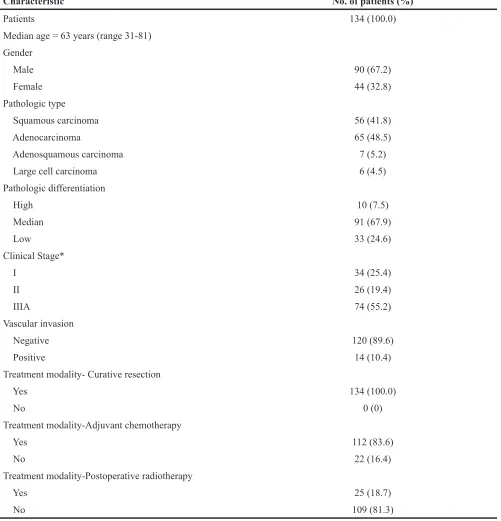
The main characteristics of 134 patients were summarized in Table 5. Ages of all patients in this study range from 31 to 81 years (median, 63 years). According to AJCC/UICC (6th edition), there enrolled 34 patients with
stage I, 26 patients with stage II, and 74 patients with stage IIIA. All patients underwent curative resection, of which 21 patients received segmentectomy, 98 patients received lobectomy and 15 patients received pneumonectomy. Systemic adjuvant treatment was administered to 112 patients. The chemotherapeutic regimen was cisplatin-based doublet. Twenty-five patients received thoracic postoperative radiotherapy.
In situ hybridization (ISH) staining
Three serial slides, each 3-5 um thick, were cut from paraffin-embedded tissue. One slide was used to give HE staining again. Immunohistochemical staining for HGF was performed on the second slide. The third slide was used to evaluate miRNA-200a expression by ISH. In brief, the slides were incubated at 60°C for 1 hour, deparaffinized in xylene, and rehydrated with graded alcohol washes. Slides were then washed three times with diethyl pyrocarbonate -treated PBS, digested with 5 ug/ ml proteinase K at 37 °C for 30 minutes, washed then
dehydrated in graded alcohol. Slides were hybridized at 55°C for 2 hours with 50 nmol/L locked nucleic acid -modified digoxigenin-labeled probes for miRNA-200a (Boster, Wuhan, China). After stringency washes (5x, 1x, 0.2x SSC), slides were placed in blocking solution for 1 hour at room temperature followed by incubation in alkaline phosphatase conjugated anti-DIG Fab fragment solution at 37°C for 2 hours. Antibody signal was amplified with 4-nitro-blue tetrazolium and 5-bromo-4-chloro-3’-indolylphosphate substrate (Roche, Mannheim, Germany). Finally, hematoxylin was used as a light nuclear counterstain.
The intensity histoscore with the following categories according to Donahue’s description was used: 0 negative, 1 weakly positive, 2 moderately positive, and 3 strongly positive [27]. The final score between 0-1 was determined as low expression, and score between 2-3 was determined as high expression.
Immunohistochemical staining
Immunohistochemical staining was performed by two-step procedure. Upon rehydration as above, the slides were subjected to antigen retrieval by pressure-cooking for 15 minutes. Endogenous peroxidase activity was neutralized using peroxide block placement on the slides for 10 minutes at room temperature. The slides were then incubated with anti-HGF polyclonal antibody (ab83760, Abcam, Cambridge, MA; diluted 1: 200) at 4°C overnight. This was followed by incubation with peroxidase-conjugated polymer (ChemMate EnVision / HRP; Gene Tech, Shanghai, China) for 30 minutes at room temperature. The chromogen reaction was developed in 3,3’-diaminobenzidine (DAB; Gene Tech, Shanghai, China) tetrahydrochloride for 5 minutes. Finally, hematoxylin was used as a light nuclear counterstain.
The percentage of positive-staining cells were graded on a scale of 0-3, with less than 5% positive-staining cells as grade 0, 5-25% as grade 1, 26-50% as grade 2, and more than 50% as grade 3. The intensity of staining also graded on a scale of 0-2, with negative to weak intensity as grade 0, weak-moderate intensity as grade 1, and moderate to strong intensity as grade 2. Finally, the score of percentage and intensity was multiplied. The final score between 0-2 was determined as low expression, and score higher than 2 was determined as high expression.
Cell culture and transfection
The fresh specimen from the resected lung adenocarcinoma tissues was used to culture CAFs. The process of primary culture and identification of CAFs has been made a detailed description in our previous study [28]. The CAFs were used to conduct experiment after 3-5 passages following primary culture.
The sequence of miRNA-200a mimics and negative control are listed as below:
5’-UAACACUGUCUGGUAACGAUGUAUCGU UACCAGACAGUGUUAUU-3’ and 5’-UUCUCCGAAC GUGUCACGUTTACGUGACACGUUCGGAGAATT-3’ To transfect human CAFs, 100-pmol mimics of miRNA-200a (Ribobio, Guangzhou, China) and negative control in 200ul of serum-free medium were mixed with 5ul of Lipofectamine 2000 transfection reagent (Ribobio), dissolved in 200ul of the same medium, respectively. The resulting transfection solutions were then added to each well containing 1.6 ml of the medium. The culture was replaced with differentiation medium after 6. 0 h.
Quantative real-time PCR analysis
according to the manufacturer’s recommendations. Total RNA was subsequently reverse transcribed to cDNA with the stem-loop reverse transcription primer (Beijing Genomics Institute, Beijing, China) for miRNA-200a detection. The primer sequences are listed as below: (1) miRNA-200a RT: 5’-GTCGTATCCAGT GCGTGTCGTGGAGTCGGCAATTGCACTGGAT ACGACACATCGT-3’; (2) miRNA-200a qPCR-F:
[image:9.612.58.559.71.592.2]5’-GGGGTAACACTGTCTGGTAG-3’. Real-time -PCR was carried out using SYBR Premix Ex Taq™ (Takara Biotechnology, Dalian, China). The reactions were placed in a 96-well plate using a preheated real-time instrument (ABI 7500HT; Applied Biosystems Life Technologies). The relative levels of expression were quantified and analyzed using Bio-Rad iCycler iQ software (Bio-Rad Laboratories, Hercules, CA, USA). Ct values were used
Table 5: Patient characteristics
Characteristic No. of patients (%)
Patients 134 (100.0)
Median age = 63 years (range 31-81) Gender
Male 90 (67.2)
Female 44 (32.8)
Pathologic type
Squamous carcinoma 56 (41.8)
Adenocarcinoma 65 (48.5)
Adenosquamous carcinoma 7 (5.2)
Large cell carcinoma 6 (4.5)
Pathologic differentiation
High 10 (7.5)
Median 91 (67.9)
Low 33 (24.6)
Clinical Stage*
I 34 (25.4)
II 26 (19.4)
IIIA 74 (55.2)
Vascular invasion
Negative 120 (89.6)
Positive 14 (10.4)
Treatment modality- Curative resection
Yes 134 (100.0)
No 0 (0)
Treatment modality-Adjuvant chemotherapy
Yes 112 (83.6)
No 22 (16.4)
Treatment modality-Postoperative radiotherapy
Yes 25 (18.7)
No 109 (81.3)
to calculate the RNA expression levels. The amount of miRNA-200a expression (2-ΔΔCt) was normalized using
the endogenous U6 reference.
Western blotting analysis
Briefly, human CAFs were lysed in a buffer consisting of 50 mM Tris-HCl (pH 6.8). After brief sonication, lysates were clarified by centrifugation at 12 000 × g for 10 min at 4°C, and protein content in the supernatant was measured according to the Bradford method. Aliquots (80-100 ug of protein per lane) of total protein were separated by 8% SDS-polyacrylamide gel electrophoresis and blotted onto nitrocellulose transfer membranes (Beyotime, China). Each membrane was blocked with 5% non-fat dry milk in TBS-T for 1.5 h at room temperature, followed by incubation with the antibody HGF (diluted 1: 1000) overnight at 4°C. After extensive washing with TBST, each membrane was further incubated with horseradish peroxidase-conjugated anti-rabbit secondary antibodies (1:5000) for 2.0 h at room temperature in TBST containing 5% non-fat dry milk. Detection was performed using an enhanced chemiluminescence reagent (Beyotime, China), according to the manufacturer’s protocol.
Statistical analysis
The relationships between miRNA-200a and HGF expression in cancer cells or stromal fibroblasts and clincopathologic characteristics were examined by Spearmann correlation coefficient test. OS rates were performed by the Kaplan-Meier method and log-rank test. The Cox proportional hazard model was used for univariate and multivariate analysis. Overall survival duration was defined from the day of surgery to the day of death or last follow-up. For all tests, a two-sided p< 0.05 was considered significant.
CONFLICTS OF INTEREST
The authors declare no competing finanical interests.
GRANT SUPPORT
This work was supported by grants from Jiangsu Natural Science Funding (20141185).
REFERENCES
1. Siegel RL, Miller KD, Jemal A. Cancer statistics, 2015. CA Cancer J Clin. 2015; 65:5-29.
2. Mirshahidi HR, Hsueh CT. Updates in non-small cell lung cancer – insights from the 2009 45th annual meeting of the American Society of Clinical Oncol. J Hematol Oncol. 2010; 3:18.
3. Williams BA, Sugimura H, Endo C, Nichols FC, Cassivi SD, Allen MS, Pairolero PC, Deschamps C, Yang P. Predicting postrecurrence survival among completely resected non small cell lung cancer patients. Ann Thorac Surg. 2006; 81:1021-1027.
4. Cirri P, Chiarugi P. Cancer-associated-fibroblasts and tumor
cells: a diabolic liaison driving cancer progression. Cancer Metastasis Rev. 2012; 31:195-208.
5. Navab R, Strumpf D, Bandarchi B, Zhu CQ, Pintilie M,
Ramnarine VR, Ibrahimov E, Radulovich N, Leung L,
Barczyk M, Panchal D, To C, Yun JJ, et al. Prognostic gene-expression signature of carcinoma-associated fibroblasts in
non-small cell lung cancer. Proc Natl Acad Sci USA. 2011; 108:7160-7165.
6. Polyak K, Haviv I, Campbell IG. Co-evolution of tumor
cells and their microenvironment. Trends Genet. 2009; 25:30-38.
7. Tang X, Hou Y, Yang G, Wang X, Tang S, Du YE, Yang L, Yu T, Zhang H, Zhou M, Wen S, Xu L, Liu M. Stromal miR-200a contributes to breast cancer cell invasion through CAF activation and ECM remodeling. Cell Death Differ. 2016; 23:132-145.
8. Mantoni TS, Lunardi SL, AI-Assar O, Masamune A, Brunner TB. Pancreatic stellate cells radioprotect pancreatic
cancer cells through β1-integrin signaling. Cancer Res.
2011; 71:3453-3458.
9. Hale MD, Hayden JD, Grabsch HI. Tumor-microenvironment interactions: role of tumor stroma and
proteins produced by cancer-associated fibroblasts in
chemotherapy response. Cell Oncol. 2013; 36:95-112. 10. Grugan KD, Miller CG, Yao Y, Michaylira CZ, Ohashi S,
Klein-Szanto AJ, Diehl JA, Herlyn M, Han M, Nakagawa
H, Rustgi AK. Fibroblasts-secreted hepatocyte growth factor plays a functional role in esophageal squamous cell carcinoma invasion. Proc Natl Acad Sci USA. 2010; 107:11026-11031.
11. Dreikhausen L, Blank S, Sisic L, Heger U, Weichert W, Jäger D, Bruckner T, Giese N, Grenacher L, Falk C, Ott
K, Schmidt T. Association of angiogenic factors with prognosis in esophageal cancer. BMC Cancer. 2015; 15:121.
12. Hao NB, Tang B, Wang GZ, Xie R, Hu CJ, Wang SM, Wu YY, Liu E, Xie X, Yang SM. Hepatocyte growth factor
(HGF) upregulates heparanase expression via the PI3K/ Akt/NF-κB signaling pathway for gastric cancer metastasis.
Cancer Lett. 2015; 361:57-66.
13. Yang H, Zhang C, Cui S. Expression of hepatocyte growth factor in breast cancer and its effect on prognosis and sensitivity to chemotherapy. Mol Med Rep. 2015; 11:1037-1042.
14. Pan B, Wang R, Huang Y, Garfield D, Zhang J, Chen H.
HGF and NRG1 protein expression are not poor prognostic
markers in surgically resected lung adenocarcinoma. Onco
15. Pak MG, Lee CH, Lee WJ, Shin DH, Roh MS. Unique
microRNAs in lung adenocarcinoma groups according to major TKI sensitive EGFR mutation status. Diagn Pathol. 2015; 10:99.
16. Pacurari M, Addison JB, Bondalapati N, Wan YW, Luo
D, Qian Y, Castranova V, Ivanov AV, Guo NL. The
microRNA-200a family targets multiple non-small cell lung
cancer prognostic markers in H1299 cells and BEAS-2B
cells. Int J Oncol, 2013, 43:548-560.
17. Feng X, Wang Z, Fillmore R, Xi Y. MiR-200, a new star miRNA in human cancer. Cancer Lett. 2014; 344:166-173. 18. Nagaoka K, Zhang H, Watanabe G, Taya K. Epithelial cell
differentiation regulated by microRNA-200a in mammary glands. PLos One. 2013; 8:e65127.
19. van Kempen LC, van den Hurk K, Lazar V, Michiels S, Winnepenninckx V, Stas M, Spatz A, van den Oord JJ. Loss
of microRNA-200a and c, and microRNA-203 expression at the invasive front of primary cutaneous melanoma is
associated with increased thickness and disease progression.
Virchows Arch. 2012; 461:441-448.
20. Barron N, Keenan J, Gammell P, Martinez VG, Freeman A, Masters JR, Clynes M. Biochemical relapse following radical prostatectomy and miR-200a levels in prostate cancer. Prostate. 2012; 72:1193-1199.
21. Kan CW, Hahn MA, Gard GB, Maidens J, Huh JY, Marsh DJ, Howell VM. Elevated levels of circulating microRNA-200 family members correlate with serous epithelial ovarian cancer. BMC Cancer. 2012; 12:627. 22. Nam EJ, Yoon H, Kim SW, Kim H, Kim YT, Kim JH,
Kim JW, Kim S. MicroRNA expression profiles in serous
ovarian carcinoma. Clin Cancer Res. 2008; 14:2690-2695.
23. Zhen Q, Liu J, Gao L, Liu J, Wang R, Chu W, Zhang Y,
Tan G, Zhao X, Lv B. MicroRNA-200a targets EGFR and
c-Met inhibit migration, invasion, and gefitinib resistance in
non-small cell lung cancer. Cytogenet Genome Res. 2015; 146:1-8.
24. Chen Y, Peng W, Lu Y, Chen J, Zhu YY, Xi T. MiR-200a enhances the migrations of A549 and SK-MES-1 cells by regulating the expression of TSPAN1. J Biosci. 2013; 38:523-532.
25. Hosoda H, Izumi H, Tukada Y, Takagiwa J, Chiaki T, Yano
M, Arai H. Plasma hepatocyte growth factor elevation may be associated with early metastatic disease in primary lung cancer patients. Ann Thorac Cardiovasc Surg. 2012; 18:1-7. 26. Navab R, Liu J, Seiden-Long I, Shih W, Li M, Bandarchi
B, Chen Y, Lau D, Zu YF, Cescon D, Zhu CQ, Organ
S, Ibrahimov E, et al. Co-overexpression of Met and hepatocyte growth factor promotes systemic metastasis in NCI-H460 non-small cell lung carcinoma cells. Neoplasia. 2009; 11:1292-1300.
27. Donahue TR, Nguyen AH, Moughan J, Li L, Tatishchev S, Toste P, Farrell JJ. Stromal microRNA-21 levels predict
response to 5-fluorouracil in patients with pancreatic cancer.
J Surg Oncol. 2014; 110:952-959.
28. Ji X, Ji J, Shan F, Zhang Y, Chen Y, Lu X.
Cancer-associated fibroblasts from NSCLC promote the