Bachelor Thesis by
Duco Veen
Multivariate analysis for using the
Crosswise- and Triangular method
Department of Research
Methodology, Measurement and
Data Analysis
Enschede, June 2014
1
Abstract
2
Acknowledgements
3
Table of Contents
Abstract ... 1
Acknowledgements ... 2
List of Figures ... 4
List of Tables ... 4
Introduction ... 5
General Introduction ... 5
Sensitivity of Questions ... 5
Survey Design ... 6
Bias Reduction ... 7
Randomized Response ... 8
Warner’s Model ... 8
Unrelated Question Method ... 9
Two Bernoulli Distributions ... 9
Forced Randomized Response ... 9
Randomizing Devices ... 10
Crosswise Model ... 11
Triangular Model ... 13
Comparing Models ... 15
Problem Description and Proposed Solution ... 15
Problem Description ... 15
Proposed Solution ... 15
Logistic Regression for Univariate Randomized Responses ... 16
Logistic Regression for Multivariate Randomized Response Data ... 18
Data Analysis ... 19
Discussion ... 22
Appendix A: ... 25
R Code for the Link Function for Logistic Transformation of Randomized Response Data ... 25
Appendix B: ... 26
R Code for the Link Function and Dummy Coding for Multivariate Analysis ... 26
4
List of Figures
Figure 1: Probability tree for the Crosswise Model... 12
Figure 2: Probability tree for the Triangular Model ... 14
List of Tables
Table 1: Response model for the Crosswise model ... 11Table 2: Character descriptions for the Crosswise model ... 11
Table 3: Response model for Triangular model ... 13
Table 4: Character descriptions for the Triangular Model ... 13
Table 5: Variance of the MLE for Crosswise model and Warner's model ... 15
Table 6: Character descriptions for logistic modeling of randomized response data... 16
Table 7: Intercepts for questions one, two and the combined intercept ... 19
Table 8: Model of age as predictor using data from question one and two ... 20
5
Introduction
General Introduction
This paper will focuses on surveys, specifically those that deal with sensitive questions and topics. What is it that makes a question or survey sensitive to a respondent? And why does it matter if a question or survey is sensitive in nature? Well, even though surveys are successfully used in a great variety of subjects, it seems they do not work quite as well when they concern sensitive subjects opposed to non-sensitive subjects. Tourangeau and Yan (2007) mention that methodological research on sensitive topics seems to indicate that misreporting is a huge source of error in the population estimates that are derived from surveys concerning sensitive subjects. This is a problem because this means that a survey would not be a good tool for valid measurement of sensitive characteristics of respondent or prevalence of sensitive behavior in populations.
It would be desirable to reduce misreporting in surveys concerning sensitive subjects. This paper will propose new options. To do so, first it is necessary to know what it is that adheres to the sensitive nature of a question. This will be described briefly. Secondly, some general ways to reduce bias and misreporting in surveys will be described. Then an introduction will be given into randomized response models and how they deal with research on sensitive subjects. Their main shortcomings are that they often require a randomizing device and/or only give information about population estimates. It will be shown that two models, developed by Yu, Tian and Tang (2008), belong to the framework of randomized response models while they do not require a randomizing device. Furthermore it will be shown that by using logistic regression methods it is possible to analyze multiple items collected under this design and to make inferences about individuals.
Sensitivity of Questions
Tourangeau, Rips and Rasinski (2000) discuss three different aspects that may constitute to the sensitivity of a question. The first aspect is the social (un)desirability of an answer. Social norms dictate that, for instance tax evasion is bad and helping an elderly person cross the street is good. A question can become sensitive if it asks whether the respondent has violated such norms (Tourangeau et al., 2000). A question that investigates potential breaches of socially desirable norms may evoke a distortion of the respondents answer so as to conform to a social standard. If a question asks about the violation of such norms it may only be a sensitive question to those whom have breached the norm. For instance, in the study of Fox, Avetisyan and van der Palen (2013) about smoking behavior of patients at a pulmonary department of the hospital questions asked were only sensitive for smokers, non-smokers didn’t perceive the questions as sensitive. With regard to social norms it should be noted that those norms may vary between cultures. A researcher has to take into account what the social norms of the population that is within the scope of the study are.
6 The third reason has also got something to do with privacy in a way. A question can become sensitive if the respondent fears that his or her answer might be disclosed to a third party (Tourangeau et al., 2000). This may have to do with the possible consequences of the disclosure of such information to a third party (Tourangeau & Yan, 2007). Imagine that a teenager may be more concerned about parents finding out that he or she smokes if that has consequences like being grounded. But if the parents already know about the smoking behavior the thread of disclosure might not exist and the question would not be sensitive. The thread of disclosure may lead to non-response. But this does not mean that assuring against such disclosure causes higher response rates. Singer, Mathiowetz and Couper (1993) suggest that confidence in the data-collection agency may have a slight effect on the response rates but assurances of confidentiality do not yield more trust or better response rates.
Survey Design
When a question or survey might be classified as sensitive we need to take a look at some of the different ways of questioning and the ways in which a survey can be conducted. These different ways in which this can be done all have some pro’s and con’s.
Surveys are a commonly used manner of gathering information about a wide range of subjects. They can be used to do descriptive, explanatory or even exploratory research. With surveys it is possible to obtain data in a wide variety of ways. Babbie (2010) makes a distinction between open-ended and closed-ended questions. The difference between these kinds of questions lies in the way the answers are analyzed. Open ended questions usually are coded before or during the analyzing stage and are well suited for qualitative research. This research will focus on surveys that are of a quantitative nature and therefore will be concerned with closed-ended questions.
Within the boundaries of closed-ended questions there are several types of questions and also several ways of obtaining answers to these questions. One kind of question is for instance dichotomous question which demands one out of two possible answers, for instance either a yes or no answer or an A or B answer. Another type of closed-ended question is a multiple choice question. The respondent has the choice between several answers. It is possible to allow respondent to answer one or multiple options in this format and the options do not need to be mutually exclusive. A third option regarding closed-ended questions is a likert scale. The likert scale allows a respondent to answer to which degree they agree with a statement. The proposed methods of data collection in this paper are based on questions with dichotomous answers. Some other proposals that will be discussed can also use multiple choice questions or likert scale questions.
The manner in which questions are asked is possible in a variety of ways. Babbie (2010) distinguishes three main ways to conduct surveys. By means of self-administered questionnaires, interviews in face to face encounters and finally by means of telephone.
7 Interview surveys have advantages of being able to ensure that all questions are answered and ensure that the respondent alone is the one that answers the questions (Cohen, Manion, & Morrison, 2007). But is has it’s downsides as well, among them that they are quite costly and if done by different researchers this can give discrepancies due to interviewer effect. But with regards to sensitive questions the main problem with interviews is that direct questioning doesn’t result in reliable answers to questions that may be considered sensitive in nature (Hochstim, 1967).
Telephone surveys offer substantial cost reduction compared to interview surveys and keep advantages of being able to ensure that all questions are answered (Cohen et al., 2007). However it had disadvantages just like the other methods. For instance, it is possible to get a skewed population representation because of call screening against researchers, people the researcher might not reach because they are not home to answer the phone (Cohen et al., 2007). And in the Netherlands for example there is a register you can subscribe to which bans telemarketers and researchers from calling (Infofilter, 2012), this might cause a discrepancy between the population the researcher wants to study and the population that the researcher is allowed to contact.
Among other things, the anonymity and its low cost are good reasons to try to develop a way to conduct surveys concerning sensitive subjects by means of self-administration. Some data collection methods have been developed to allow self-administration in surveys concerning sensitive subjects but they often require a randomizing device or suffer in reliability to reduce the bias in the given answers. The proposal in this paper aims to reduce some of these problems although it will not be able to exclude all of them.
Bias Reduction
Considering that the proposed data collection methods will concern self-administered questions some general ways to reduce bias in the answers given to these type of questions will be discussed. Some studies have been done regarding wording of the questions in a survey. The wording of the questions in a survey is something to give great consideration. This does not only go for sensitive questions but for all questions, as Babbie says: “Designing useful (and trustworthy) survey research begins with formulating good questions” (Babbie, 2010, p. 255). For designing those useful questions Babbie (2010) names nine guidelines, among them that items should avoid negative terms to minimalize confusion and that items should be clear and precise. These are quite logical things but even so it is good to check questions against such guidelines to avoid unnecessary bias in the answers to survey questions. Next to the fact that bias can generally be avoided by such guidelines, concerning surveys with sensitive questions some studies have been done on how to further reduce bias.
8 The bogus pipeline method (Jones & Sigall, 1971) is another way to instigate honest answers. In such setting respondents believe that there is a device that can derive the true scores of their answers regardless of how they answer. This method works on the presumption that respondents do not want their answers to be second guessed by a machine (Jones & Sigall, 1971). Even if this technique works well the applications may not be desirable. Avetisyan (2012) mentions that researchers refrain from using this method because it is based on elements of deception.
Randomized Response
Warner’s Model
Beside the development of general ways on how to improve questionnaires or how to reduce response bias, new ways of approaching a questionnaire have been developed. One of the first people to take a radical new approach to questionnaires concerning sensitive subjects was Warner (1965) when he proposed his “Random response model for proportions”. What he proposed in this model was to change the way to collect data. If you have respondents that belong to either group A or group B, a researcher installs a randomizing device, a spinner for example, which only the respondent can see. The respondent sees the spinner point to either an A or a B and only answers whether or not they belong to this group. By manipulating the spinner so there is a different chance to point to an A or a B it is possible to calculate the proportion belonging to group A and to group B. Because A and B are each other’s antonyms there is no possibility of belonging to both. For example if you vote you belong to group A and if you do not vote you belong to group B. This data collection method gives respondents a feeling of protection or as he said himself: “The method is built on the premise that cooperation should be naturally better if the questions allow answers which reveal less even to the interviewer.” (Warner, 1965, p. 63). That this decreases at least some of the worries that respondents might have is evident if you consider for instance the thread of disclosure that has previously been discussed. If the researcher cannot say with certainty what answer has been given on an individual level then there is nothing to be disclosed.
Fox et al. (2013) did research in the medical field and noted random response theory has had little attention in this field. They also noted that in other research fields it has been used to study and successfully measure prevalence of sensitive behavior (Fox et al., 2013). This has been done in a variety of ways and in the next section a few of those techniques that have been developed in the years following Warner’s paper will be addressed. Not just Warner’s method but all randomized response methods can be described in a common way which is represented by Equation 1 (van der Hout, van der Heijden, & Gilchrist, 2007),
*
P(Yi 1) c d P(Yi 1) (1)
This Equation explains the influence of the randomized response data collection method on the observed data. The parameters c and d describe the influence of the data collection method on the probability,
P(
Y
i
1)
, that person i gives a response one. The probability *P(Yi 1)is the probability
9
Unrelated Question Method
The basis for the unrelated question method is the same as Warner’s model. Greenberg, Abul-Ela, Simmons and Horvitz (1969) set a theoretical framework in which the same randomizing principle is involved as in Warner’s model. But instead of the randomizer appointing questions that are each other’s antonyms, the randomizer appoints either the sensitive question or a non-sensitive question that is unrelated (e.g. a question about sexual behavior paired with the question whether or not the respondent is left handed). It turns out that this method can reduce the variance in comparison with Warner’s model (Greenberg et al., 1969).
Two Bernoulli Distributions
Another method that has been developed is based on the respondent having to pick from one of two different Bernoulli distributions. Kuk (1990) proposed that if the respondent is given two sets of items that contain two variables (e.g. a set of cards with red and black colors or a bowl full of marbles of two colors) they do not need to answer the question but they need to pick from one of the two sets according to the answer. They only report the color they draw. By adjusting the distributions in the two sets it is possible to estimate the amount of affirmative and negative answers, thereby allowing the researcher to estimate prevalence’s.
Forced Randomized Response
10
Randomizing Devices
The previously described data collection methods all have their own advantages and disadvantages. But the disadvantage that all four of the previously described methods have is that they all require a randomizing device or in Kuk’s model two randomizing devices. This leads to problems with non-response rates and respondents not understanding the procedure (Coutts & Jann, 2011). A possible solution that has been proposed is to digitalize the questionnaire and with it, or at least, the randomizing device. But as it turns out Coutts and Jann (2011) found that a digitalized randomizing device results in extremely low trust in the protection by the randomizing device.
Problems that are caused by using a randomizing device have led to the development of different methods that do not require a randomizing device. One of these methods is the unmatched count technique that has been tested and described in several papers (Coutts & Jann, 2011; Droitcour, et al., 1991). It was originally developed by Miller (1984) as an attempt to merge the best elements of randomized response technique and nominative technique. It gives the respondent a list of items and the respondent has to answer how many of these items are relevant to the respondent (e.g. how many of the mentioned behaviors has the respondent exhibited). The respondents will be placed in one of two groups. One group gets a list of items that are non-sensitive and the other group gets the same list plus one item of a sensitive nature that is the subject of the study. With the difference in the amount of items between the groups it is possible to calculate the prevalence of the sensitive item. This of course under the premises that both groups are the same for the non-sensitive items. Another limitations is that this technique induces a high sampling variance (Coutts & Jann, 2011).
11
Crosswise Model
As previously mentioned the basis for the Crosswise model is that two questions will be paired. One question is the question with the sensitive nature of specific interest, the other question is a non-sensitive question for which the general population estimates are known. To answer the question the responded replies with one of the two options in the following way:
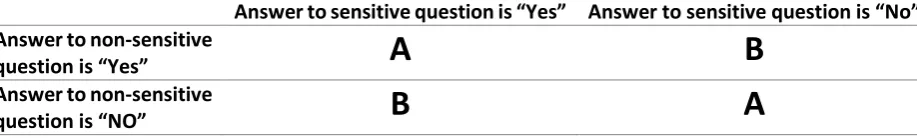
[image:12.595.74.533.310.379.2]The respondent answers an A if the answer to both questions is the same (two times yes or two times no) and a B if the answers are different for both questions, for visual representation see Table 1. To clarify the way this works, imagine that an answer needs to be given for each question, the sensitive question and the non-sensitive question. An affirmative answer to one of these questions could be represented by an 1 and a negative answer by a 0. If the response for both questions is the same, both 1 or both 0, a single answer A will be given as a reply to the researcher or the form by the respondent. If the answers differ for both questions a B will be given as reply by the respondent.
Table 1
Response model for the Crosswise model
Answer to sensitive question is “Yes” Answer to sensitive question is “No” Answer to non-sensitive
question is “Yes”
A
B
Answer to non-sensitive
question is “NO”
B
A
Table 2
Character descriptions for the Crosswise model
Proportion of population having sensitive characteristic
Proportion that has non sensitive characteristic
Number of respondents
Answer A (both yes or both no)
Answer B (one yes and one no)
Exp
P
n
A
B
^ ^ected proportion of answers A in population
Estimated proportion of population having sensitive characteristic
Observed proportion of answers A in population A / n
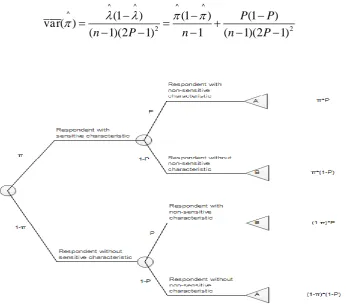
The probability that a respondent answers either an A or a B can be visually represented by the probability tree that can be seen in Figure 1. The Maximum Likelihood Estimate (MLE) of the proportion of subjects having the sensitive characteristic is expressed in Equation 2
^
^ ( 1)
(2 1) P P
π (2)12
^ ^ ^ ^
^
2 2
(1
)
(1
)
(1
)
var( )
(
1)(2
1)
1
(
1)(2
1)
P
P
n
P
n
n
P
[image:13.595.128.481.70.378.2]
(3)Figure 1. Probability tree for the Crosswise Model
If the researcher knows the population estimates for the non-sensitive question and has the amount of A’s and B’s that are answered to the questions the MLE can be derived as can the associated variance. However, this is still just a population estimate and a way of analyzing data that allows researchers to make predictions based on individual response patterns will be introduced.
To show that this method can indeed be described in the same way as the other randomized response methods a short explanation will be given. *
P(Yi 1) represents the probability of an observed
affirmative answer, in this case the answer A.
P(
Y
i
1)
represents the probability of an affirmative answer to the sensitive question. According to the probability tree a response A is given with probability, whereP(
Y
i
1)
,*
P(Yi 1)
p (1
)(1p) (4)*
P(Yi 1)
p (1 p)
p (5)*
P(Yi 1)
(2p 1) (1 p) (6)*
P(Yi 1) c d
(7)13
Triangular Model
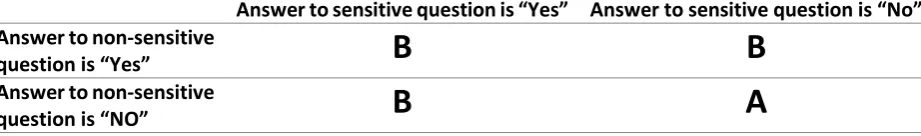
[image:14.595.73.534.282.350.2]The Triangular model differs in the way of answering with an A or a B from the Crosswise method. For the Triangular method the respondent answers an A if the answer to both questions is no and for any other scenario the respond answers with a B, for visual representation see Table 3. To clarify the way this works, imagine that an answer needs to be given for each question, the sensitive question and the non-sensitive question. An affirmative answer to one of these questions could be represented by an 1 and a negative answer by a 0. If the response for both questions is negative a single answer A will be given as a reply to the researcher or the form by the respondent. If the answers differ for either questions or are both affirmative a B will be given as reply by the respondent.
Table 3
Response model for Triangular model
Answer to sensitive question is “Yes” Answer to sensitive question is “No” Answer to non-sensitive
question is “Yes”
B
B
Answer to non-sensitive
question is “NO”
B
A
Table 4
Character descriptions for the Triangular Model
Proportion of population having sensitive characteristic
Proportion that has non sensitive characteristic
Number of respondents
Answer A (both no)
Answer B (at least one “Yes”)
Expected proport
P
n
A
B
^ ^ion of answers A in population
Estimated proportion of population having sensitive characteristic
Observed proportion of answers A in population A / n
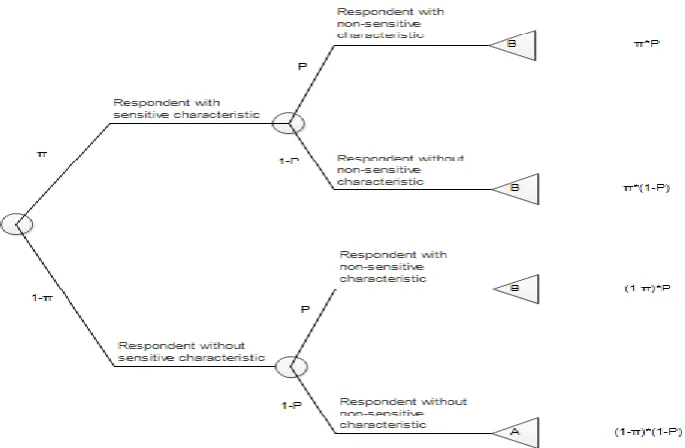
The probability that a respondent answers either an A or a B can be visually represented by the probability tree that is given in Figure 2. The Maximum Likelihood Estimate (MLE) of the proportion of subjects having the sensitive characteristic is expressed in Equation 8
^ ^ 1 1 p
π (8)and the associated variance in Equation 9. Table 4 explains the symbols that are used.
14 Figure 2. Probability tree for the Triangular Model
For the Triangular method the population estimate of the sensitive characteristic can be calculated given the prevalence of the non-sensitive characteristic.
The Triangular method can be described as a randomized response model. Let *
P(Yi 1) represents
the probability of an observed affirmative answer, in this case answer B. Let
P(
Y
i
1)
represents the probability of an affirmative answer, represented by
. From the probability tree of the triangular model follows that the probability of observing response B equals*
P(Yi 1)
p
(1p) (1
)p (10) *P(Yi 1)
p
p p p
(11)*
P(Yi 1)
(1p)p (12)*
P(Yi 1) c d
(13)15
Comparing Models
The MLE for the Crosswise model shows a striking resemblance to the MLE of Warner’s original model. The only difference is the variance term in the denominator. The way in which this varies means that the denominator in the variance of the MLE for the Crosswise model will always be smaller for the same numerator compared to Warner’s model (both Equations are given in Table 5). This implies that the variance will always be higher for the Crosswise model then for Warner’s model. This is the price paid for excluding a randomizing device and trying to increase the validity of the data collection method. The estimator under the crosswise method will have a larger variance than the estimator under Warner’s method. Because it is advisable to use large samples when collecting data with either method the difference in the variance will not be overwhelming in practice.
Table 5
Variance of the MLE for Crosswise model and Warner's model
Variance of the MLE in Crosswise model Variance of the MLE in Warner’s model
^ ^ ^
2
(1 ) (1 )
var( )
1 ( 1)(2 1)
P P
n n P
^ ^ ^ 2(1 ) (1 )
var( )
(2 1)
P P
n n P
Problem Description and Proposed Solution
Problem Description
The main problem is that it is desirable to be able to gain valid and reliable information about sensitive subjects but methods currently used are not quite able to meet that demand entirely. The main problem is bias in responses and several approaches have been described to reduce this bias. The randomized response models seem to have potential in making questionnaires on sensitive subjects more valid. To allow researchers to infer more from their data it is desirable to allow multivariate analysis on the collected data. Finally in some settings (e.g. questionnaires in hospitals) individual inferences for the sensitive variable are wanted so methods of analysis for these individual inferences are appropriate.
Proposed Solution
The proposed solution to exclude randomizing devices is to use the methods by Yu et al. (2008). To be able to regress the responses to question on explanatory variables, a logistic model is needed. A normal way to transform binary data is by using the logit function represented by
0 1 P( 1) log( ) P( 0) i i i Y x
Y
(14)
16
Logistic Regression for Univariate Randomized Responses
To use this model for randomized response data some additional variables need to be added. An overview of the meaning of all used symbols in this section will be given in Table 6.
Table 6
Character descriptions for logistic modeling of randomized response data
* * *
0 1
Probability of a forced af
binary dependent variable (Y=
firmative answer
Probabili
1 v Y=0)
true binary (sens
ty of a truthful answe
itive) va
r
riable (Y =1 v Y =0)
Predictor
Intercept
Regressi
Y
Y
c
d
x
on coefficient of predictor
p = Probability for the randomization
index referring to respondent i
= index referring to question number
i
k
k
The objective is to model the relation between the latent sensitive variable and one or more predictors. Since the collected data is binary, a logistic transformation is used and a standard way to transform this kind of data is the logit function that is given in Equation 14. For further reference we call this the
(
( ))
i17 To “free” the data of the influence of the randomized response method we can, through the use of the inverse of Equation 15, create a link function that can be seen in Equation 19 (for more detail, see Equations 16-18). For further reference we shall call this link function to measure the randomized response properties
log( (
g odds Y
( )))
i , because it is a logistic transformation of the function g on the odds of variable Y to account for the randomized response properties of the data.*
P(Yi 1) c d* P(Yi 1) (15)
*
P(
1)
P(
1)
(
i)
i
Y
c
Y
d
(16)*
P(
1)
P(
0) 1 P(
1)
ii i
d
Y
c
Y
Y
d
(17)*
*
* *
P( 1)
P( 1) P( 1)
log( ) log( ) log( )
P( 1)
P( 0) P( 1)
Y c
Y d Y c
d Y c
Y d Y c
d
(18)
* *
P( 1)
log( ( ( ))) log( )
P( 1)
i i
i
Y c
g odds Y
d Y c
(19)
Parameters c and d are defined by the randomized response method, where each method has specific values for these parameters. For the purpose of this paper the parameters c and d will be given for the Crosswise- and Triangular method.
In case of the Crosswise method the value for c is given by c=1-p and the value for d is given by d= 2p-1. For a more detailed explanation see Equations 4-7.
In case of the Triangular method the value for c is given by c=p and the value for d is given by d=1-p. For a more detailed explanation see Equations 10-13.
18
Logistic Regression for Multivariate Randomized Response Data
By asking more questions more data will become available to be analyzed and this will allow researchers to predict more accurately the prevalence or chance of exhibiting specific sensitive behavior. The answers to these questions are dependent on the latent sensitive variable. By using the generalized linear model, the use of multiple dependent variables becomes available as an option. By stacking the answers to multiple questions we can use the following model:
0 1
log( (
g odds Y
(
ik)))
k
kx
i (20)By using the
log( (
g odds Y
(
ik)))
answers to multiple question can be stacked while the model still accounts for the modified chances that are observed because of the randomized response. The dummy coding is applied to the questions so the predicting value for each question can be analyzed as well as the added value to the model.By analyzing the data in the way described above it is possible to gain more flexible models for predictors for a latent sensitive variable.
In theory the data can be used in a different way to allow inferences about individual answering patterns. This can be done by using the dummy coding not to code the questions but to code the answers of different respondents. The model would look a little bit differently than the previous model and can be seen in Equation 21.
0 1
log( (
g odds Y
(
ik)))
i
i ix
(21)To illustrate, consider the following example questionnaire containing two questions answered by two respondents. The dummy coding is represented by variable Z. When coding a question, a variable Z takes on a value of 1 for all answers to question 1, and a value of 0 for all other questions.
1 1
0 1
ik ik
Z k
Z k
(22)
When coding respondents, the same technique can be used, except the value for Z is determined by the value of i instead of the value for k (see Equation 23).
1 1
0 1
ik ik
Z i
Z i
(23)
19
Data Analysis
To illustrate the logistic regression modeling of data retrieved by the Crosswise method, data collected by Jann et al. (2012) under the Crosswise method, were analyzed. The data used in the analysis where answers of 310 respondents to two questions about plagiarism. The first question inquired about partial plagiarism and the second question inquired about severe plagiarism. Both questions about plagiarism where paired with a non-sensitive question that had an estimated prevalence of 25%. For full details on the questions and the data collection methods see Jann et al. (2012).
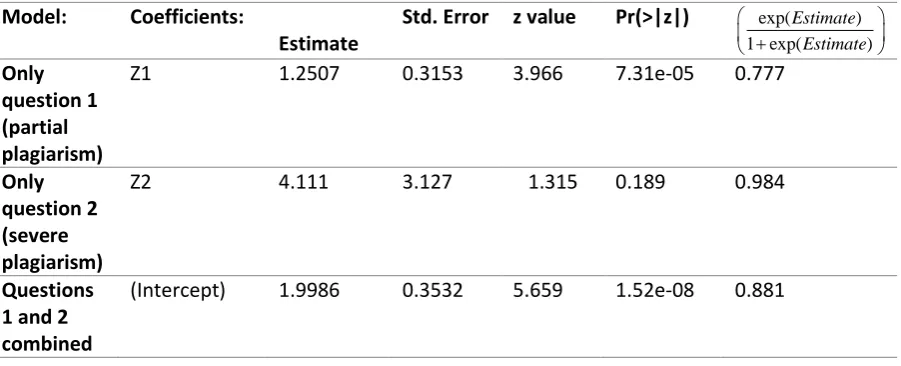
[image:20.595.70.521.281.464.2]It was investigated whether the estimated proportions of true affirmative answers differed across the two items, which was to be expected since they enquire about different levels of severity of the behavior.
Table 7
Intercepts for questions one, two and the combined intercept
Model: Coefficients:
Estimate
Std. Error z value Pr(>|z|) exp( )
1 exp( )
Estimate Estimate Only question 1 (partial plagiarism)
Z1 1.2507 0.3153 3.966 7.31e-05 0.777
Only question 2 (severe plagiarism)
Z2 4.111 3.127 1.315 0.189 0.984
Questions 1 and 2 combined
(Intercept) 1.9986 0.3532 5.659 1.52e-08 0.881
What could be observed from the results shown in Table 7, a significant intercept was estimated for question one and for question two. These values can be interpreted to determine the estimated prevalence of the latent variable and the values for these estimates are given in the last column of Table 7. Because of the properties of this specific randomized response model the chances of failure was modeled. To gain the prevalence of the latent sensitive variable, the expression in Equation 24 was used.
exp( )
1
1 exp( )
Estimate Estimate
(24)
A significant prediction of the population estimate for question one was found with a value of 0.223 and for question two an estimate of 0.016 was found but was not significant. This was the same as established by Jann et al.
20 The reason that analyzing question two by itself does not result in a significant effect is explained by Jann et al. (2012) by the fact that for the Crosswise model, as for most randomized response models, the variance increases greatly when the population estimates come closer to zero or one. As the population estimation for question two was estimated at a prevalence of 0.016 this is very close to zero and explains why the answers to this question did not allow for a significant model.
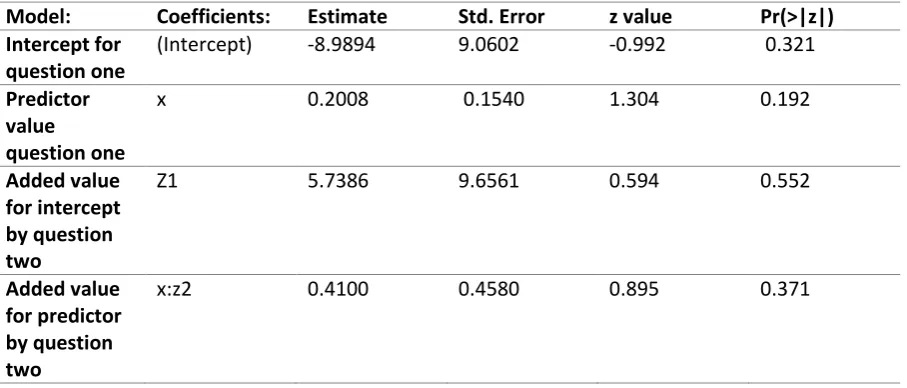
[image:21.595.68.522.305.499.2]When looking at the predictors for the latent sensitive variable Jann et al. (2012) did not find any significant (p<0.05) effect of the predictors for the first question. The second question, for previously mentioned reasons, would not reveal very significant results either. But what could be shown is how an analysis for predictors could be made. Table 8 shows how a model for the predictor age has been drawn up for question one and what can be added to the model by question two. The results are not significant but it shows that it is possible to analyze data of multiple questions which were gathered by the Crosswise method.
Table 8
Model of age as predictor using data from question one and two
Model: Coefficients: Estimate Std. Error z value Pr(>|z|)
Intercept for question one
(Intercept) -8.9894 9.0602 -0.992 0.321
Predictor value
question one
x 0.2008 0.1540 1.304 0.192
Added value for intercept by question two
Z1 5.7386 9.6561 0.594 0.552
Added value for predictor by question two
x:z2 0.4100 0.4580 0.895 0.371
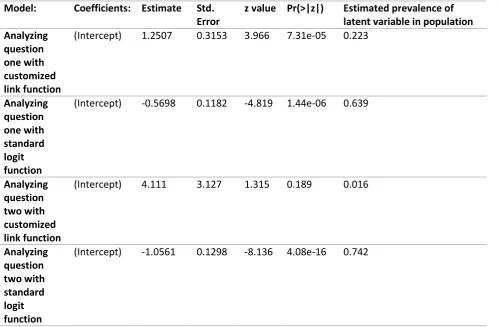
21 Table 9 shows the difference between modeling the answers to questions one and two with the customized link function and with the standard logit function. To allow researchers to draw valid conclusions from the data one has to account for the randomized response properties of the data collection method. If these properties were not known and the standard logit function would be used to analyze the data wrong inferences would be made. When looking at question two for example (see Table 9), not only would the researcher find a high prevalence instead of a very low prevalence, he would also infer that this is statistically very significant. In short the observed chances do not tell the true story about the data. However if the researcher would have accounted for the properties of the randomized response data collection method, by using the customized link function, the expected estimates could be derived.
[image:22.595.67.567.334.661.2]Table 9 shows how data could have been interpreted wrongly if the wrong link function would have been used during the analysis with logistic regression in contrast to analysis done with the correct customized link function. In the last column the population estimates for the prevalence of the latent sensitive variable is given (this is done by using Equation 24).
Table 9
Difference in analyzing data with customized- or standard link function
Model: Coefficients: Estimate Std.
Error
z value Pr(>|z|) Estimated prevalence of latent variable in population Analyzing
question one with customized link function
(Intercept) 1.2507 0.3153 3.966 7.31e-05 0.223
Analyzing question one with standard logit function
(Intercept) -0.5698 0.1182 -4.819 1.44e-06 0.639
Analyzing question two with customized link function
(Intercept) 4.111 3.127 1.315 0.189 0.016
Analyzing question two with standard logit function
22
Discussion
It has been shown that the Crosswise- and Triangular model belong to the framework of the randomized response methods. Also ways of data analysis have been shown that allow individual inferences to be made and multivariate analysis to be done based on data collected using randomized response methods, including the Crosswise- and Triangular method. Whether or not this will result in the reduction of bias in the observed estimates and reduce the amount of misreporting for questionnaires with sensitive subjects has yet to be investigated.
One of the reasons that it was desirable to exclude the randomizing device from the randomized response procedure was to reduce the non-response rates in self-administered surveys. It is expected, but also unclear due to lack of research, that this method will reduce non-response rates for surveys in comparison to surveys that do use a randomizing device.
As mentioned before the reason that randomized response methods for obtaining data on sensitive subjects are used is to reduce the bias in the answers given on the questions. However there is evidence that despite the superior performance of randomized response procedures compared to direct questioning even the randomized response procedures still result in serious underreporting (van der Heijden, van Gils, Bouts, & Hox, 2000). Because of this evidence researchers should not consider randomized response methods to be without flaws and may need to account for these flaws. Böckenholt and van der Heijden (2004) described a method introducing additional components to an item response theory model to account for respondent who still does not provide truthful answers. The aforementioned method is not the only description of models trying to extend their description to incorporate respondents that do not follow the instructions of the randomized response method (e.g. (Böckenholt & van der Heijden, 2007; van den Hout, Gilchrist, & van der Heijden, 2010)). The method for data collection that has been proposed in this paper does not incorporate an adjustment for non-compliance with the instructions of the randomized response method. This might be a flaw in the method and could perhaps be accounted for in later adjustments of this method.
23 To be sure whether or not an adjustment of the model needs to be made, the model should first be tested with real data collection. Even then there is still the question and challenge of how to check if the collected data represents the reality correctly. To check how a data collection method performs true scores of respondents need to be obtained, which can be very challenging. A problem that seems to exist with a lot of subjects is that it is hard or impossible to get a “true” score of a respondent, for instance how do you get a true score of a personality trait? Or how do you rate how nice someone is to their neighbors? Concerning socially desirable questions Tourangeau and Yan (2007) argue it is a great problem that you cannot distinguish between respondents that are truly compliant with the social norms, respondents that truly think they are compliant with the social norms but in fact are not and respondents who consciously deceive in their answers.
Luckily for research methodologist there are quite a few characteristics or actions of people that can be measured and their true scores can be derived. This allows researchers to measure the error or bias in their respondent’s answers and allows them to check how well the data collection method performs, thereby allowing the use of the best methods for subjects on which true scores cannot be derived. An example of a true score on an aggregated level could be the prevalence of voting behavior. Belli, Traugott and Beckmann (2001) found that when comparing individual survey reports for voting behavior against actual voting record, people claim to vote a lot more often than they actually vote. Because the actual records for voting are not (usually) disputable they can be counted as true scores for population estimates. When looking at individual scores an example of deriving true scores can be given when reviewing the research Fox, Avetisyan and van der Palen (2013). They used a carbon monoxide monitor to determine the true smoking status of the patients that had answered their questions.
Randomized response data collection methods might turn out to produce less of an error due to bias but they still produce quite a high variance. Why would one voluntarily choose a method with higher variance one could wonder? In this paper the Crosswise model was set against Warner’s original model and it turned out to have a slightly higher variance for the same MLE calculations. This was accepted because this was a trade-off for excluding the randomizing device which is expected to reduce bias. So in this case, and this a compelling reason to accept higher variance, the validity of the collected data is expected to increase and to do so a bit of the reliability of the collected data needs to be sacrificed.
24 To conclude this discussion a few remarks are given on what sense can be made of the actual data that was available for analysis. The data that was obtained from Jann et al. (2012) did not reveal too many surprises but it allowed the opportunity to actually show that it is possible to analyze multiple questions from a Crosswise design together. The method shows problems that are not uncommon or unexpected with randomized response methods. The fact that the model has difficulty performing when the population estimate of the latent sensitive variable approaches a value of zero or one is not surprising but it is nonetheless troublesome. It remains clear that when collection of data is done with randomized response procedures very large sample sizes are needed to allow proper analysis.
25
Appendix A:
R Code for the Link Function for Logistic Transformation of Randomized Response Data
RRlog <- function() {
## link
linkfun <- function(y) log((y-c)/(c+d-y))
## inverse link
linkinv <- function(eta) c + d*(exp(eta)/(1+exp(eta)))
## derivative of invlink wrt eta
mu.eta <- function(eta) {d*exp(-eta)/((1+exp(-eta))**2)}
valideta <- function(eta) TRUE
link <- "RRlogit"
structure(list(linkfun = linkfun, linkinv = linkinv,
mu.eta = mu.eta, valideta = valideta,
26
Appendix B:
R Code for the Link Function and Dummy Coding for Multivariate Analysis
#analysis data RR#link function
vv <- function(c,d) {
## link
linkfun <- function(y) log((y-c)/(c+d-y))
## inverse link
linkinv <- function(eta) c + d*(exp(eta)/(1+exp(eta)))
## derivative of invlink wrt eta
mu.eta <- function(eta) {d*exp(-eta)/((1+exp(-eta))**2)}
valideta <- function(eta) TRUE
link <- "RRlogit"
structure(list(linkfun = linkfun, linkinv = linkinv,
mu.eta = mu.eta, valideta = valideta,
name = link),class = "link-glm")
}
#variables for data analysis
x <- c(..,..) #insert predictor
n <- 310 #n respondents answered questions, 310 in this example
z1 <- rep(0,2*n)
z2 <- rep(0,2*n)
z1[1:310] <- 1
z2[311:620] <- 1 #dummy coding example
y <- c(..,..) #stacking answers to questions 1 and 2
out <- glm(y~...,start=c(...),family=binomial(link=vv(c=...,d=...)))
#insert glm model you want to run
summary(out)
27
References
Avetisyan, M. (2012). Introduction. In M. Avetisyan, Bayesian randomized item response modeling for sensitive measurements (pp. 1-8). Enschede: Ipskamp drukkers B.V.
Babbie, E. (2010). Chapter 9: Survey Research. In E. Babbie, The practice of social research (pp. 253-294). Wadsworth: Cengage Learning.
Belli, R. F., Traugott, M. W., & Beckmann, M. N. (2001). What Leads to Voting Overreports? Contrasts of Overreporters to Validated Voters and Admitted Nonvoters in the American National Election Studies. Journal of Official Statistics, 17(4), 479-498.
Böckenholt, U., & van der Heijden, P. G. (2004). Measuring noncompliance in insurance benefit regulations with randomized response methods for multiple items. 19th international workshop on statistical modelling, (pp. 106-110).
Böckenholt, U., & van der Heijden, P. G. (2007). Item randomized-response models for measuring noncompliance: Risk-return perceptions, social influences, and self-protective responses. Psychometrika, 72(2), 245-262.
Boruch, R. F. (1971). Assuring confidentiality of responses in social research: A note on strategies. The american sociologist, 6, 308-311.
Cohen, L., Manion, L., & Morrison, K. (2007). Surveys, longitudinal, cross-sectional and trend studies. In L. Cohen, L. Manion, & K. Morrison, Research methods in education (pp. 205-225). Oxon: Routledge.
Coutts, E., & Jann, B. (2011). Sensitive Questions in Online Surveys: Experimental Results for the Randomized Response Technique and the Unmatched Count Technique. Sociological Methods & Research, 40(1), 169-193.
Droitcour, J., Hubbard, M. L., Caspar, R. A., Parsley, T. L., Visscher, W., & Ezzati, T. M. (1991). The Item Count Technique as a Method of Indirect Questioning: A Review of Its Development and a Case Study Application. In P. p. Biemer, R. M. Groves, L. E. Lyberg, N. A. Mathiowetz, & S. Sudman, Measurement errors in Surveys (pp. 185-210). New York: John Wiley & sons, inc.
Fox, Avetisyan, & van der Palen. (2013). Mixture randomized item-response modeling: a smoking behavior validation study. Statistics in Medicine. doi:10.1002/sim.5859
Greenberg, B. G., Abul-Ela, A.-L. A., Simmons, W. R., & Horvitz, D. G. (1969). The Unrelated Question Randomized Response Model: Theoretical Framework. Journal of the American Statistical Association, 64(326), 520-539.
Hochstim, J. R. (1967). A Critical Comparison of Three Strategies of Collecting Data from Households. Journal of the American Statistical Association, 62(319), 976-989.
Infofilter, S. (2012). Bel-me-niet Register. Retrieved from https://www.bel-me-niet.nl/
Jann, B., Jerke, J., & Krumpal, I. (2012). Asking sensitive questions using the crosswise model. Public opinion quarterly, 1-18.
Jones, E. E., & Sigall, H. (1971). The bogus pipeline: a new paradigm for measuring affect and attitude. Psychological bulletin, 76(5), 349-364.
28 Lee, R. M. (1993). Asking sensitive questions in surveys. In R. M. Lee, Doing research on sensitive topics
(pp. 75-96). Sage Publications ltd.
Miller, J. D. (1984). The new technique: estimation logic, design options, and research plan. In J. D. Miller, A new survey technique for studying deviant behavior.
Singer, E., Mathiowetz, N. A., & Couper, M. P. (1993). The Impact of Privacy and Confidentiality Concerns on Survey Participation. The Public Opinion Quarterly, 57(4), 465-482.
Tourangeau, R., & Yan, T. (2007). Sensitive Questions in Surveys. Psychological Bulletin, 133(5), 859-883.
Tourangeau, R., Rips, L. J., & Rasinski, K. (2000). Editing of responses: Reporting about sensitive topics. In R. Tourangeau, L. J. Rips, & K. Rasinski, The psychology of survey response (pp. 255-288). New York: Cambridge university press.
van den Hout, A., Gilchrist, R., & van der Heijden, P. G. (2010). The randomized response log linear model as a composite link model. Statistical Modelling, 10(1), 57-67.
van der Heijden, P. G., van Gils, G., Bouts, J., & Hox, J. J. (2000). A comparison of randomized response, CASAQ, and direct questioning; eliciting sensitive information in the context of welfare and unemployment benefit. Sociological Methods and Research, 28, 505-537.
van der Hout, A., van der Heijden, P., & Gilchrist, R. (2007). The logistic regression model with response variables subject to randomizcd response. Computational statistics & data analysis, 51, 6060-6069.
Warner, S. L. (1965). Randomized Response: A survey technique for eliminating evasive answer bias. Journal of the american statistical association, 60(309), 63-69.
Willis, G. B. (1997). The use of the psychological laboratory to study sensitive survey topics. In L. Harrison, & A. Hughes, The Validity of Self-Reported Drug Use: Improving the Accuracy of Survey Estimates (pp. 416-438). Rockville: National Institute on Drug Abuse.