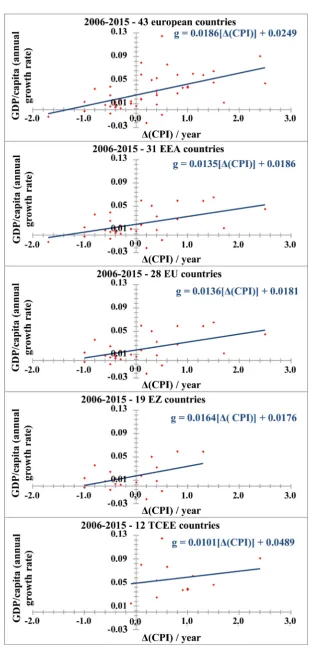
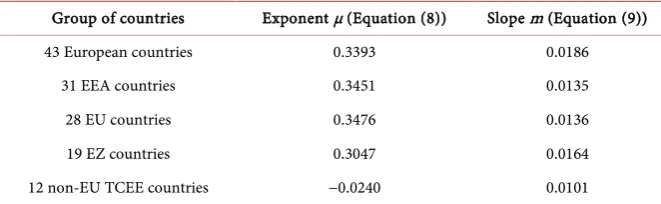
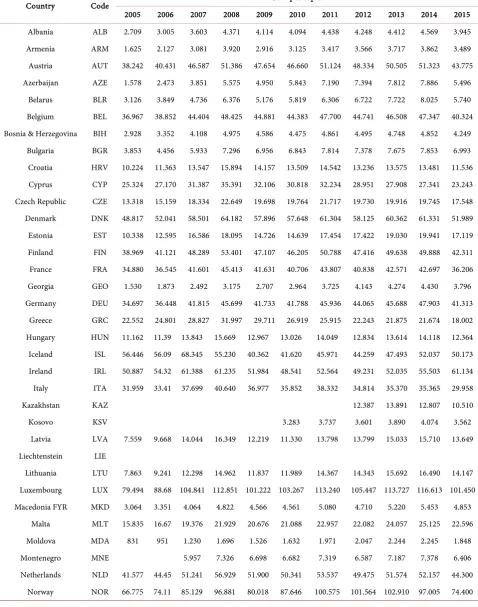
Corruption Perception Index (CPI), as an Index of Economic Growth for European Countries
Full text
Figure


Related documents
Server consolidation project: Exchange 2007 implementation, vmware infrastructure setup (2009-FWO Vlaanderen). Network optimization project: Belgacom Explore
In spite of—and in some cases because of—the prolonged tensions between the Roman and Sasanian empires, trade and travel between the rival powers fostered
Whether the engi- neering problem at hand is to mitigate risk for a bridge at a fixed location, optimal placement of a new bridge to minimize scour risk within design constraints,
For example, after you launch ANSYS Meshing from the Mesh cell in a Fluid Flow (Fluent) analysis system that has a valid geometry, the Mesh cell appears as Update Required because
This is the same effectiveness estimate as found in the synopsis (Nieuwkamp et al., 2017). There is no 95% confidence interval, but according to the authors “ there is consensus
As we can see, extrinsic city space characterized by different than those of characters’ identities features and layers makes them react in a very strict
This is precisely why the West’s imperialist intrusions and contaminations of the indigenous West African criminology and social control systems are particularly
If the weight of a particle weight entering a cell region (either spatially through a boundary or from one energy range to another by scattering inside a cell) is below the
