Sander G. Lommers
s0176893
Master thesis
Optimizing a dairy multinational’s
inventory control policy
University of Twente FrieslandCampina Domo Faculty of Management & Governance
Postbus 217 P.O. Box 8
7500 AE Enschede 9410 AA Beilen
Masterthesis – FrieslandCampina Domo
“Optimizing a dairy multinational’s inventory control policy”
Author
Sander G. Lommers
Supervisor FrieslandCampina Domo
M.A.C. Heemskerk - Manager Business Office
Supervisor University of Twente
Dr. M.C. van der Heijden - Associate Professor
Management summary
Research motivation
Due to the significant profit losses caused by perished inventory, Domo Beilen sees possibilities for inventory control improvements. Yet, perished inventory is not the only problem. In contrast, there can be insufficient inventory. Shortage of raw materials can cause production stops. Hence, the required end products cannot be produced in time. As the demand exceeds the supply, this results in huge opportunity cost losses.
Domo Beilen is bothered by an inefficient inventory control, resulting in both lacking raw materials (understock) and having redundant raw materials (overstock).
Research objective
Optimize the raw materials’ inventory control of Domo Beilen. In particular, redefine the replenishment policy, the safety stock levels, and designate the most critical raw materials.
Scope
The scope of the research is on the main tasks of the Business Office, i.e. work preparation and
production scheduling, and concerns all ingredients delivered by external suppliers, being around 200 ingredients.
Current situation
Safety stocks are determined using an inadequately model and inappropriate input. The raw material inventory is worth on average 22 million Euros, because additional raw materials are purchased to buffer against undefined uncertainties. There is no clear distinction in importance of the Stock Keeping Units (SKUs). The yearly obsolescence costs amount around 315.000 Euros. Further, discount prices are not actively used in determining order sizes.
Redesigned inventory control policy
The purchasers get an improved safety stock model. With the improved safety stock model, the purchasers do not have to purchase additional raw materials based on their insight to prevent for stockouts. With the new safety stock model just 1% of the replenishment orders will result in a (temporarily) stockout. Assuming there are 1100 purchase orders sent per year, there are 11 stockouts, per year. Due to the entrance inspection lead times of the raw material it is known at least two weeks before the planned production. Hence, just as today, the planning can be adjusted to prevent no-production periods. Currently, the detailed planning is adjusted far more than 11 times per year.
Further, a distinction is made regarding the safety stock determination between intermittent demand and non-intermittent demand. The intermittent demand will not get a safety stock quantity
Savings
The working capital captured in the raw material inventories can be reduced to approximately 14.4 million Euros. Compared to the current inventory of 22 million Euros, this is a saving of 7.6 million Euros on working capital. Assuming a carry cost rate of 19%, this will save yearly 1.4 million Euros. The obsolescence costs can be reduced with approximately 75% to 80.000 Euros, instead of 315.000 Euros. The usage of quantity discount will save another 250.000 Euros on yearly basis.
Hence, the total proposed savings amount around 1.700.000 Euros per year.
Recommendations
We advise to implement the calculated safety stock quantities in SAP and to update the safety stock level every three months. Due to changing forecast errors, lead times, and in and out phasing the safety stocks should be reassessed regularly. Further, determine optimal order sizes regarding the quantity discounts. Anticipate timely on expiring inventories using the SLED-anticipation tool. Reassess the safety stocks, inspection lead times and optimal order quantities every quarter, to maintain the inventory control policy up-to-date. Comply with the new inventory control policy, it forms a basis for making decisions and will provide clarity for Domo’s entire supply chain.
Further research
Develop a phasing out procedure for raw materials. Currently, the communication about the ending demand for available inventories is limited, causing unnecessary holding costs. Develop a procedure for phasing out raw materials, including responsibilities and time frames, such that every relevant person knows what is coming and that unnecessary costs are minimized.
Preface
Two years ago, I wanted to experience the way of working within a small production organization. Therefore, I finalized my bachelor’s degree with an assignment at a small enterprise. The drive and dedication the people showed me there, formed a great experience for my career and life. Now, two years later, I wanted to show my drive and dedication in a large enterprise. FrieslandCampina gave me the opportunity to improve their business processes. I suggested several research areas to a manager of Domo Beilen and he said: “Yes, the replenishing of raw materials could be improved. Our obsolescence costs are increasing.” That meeting formed the basis for this master thesis.
With this thesis I finalize my master Industrial Engineering and Management with a specialization in Production and Logistics Management at University Twente. I would like to acknowledge all people that contributed to fulfilling my master’s degree. Even to the people who I will not mention by name; I am thankful for your interest and advices.
I would like to thank all lecturers of University Twente for their work. In particular Matthieu and Leo, who supervised me during my master’s assignment. I am grateful to all lecturers for sharing their knowledge, experience and insights with younger people. Knowledge is one of the things you can multiply by sharing it.
I would like to thank Mathijs for his believe in my abilities. He is a capable supervisor, who gave me the idea that my ideas are useful and he supported me in bringing them into practice.
I will say thanks to all employees of FrieslandCampina Domo Beilen, meanwhile my colleagues, for their help. I always felt welcome and I would like to forward that feeling also to my current and future colleagues.
Thanks, to my parents for creating the conditions to study carefree. You are in multiple disciplines a role model for me.
Finally, a special thanks to my wife Johanneke. She brought endless patience, while I was working on my thesis. – Yes, this also says something about the effort I had to bring– I am grateful for her encouragements, especially when I had enough it for a while. I wish that she will support me in all my future activities, as she has done during this assignment.
I am ready to take the next challenge.
Sander Lommers
Table of Contents
Management summary ... ii
Preface ... iv
List of Figures ... x
List of Tables ... x
List of Abbreviations ... xii
1 Introduction ... 2
1.1 Company description ... 2
1.2 Research motivation ... 4
1.3 Problem description ... 4
2 Research design ... 6
2.1 Research approach ... 6
2.2 Research objective and scope ... 6
2.3 Research questions ... 7
2.4 Research methodology ... 8
3 Current situation ... 10
3.1 Customer order fulfillment ... 10
3.2 Production process ... 13
3.3 Replenishment process ... 16
Replenishment policy ... 16
3.3.1 Uncertainties in replenishing raw materials... 19
3.3.2 Safety stock review ... 21
3.3.3 3.4 SKU characteristics raw materials ... 24
3.5 Performance and current inventory ... 27
3.6 Conclusion ... 29
4 Literature review ... 32
4.1 SKU classification ... 32
4.2 Inventory control policies ... 34
Stock types and their trade-offs ... 34
4.2.1 Inventory control policies ... 37
4.2.2 Standard deviation of the forecast error σ ... 38
4.2.3 Lot sizing for intermittent demand ... 38
5 Redesign inventory control policy ... 42
5.1 SKU classification ... 42
Importance classification ... 42
5.1.1 Safety stock classification ... 43
5.1.2 5.2 Safety stock... 43
Unpredictable variance in demand ... 44
5.2.1 Replenishment lead time... 45
5.2.2 Intermittent demand ... 46
5.2.3 5.3 Cycle stock ... 46
5.4 Anticipation on expiring inventories ... 48
5.5 Conclusion ... 49
6 Savings and contributions ... 52
6.1 Savings ... 52
The working capital ... 52
6.1.1 Quantity discount savings ... 53
6.1.2 Obsolescence savings ... 54
6.1.3 6.2 Other contributions ... 54
Overview planning adjustments ... 54
6.2.1 Insight to inspection durations ... 56
6.2.2 7 Implementation ... 58
7.1 Implementation approach ... 58
7.2 Ready to use ... 58
7.3 Quality assurance ... 59
8 Conclusions and recommendations ... 60
Appendix A – Organizational chart ... 66
Appendix B – SLED anticipation ... 67
Appendix C – Current safety stock review model ... 68
Appendix D – Number of weeks with expected requirements ... 71
List of Figures
Figure 1.1 – Key figures of Royal FrieslandCampina NV (Annual Report, 2012) ... 2
Figure 1.2 - One of Domo's IFT-nutrition products ... 3
Figure 1.3 – High level overview of Domo Beilen's production process of child nutrition ... 3
Figure 3.1 – Customer order fulfillment dependencies within Supply Point Beilen ... 11
Figure 3.2 – Customer order fulfillment (detailed) ... 12
Figure 3.3 – Combinations of ingredients during the production process of the consumer products . 15 Figure 3.4 - SKU Shelf lives ... 26
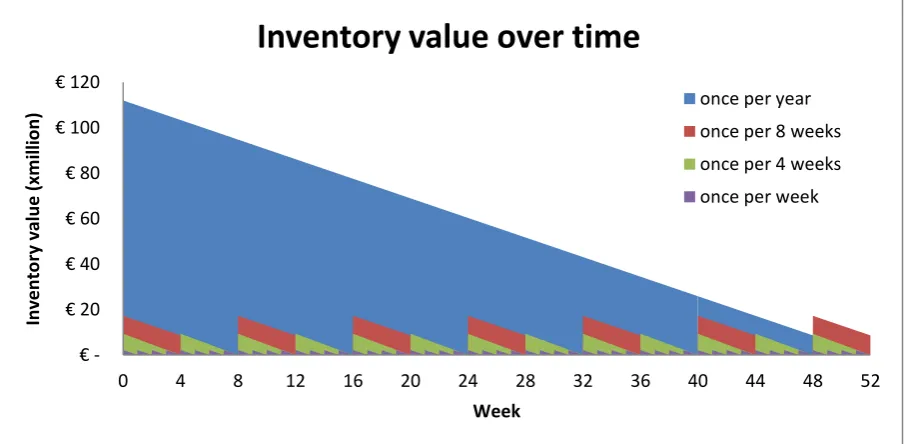
Figure 3.5 – The amount of replenishments per period influence the average cycle stock value ... 28
Figure 4.1 - The Total Relevant Cost function (convex function) ... 36
Figure 5.1 - Illustration of the relevant forecast error ... 44
Figure 5.2 - Yearly Total Releavant Costs ... 48
Figure 5.3 - SKU classification on importance ... 49
Figure 5.4 - SKU classification for determining safety stocks ... 49
Figure 7.1 - Implementation of reorganized inventory control policy ... 58
Figure A.1 - Organizational chart of FrieslandCampina (constricted) ... 66
Figure E.1 - Literature search methodology (SKU classification)... 73
List of Tables
Table 2.1 – Research methodologies used ... 9Table 3.1 – Preparation periods of ingredients ... 14
Table 3.2 - Abbreviations inventory policy ... 16
Table 3.3 - Current inventory control policies ... 16
Table 3.4 – Example of purchase requisition (21-10-2014) proposed by SAP ... 17
Table 3.5 – Entrance inspection lead time in practice ... 20
Table 3.6 - Safety factor allocation ... 23
Table 3.7 - XYZ-class sizes and their CV thresholds ... 24
Table 3.8 - Characteristics of SKUs with the longest replenishment lead times ... 26
Table 3.9 - Replenishment lead times ... 26
Table 3.10 – The amount of replenishments influence the average cycle stock ... 28
Table 3.11 - Conclusions regarding the current situation ... 29
Table 4.1 – Multiple inventory classification (Flores, Olson, & Dorai, 1992) ... 33
Table 4.2 - SKU classification methodologies ... 34
Table 4.3 - Parameters ... 35
Table 4.4 - Inventory control policies ... 37
Table 5.1 - Classification relevant for the replenishment policy ... 43
Table 5.2 - Classification relevant for the safety stock determination ... 43
Table 5.3 - Realistic lead times ... 46
Table 5.4- Break points and their Total Relevant Costs ... 47
Table 6.1 - Price classes ... 53
Table 6.2 – Actual costs of purchasing this SKU during 2013 ... 53
Table 6.4 - Planning overview tool ... 55
Table C.1 - SKU characteristics used for the Safety Stock Review... 68
Table C.2 - Allocation of Allowed Weeks Coverage value ... 70
List of Abbreviations
Abbreviation Explanation
AMMP Agglomeraat Magere Melk Poeder
(English: agglomerate skimmed milk powder) B2B Business to business
B2C Business to consumers
CV Coefficient of Variation
Domo Dutch company name: Drentse onder-melk organisatie ERP Enterprise Resource System
Eq. Equation
HPP Masterplan
(Dutch: Hoofd Productie Plan) i.e. ‘Id est’ – that is/ in other words IEM Industrial Engineering & Management IFT Infant, Follow-up, and Toddler (nutrition) Mgt. Management
MRP Materials Requirement Plan(ning)
MTO Make-To-Order;
Only raw materials and components are kept in stock. Every customer is a specific project. OWC Demineralized Whey Concentrate
(Dutch: Ontzoute Wei Concentraat)
PO Purchase Order
PKV Poeder Klein-Verpakkingen afdeling (English: Packaging department) R&D Research & Development
RM Raw Materials
RMO Rijdende Melk Ontvangst (English: Milk transport)
SAP German company name: Systeme, Anwendungen und Produkte in der Datenverarbeitung
SKU Stock Keeping Unit
SLED Shelf Life Expiration Date SPB Supply Point Beilen
VMI Vendor Managed Inventory
1
Introduction
This thesis serves as milestone for finalizing my master Industrial Engineering and Management. The first chapter provides an insight in the subject of the research. Section 1.1 introduces the company and the local activities. Section 1.2 explains the motivation of research. Finally, Section 1.3 presents the problem description, which serves as basis for this research.
1.1
Company description
Royal FrieslandCampina NV and Domo Beilen
Since December 30th, 2008, Royal FrieslandCampina is a merger of Friesland Foods and Campina. The organization is one of the five largest dairy companies in the world. FrieslandCampina is composed of various dairy corporations and one of them is Domo. On its turn, Domo consists of six factories, including Domo Beilen (province Drenthe). Domo Beilen is a former milk powder manufacturer. Nowadays, Domo Beilen produces child nutrition. Within the company, the child nutrition is called IFT, which stands for Infant, Follow-up, and Toddler nutrition. Figure 1.1 depicts the key figures of Royal FrieslandCampina in 2012. Please note: the figures involve all corporations within FrieslandCampina and Domo is one of them. The Domo division is responsible for 1400 FTEs and yielded €788 million during 2012 (FrieslandCampina Domo, 2013).
Domo Beilen
Beilen is the location of fulfilling my graduation assignment for my master program Industrial Engineering and Management (IEM). Appendix A incorporates a constricted organizational chart depicting the exact location within Royal FrieslandCampina, where this research is initiated.
[image:17.595.168.429.393.617.2]During recent years, the demand for Domo Beilen’s child nutrition has grown tremendously. As a result, the demand is larger than the production capacity. In line with the current demand growth,
major investments are made in Domo Beilen. In the past three years, FrieslandCampina invested 600 million Euros in expanding the production capacity and especially in nutrition for children and in single ingredients, i.e. whole Domo (Royal FrieslandCampina NV, 2013). The tranche intended for Domo Beilen amounts 143 million Euros (Royal FrieslandCampina NV, 2012).
In 2013, Domo Beilen produced around 65.000 tons of infant and toddler nutrition. The nutrition is divided over around 600 end products, which were distributed across more than 100 nations worldwide. Yearly, around 200 different ingredients have to be ordered and processed for the purpose of providing parents the best baby food in the world.
Production of infant and toddler nutrition
Domo Beilen operates as a make-to-order (MTO) company. Ingredients and packaging materials are kept in stock for production and the production starts after an order is received. Two thirds of the total production is destined for the B2C-market, i.e. sold in supermarkets in many countries. The remainder, one third, goes to other businesses (the B2B-market). Other companies buy finished goods or semi-finished goods (e.g. base), which serve as raw materials for their own products. Together with the customer the product specifications will be defined from ingredients, nutrition values, packaging, lead times to batch quantities. Without an order, nothing will be produced, except for a sample-batch.
A brief description of the production process at Domo Beilen is as follows. Fresh cow milk, straight from the farmers is delivered at the Beilen site by tank trucks. Then, there is whey, also delivered by tank trucks. Whey is a liquid product released by the production of cheese. Finally, numerous additives, like vitamins and glucose, are required for the production of child nutrition. Then several production steps follow (which will not be outlined here), after which the product will be packed and shipped. Figure 1.3 depicts a high level overview of the production process. The numbered elements (1 to 4) form the subgroups, which are blended into the so-called ‘mixed product’. A part of the bases and ‘Agglomeraat Magere Melk Poeder’ (AMMP) is destined directly to the B2B-market. Yet, the main part of the bases and AMMP is used for end-products. After the mixed product is packed, the finished goods will be delivered to the customer.
Figure 1.2 - One of Domo's IFT-nutrition products
[image:18.595.432.526.232.398.2]1.2
Research motivation
Domo Beilen wants to organize their inventories in an efficient way. Nowadays, the (re)order points and quantities are proposed by Domo Beilen’s Enterprise Resource System (ERP). Two employees share the responsibility for approving the proposed purchase requests related to the ingredients. Therewith, they are mainly responsible for the availability of the ingredients when the production process commences.
Currently, the focus is on producing high-quality products as much as possible, because the demand exceeds the production capacity. However, the current striving for maximum production of high-quality products removes the focus from optimizing Domo Beilen’s supply chain.
As a nutrition supplier, Domo Beilen processes mainly perishable ingredients. Some of the ingredients have a short shelf life related to the throughput time. Due to changes or misinterpretations, parts of the inventory may not be processed further into end-products. If so, there are two options left: (1) the inventory will be devalued as cattle feed, or (2) if the inventory is useless, it has to be destroyed by a third party. Nevertheless, it costs money. Hence, Domo Beilen wants to minimize scrapped inventories while non-interrupting the production process.
1.3
Problem description
Due to the significant profit losses caused by perished inventory, Domo Beilen sees possibilities for improvement. Yet, perished inventory is not the only problem. In contrast, there can be insufficient inventory. Shortage of raw materials can cause production stops. Hence, the required end products cannot be produced in time. As the demand exceeds the supply, this results in huge opportunity cost losses. Additionally, shortages can induce that the available raw materials pass their shelf-life-expiration-date (SLED), with all its consequences.
2
Research design
This chapter presents the research approach in order to develop a solid basis for the research. Section 2.1 outlines the research approach. Then, Section 2.2 presents the research objective and scope, based on the problem description provided in Chapter 1. Section 2.3 outlines the research questions that serve as backbone of the research. At the end, Section 2.4 describes the research methodology.
2.1
Research approach
The problem description provided in Section 1.3 has a wide range of possible solution approaches. To provide a selection of some possible approaches:
I. Optimizing the demand forecasts.
II. Optimizing the supplier base, with other/more suppliers being able to deliver the required amount of raw materials, satisfying the quality specifications of Domo.
III. Optimizing the quality inspection process. The quality of almost every ingredient and (semi-) finished product is being assessed.
IV. Improvement in supply chain integration, e.g. through Continuous Replenishments (CR) or Vendor Managed Inventories (VMI).
V. Optimizing the replenishment policy.
The size of a multinational as FrieslandCampina brings a separation of responsibilities along. The approaches above can be assigned to four different clusters within Domo Beilen. The cluster Supply Chain is responsible for points I, II and IV, whereas Quality Assurance and Quality Control are responsible for point III. Approach V can be assigned to the Business Office (in Dutch: Bedrijfs-bureau).
The Business Office is mainly responsible for the work preparation and production scheduling. One of its activities is the replenishment of raw materials. That is why the responsibility for efficient and effective replenishments is felt at the Business Office too. Hence, the Business Office wants to know what the key indicators are for realizing optimal replenishment decisions. As the Business Office requested this research, the research will deal with approach V.
2.2
Research objective and scope
As Domo Beilen wants to organize their raw materials replenishments in an optimal manner, we define the problem statement as:
Optimize the raw materials’ inventory control of Domo Beilen. In particular, redefine the replenishment policy, the safety stock levels, and designate the most critical raw materials.
The scope of the research is within the main tasks1 of the Business Office and concerns all ingredients delivered by external suppliers, being around 200 ingredients.
1
2.3
Research questions
In order to achieve the research objective, a number of research questions will be established. The research questions serve as backbone of the research and contribute to the development of useful recommendations and the required replenishment model. The headers denote the research subjects.
Current situation
–
Chapter 3
1. What does the current situation look like?
a. What does the production process look like? In particular, where are new ingredients added to the production process?
b. What does the replenishment policy look like, w.r.t. order points and order quantities?
c. On what basis are the current safety stocks determined?
d. What are the consequences of the current approach of replenishing? i. How many ingredients pass their shelf life expiration date (SLED)? ii. How often/much delay is caused by non-available ingredients? iii. What costs are made due to understocking and overstocking?
Literature review
–
Chapter 4
2. According to the literature…
a. What SKU classification models are recommended? b. What replenishment policies are recommended?
Redesign of replenishment policy
–
Chapter 5
3. How to organize Domo Beilen’s replenishment policy?
a. Develop a procedure to classify Domo Beilen’s ingredients. b. Develop a model to determine the safety stocks.
Savings
–
Chapter 6
4. What are the benefits of the new inventory control policy?
a. What is the difference compared to the former inventory control policy?
Implementation plan
–
Chapter 7
2.4
Research methodology
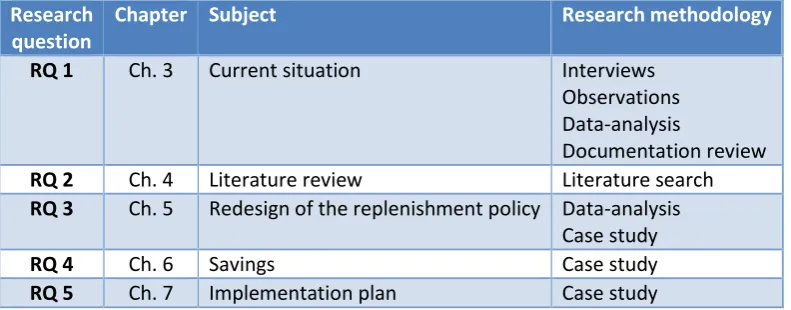
This section outlines the approach of the research questions defined in Section 2.3. First, an analysis will be made of the current situation. Second, a research will be executed about the desired situation. Third and finally, a solution will be developed. The research questions proposed in Section 2.3 are already listed in this sequence. Table 2.1 provides an overview of the research methodologies used per research question.
1. What does the current situation look like?
The importance of this question is to attain understanding of the current situation. As the production is dependent of the availability of the required raw materials, it is helpful to understand the production process. Further, understanding of the current replenishment process is needed, as the replenishment policy needs to be improved. Then, the most critical raw materials have to be recognized to develop a suitable solution for these items. The analysis of the current situation serves as starting point for the desired improvement.
2. What SKU classification models and replenishment policies are recommended?
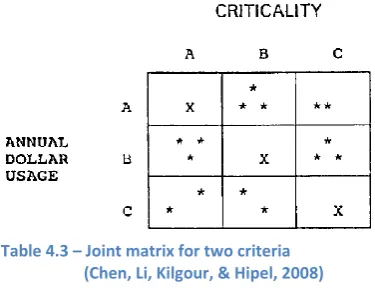
FrieslandCampina Domo is not the only firm that deals with large and perishable stocks. Therefore, the literature will be studied to find methods applicable to Domo Beilen. Further, the literature will be searched for the best practices of the classification of SKUs. Domo Beilen purchases hundreds of raw materials with various characteristics. This mix of characteristics results in a certain importance for Domo Beilen, i.e. the criticality. For a given importance, a certain level of attention is required (Silver, Pyke, & Peterson, 1998). By classifying the raw materials the inventory control becomes easier. Thereafter, different replenishment policies and the determination of safety stocks will be reviewed. Herewith, the most appropriate replenishment policy can be applied and proper safety stocks can be determined.
3. How to organize the inventory control policy?
Based on the literature review, we are now able to redesign Domo Beilen’s inventory control policy. With the information gathered from the literature review, we are able to classify the SKUs in an effective manner and to select a proper replenishment model.
4. What are the benefits of the new inventory control policy?
To determine the importance of a new replenishment policy, the new and the former situation will be compared. Herewith, the benefits and possible drawbacks will become clear.
5. How should the inventory control policy be implemented at FrieslandCampina Domo Beilen?
Research question
Chapter Subject Research methodology
RQ 1 Ch. 3 Current situation Interviews Observations Data-analysis
Documentation review RQ 2 Ch. 4 Literature review Literature search RQ 3 Ch. 5 Redesign of the replenishment policy Data-analysis
Case study
RQ 4 Ch. 6 Savings Case study
[image:24.595.102.498.90.245.2]3
Current situation
This chapter answers Research question 1:What does the current situation look like? The answer will fulfill three objectives. The first objective is to unveil the circumstances with which Domo Beilen, and in particular the Business Office deals. Therewith, the activities will be better understood. The second objective is to unveil opportunities to improve Domo Beilen’s activities. The third objective is to create a reference point for the recommendations that this report will deliver.
Chapter 3 is structured as follows. Section 3.1 describes the customer order fulfillment process. Section 3.2 explains the production process of consumer products. Section 3.3 describes the replenishment process. Section 3.4 describes the current inventory control performance. Section 3.5 outlines some SKU characteristics. Finally, this chapter ends with a conclusion in Section 3.6.
3.1
Customer order fulfillment
This section illustrates the customer order fulfillment process of Domo Beilen in order to unveil the dependencies and relationships between the various departments. Domo Beilen is a so-called make-to-order firm. This means that Domo Beilen starts a production run after a customer order is received (Hoekstra & Romme, 1992). To shorten the lead times for the customers, a firm can purchase raw materials before a customer order is received. In such a situation, the firm has to purchase on forecast.
Developing forecasts contributes to a faster customer order fulfillment. The customer order fulfillment of Domo Beilen is as follows. The order fulfillment is triggered by a customer’s need. To fulfill the need, the customer makes contractual agreements with the Logistics department, which is responsible for sales. One component of the agreement is that the customer provides forecasts. Then, the demand planner collects the demand forecasts and combines them into one production forecast. The forecast covers 18 months. Subsequently, the demand planner loads the forecasts every month into the production module (R3) of the enterprise resource (ERP) system, developed by SAP. Hence, at this moment the forecast is available for the master and detail planners (and many others within Domo Beilen).
The masterplanners translate the forecasts into two master production plans (HPP), covering 13 weeks, and check the feasibility of the plans with respect to the production capacity. One HPP is intended for the Towers’ production, i.e. for the production of bases. The other HPP is intended for the packaging lines, i.e. for packing the mixed product. Then, the masterplanners enter the HPPs into SAP. Subsequently, an MRP-run will be executed. MRP stands for Material Requirements Planning. The system calculates what quantity of each ingredient is needed to produce the required products and when purchase orders have to be submitted. Hence, according to the bill-of-material dependencies all requirements will be updated from raw materials to semi-finished goods. Figure 3.1 depicts the sequence of the information flow as described above.
This section described all departments directly involved in the customer order fulfillment. In the next section, the production process will be explained.
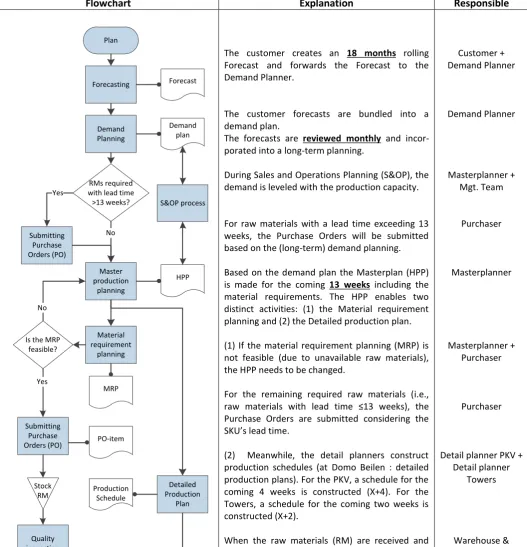
Figure 3.1 – Customer order fulfillment dependencies within Supply Point Beilen
Customer Demand planner
(Logistics)
Masterplanner (Masterplanning)
Purchasers (Business office)
Flowchart Explanation Responsible
Forecasting
Demand Planning
S&OP process Plan
Forecast
Demand plan
Master production
planning
HPP
Material requirement
planning
MRP
Submitting Purchase Orders (PO)
No
Is the MRP feasible?
Yes
Production PO-item
Detailed Production
Plan Production
Schedule Stock
RM
Quality inspection
Quality
approved? Yes Submitting
Purchase Orders (PO)
RMs required with lead time >13 weeks? Yes
No
The customer creates an 18 months rolling Forecast and forwards the Forecast to the Demand Planner.
The customer forecasts are bundled into a demand plan.
The forecasts are reviewed monthly and incor-porated into a long-term planning.
During Sales and Operations Planning (S&OP), the demand is leveled with the production capacity.
For raw materials with a lead time exceeding 13 weeks, the Purchase Orders will be submitted based on the (long-term) demand planning.
Based on the demand plan the Masterplan (HPP) is made for the coming 13 weeks including the material requirements. The HPP enables two distinct activities: (1) the Material requirement planning and (2) the Detailed production plan.
(1) If the material requirement planning (MRP) is not feasible (due to unavailable raw materials), the HPP needs to be changed.
For the remaining required raw materials (i.e., raw materials with lead time ≤13 weeks), the Purchase Orders are submitted considering the SKU’s lead time.
(2) Meanwhile, the detail planners construct production schedules (at Domo Beilen : detailed production plans). For the PKV, a schedule for the coming 4 weeks is constructed (X+4). For the Towers, a schedule for the coming two weeks is constructed (X+2).
When the raw materials (RM) are received and stocked the goods are inspected on their quality w.r.t. the predetermined quality specifications.
Finally, when the RM quality is approved, the production may start.
Customer + Demand Planner
Demand Planner
Masterplanner + Mgt. Team
Purchaser
Masterplanner
Masterplanner + Purchaser
Purchaser
Detail planner PKV + Detail planner
Towers
Warehouse & Transport; inspection: Quality Control
[image:27.595.34.562.95.643.2]Processing
3.2
Production process
For a manufacturing firm, the procurement of raw materials is a facilitating activity. In order to provide proper support for the actual production, it is helpful to gain insight in the production process. Section 1.1 already provided a high-level overview of the production process of IFT. This section will describe the process in more detail. However, it is not intended to outline the entire technological process; it is intended to gain insight in the different locations and especially points in time where ingredients unite. At the end of this section, these occasions are set against the packaging date. That is because the packaging date is directly derived from the delivery date, which is agreed with the customer.
During the production, multiple semi-finished products and ingredients congregate. Figure 3.3 depicts the processing of the required ingredient groups during the production process. It is a swimlane diagram. Each ‘swimlane’ represents a location or responsible department. The different colors mean that the ingredients are processed in the same production phase, except for the additives (yellow pentagons).
It is desired to start the production as soon as the required ingredients are approved. The various ingredients undergo their own preparations before they are united into the (semi-) finished products. In Figure 3.3 you can see, that RMO (milk) and whey are processed into skimmed milk and OWC, respectively. OWC is demineralized whey concentrate (in Dutch: Ontzoute Wei Concentraat). These two semi-finished products are united with the fat-blend. The fat-blend consists of fat, which is fortified with nutritious additives. These three semi-finished products together are condensed into base concentrate (see the blue pentagons). In addition, some of the skimmed milk is condensed to AMMP, which is a direct ingredient for the end product.
for the blending, base is required. Every type of base is produced at most once per two weeks. The exact production schedule is determined one to two weeks before production. However, due to delay caused by unplanned production stops, the schedules can be adjusted anyway. Before the base production, the dispensary takes 3 to 4 days to prepare the base-clusters. And after the base production, the inspection for base takes another two weeks. Hence, we may assume that the ‘lead time’ for base amounts at least 31 days.
Finally, the base-concentrate, required for the production of base, has to be evaporated within 30 hours. On average it is evaporated within 24 hours. Except the fat-blends for specialties, no additive-clusters have to be prepared by the dispensary. The additives for regular base are available on location. Hence, it takes around 2 days to make base-concentrate for regular base and at most 6 days for specialties.
Recall that a customer order will be definitive 9 weeks before its packing date, i.e. 63 days. Hence, the period remaining for replenishment ‘on order’ can be determined. Ingredients with a replenishment lead time longer than the remainder (last column) have to be purchased based on forecast. The ingredients with a replenishment lead time within the remaining period can be purchased on fixed orders. Table 3.1 summarizes the described preparation periods. The values in the last two columns are cumulative 63 days. Note: the inspection result is assumed to be positive, i.e. the ingredients and base are approved.
Please note that there is a significant difference in the time of usage of the tower-material versus the
mix-material. Solely tower-materials with lead time shorter than 19 or 23 days (around 3 weeks) can be purchased on order. The remainder of the orders is based on forecasts. For the mix-materials the lead time for purchasing on order should be less than 56 days (8 weeks).
Ingredients are
intended for processing phase Duration of (days)
Days required before the
end-products’ packing date
Days left for replenishment
Fat-blend
(for specialties) 6 44 19
Fat-blend
(for regular base) 2 40 23
Base
(Tower-cluster) 31 38 25
Mixed Product
(Ruberg-cluster) 7 7 56
[image:29.595.98.497.495.663.2]Packed end product - 0 63
Combining all ingredients into a consumer product. Tanktruck receiving Vacuum Demineralization (Weilijn) Dispensary (Apotheek) Fattank(s) (21-VTMKV) Skimming/ Pasteurization
Towers Ruberg PKV Warehouse & Transport
re n eg le ct ed xa n , a n d /o r o th er s es a n d t ra ce e le m en ts ), a n d /o r o th er s OWC (standardized whey) Skimmed milk Fat-blend Additives * Whey RMO
Standardiza-tion of whey Blend
Fat
Milk processing
Cluster(s) for Towers 2, 4, and 5 Base concentrate Vacuum processing If ‘I’: Lecithin and MCT oil AMMP Sugar Cluster (for Ruberg) Evaporation Receiving + storage raw materials (ZGST) Additives Start (arriving trucks) Additives ** Solely skimmed milk, processed by Vacuum
Dry blending takes place ± 3 days before packaging Bases are produced
on avg. 2-4 weeks before dry blending (max. = 6 weeks) Clusters are
prepared ± 4 days before required Sugar
Weighing + dispensing Base concentrate
has to be evapora-ted within 30 hours
Blue Yellow Red Green Purple Ingredients for Base concentrate Ingredients for Base Ingredients for Mixed product Mixed product Additives Legend
Supply of ... Start / end
[image:30.1191.45.1089.94.760.2]3.3
Replenishment process
The goal of this section is to outline the (current) replenishment process for a better understanding and to unveil opportunities for improvement. Domo Beilen takes into account two types of inventory, namely cycle stock and safety stock.
Cycle stock; the result of ordering larger amounts than the demand, for example because of economies of scale.
Safety stock; the (average) inventory kept on hand to buffer against uncertainties in supply and demand.
This section is divided into three subsections. Subsection 3.3.1 describes the replenishment process. Subsection 3.3.2 outlines the uncertainties influencing the purchase orders. Finally, subsection 3.3.3 illustrates how the current safety stocks are determined.
Replenishment policy
3.3.1
In this subsection, the process of ordering raw materials will be described. The ordering takes place as follows. Every Wednesday is ‘ordering day’. This is prompted by the preceding planning activities, which are executed every Monday (for the packaging) and Tuesday (for the base production, at the Towers). Hence, on Wednesday all production plans and demand forecasts are updated and the purchasers will order the required raw materials.
Domo Beilen uses two types of replenishment policies. Namely, a periodic review policy with fixed order quantities, called (R,s,Q), and a periodic review policy with variable order quantities, called (R,s,S). The R represents the review period, which is 7 days for
Domo Beilen. The small s denotes the reorder point, which equals the expected demand during the replenishment lead time, including the inspection lead time. In case of variable lot sizing, the capital S represents the Order-up-to-level. Considering fixed lot sizing, the capital Q represents the fixed order quantity.
During 2013, 193 SKUs were ordered. Most ordered SKUs (96%) have a variable lot sizing policy. The remaining 7 SKUs have a fixed lot size policy (see Table 3.3).
Replenishment
policy Lot sizing Amount of SKUs Percentage
(R,s,S) Variable 186 96%
(R,s,Q) Fixed 7 4%
Table 3.3 - Current inventory control policies
SAP
Domo Beilen uses a real time Enterprise Resource Planning (ERP) system, called SAP. Real time means that whenever the purchasers order, the requirements are up-to-date with respect to the planned and scheduled productions orders. SAP combines the demand of every week into one purchase request. SAP proposes a purchase request considering the preset minimum or fixed order quantities and rounding values. Subsequently, the purchasers check and combine the proposals before they send an official purchase order. The purchasers are enabled to adjust SAP’s proposals in timing and quantity. SAP does not consider the review period, instead the purchasers do.
R Review period
SAP calculates the reorder points and order-up-to-levels, i.e. the purchase requests, based on the expected demand during the replenishment lead time and the current available inventory and the quantity limitations described above.
(Eq. 1)
Further, SAP considers the preset safety stock as reservation. Once the demand during the replenishment lead time and the safety stock exceeds the available stock quantity, a purchase request will be inserted. Table 3.4 shows an example. The planned date (first column) is the date that the available quantity (last column) will change. Please note: the Purchase Order mentioned is expected to be delivered at June 30th. If the lead time for this SKU concerns 28 days, the purchase order should be submitted at most at June 2nd. In this example, 21 days of entrance inspection will follow, before the production order may start.
Although the safety stock is seen as a reservation, it does not influence the size of a purchase order. Hence, SAP´s available stock corresponds with the in inventory management well-known inventory position (Equation 2).
* †
(Eq. 2)
- - - (Eq. 3)
SAP distinguishes three types of stock: approved, blocked, and in-inspection stocks. For example, the blocked stocks concerns handling damage, cattle feed, and lost stocks. An important feature is that
Table 3.4 – Example of purchase requisition (21-10-2014) proposed by SAP Planned dates MRP header Rec./reqd qty Avail. quantity
05-06-14 - - 164
05-06-14 Safety Stock -50 114
30-06-14 Purchase Order 36 150
21-07-14 Order Reservation -67 83
22-07-14 Order Reservation -80 3
21-10-14 Purchase Requisition 36 39
experience. Reasons for submitting an additional PO can be the duration of a re-inspection or the expectation that the batch will be disapproved.
In short, SAP does the main calculation and the purchasers are able to adjust the purchase requests in timing and quantity.
Submitting Purchase Orders
During observation and questioning, the purchasers indicate that they order earlier than SAP proposes.
This is remarkable, because they are creating additional safety stocks. Hence, this additional safety stock equals the demand of three to four weeks. Obviously, this is not desirable. These decisions, made on intuition, subvert an optimal inventory policy.
Nevertheless, it is not surprising that the purchasers create safety stock based on their insights, because many changes are made in the master plan, also within the replenishment lead times. Even changes into the detailed planning sometimes are forced from above. The Supply Chain department imposes these changes, motivated by the high market competition. The changes differ from increasing and decreasing to complete elimination of process orders. Increasing orders might cause the worst consequences, as the purchasers have to order additional raw materials. However, decreasing or eliminating process orders result in excess stock, but does not harm the work of the purchasers.
Currently, the order quantities are derived completely from the expected demand during the replenishment cycle. Historic demand is not considered in determining order quantities. Hence, the purchasers are completely depending on the accuracy of the forecasts.
A good example of a poor performance of the supply chain is the following. For months, a customer rejects its forecasts completely around 10 weeks for production. For 10 out of 15 raw materials this is no problem, but for the remaining 5 it is. These raw materials have a longer lead time than the considered ‘rejection’ period of 10 weeks. These rejections led to the disposal of the materials, being worth €24.000. However, as the purchasers order three to four weeks earlier than SAP proposes, two other ingredients are unnecessarily purchased as well.
Discount prices
While analyzing the procurement contracts, it appeared that for 84 SKUs discount prices exist. SAP does not consider discount prices in proposing its purchase requests. However, the purchasers did not use the discount prices to determine optimal order quantities either. The purchasers indicate that they did not know where to find the discount prices. In order to provide a sustainable solution, the discount prices will be considered in developing a new inventory model as well.
Obsolescence
Until recently, the purchasers were surprised by obsolete stock. SAP does not alert its users that the
available stock will decrease suddenly. Besides it is a wasted investment, in some cases this causes troubles requiring planning adjustments.
Phasing out of raw materials
Occasionally, the R&D department announces a recipe change. A recipe change can be caused for example by national legislation, by the customer (new requirement), or by procurement (difficulties in supply). It means that an ingredient will be replaced, added, or repelled. Especially a replacement seems difficult to manage efficiently. An efficient replacement means in theory that a new raw material comes in, when the former raw material is fully consumed. However, in practice this is difficult, for example because the safety stock does not match any demand.
Currently, there is no (standardized) change procedure regarding the phasing in/out of raw materials. No one is assigned responsibility to phase out ingredients efficiently. The difficulty with ingredients is that most of the ingredients are used in multiple recipes. For example, if a customer requests a recipe change, it does not automatically mean that the ingredient is not needed anymore for other recipes.
Uncertainties in replenishing raw materials
3.3.2
Within the replenishment process, the purchasers are subjected to various uncertainties impeding their replenishment decisions. Additional stock, better known as safety stocks, are intended to buffer against these uncertainties. In order to determine proper safety stock levels, it is necessary to unveil the uncertainties concerning the replenishments. In the remainder of this subsection the following uncertainties will be outlined:
I. Uncertainty in Supply
a. Uncertainty in timing of vendor’s supply
b. Uncertainty in duration and outcome of quality inspections
1) Raw materials 2) Base productions II. Uncertainty in Demand
a. Uncertainty in production plans/schedules
Quality inspection
There are two types of relevant quality inspections: (1) the entrance inspection and (2) the base inspection. For both inspection types holds that the outcome of the inspections is uncertain. For the entrance inspections it applies that the expected duration considered is often not realistic. For the base inspections, the timing is reliable. However, the consequences for the required quantities of raw materials are not.
Most samples are sent to a laboratory and after a while, the results are sent back. The duration of the entrance inspections considered by SAP, and therefore used for determining purchase orders, does not match reality. I have analyzed the data of all entrance inspections executed in 2013, 1879 inspections in total. Their durations are summarized in Table 3.5. The average excess, i.e. actual minus planned duration in days, and the variability of the inspection lead time are significant. Although the inspections take longer than expected, the quality is acceptable. Table 3.5 makes clear, that the entrance inspection lead times known by SAP need to be adjusted.
The base inspections instead, have a realistic lead time. Around 1% of the total base production is fully impermissible. However, 16% of the base production requires rework, which causes changes in the raw material requirements within the raw material lead times.
It is extremely complex to assess the consequences of rework to the raw materials. Every reprocessing has its own ‘adjustment’ recipe, existing of different amounts of different raw materials. Nonetheless, I can assess the differences between the forecasted and actually processed raw materials. Within these differences, the consequences of rework are captured. Therefore, there is no necessity to specify the consequences of rework.
Production plans and schedules
Due to numerous influences, such as production failures, base disapprovals or customer order changes, a plan or schedule can change. While replenishing, the purchasers have to consider the material lead times. They want to know timely what is required for the planned production. Therefore, purchasers (and a lot of others) benefit from an accurate forecast. The raw material replenishment lead times vary from 1 to 21 weeks. Around 90% of the SKUs is attainable within 13 weeks. Therefore, I have analyzed ten (weekly published) masterplans, which consider 13 weeks.
Inspection lead times
in SAP (days)
Number of inspections
Average excess (days)
Std. dev. of excess (days)
0 266 3,6 7,2
1 38 2,3 2,9
7 8 5,0 7,7
9 392 7,0 11,8
14 821 -1,0 8,4
21 351 14,1 19,8
(empty) 3 10,3 8,6
Totals 1879 4,2 13,1
To determine the extent of uncertainty I have analyzed the masterplans for the packaging lines of week 2 to 11 by conducting a sample of 170 process orders against a total amount of 732 process orders. The results of my analysis show many adjustments. These adjustments are caused by (1) production failures (internal cause) or (2) customer behavior (external cause). The ratio between these causes is still unclear. However, with my analysis, the consequences can be easily depicted and the supply chain can be asked for explanations. The sample showed the following:
13 Process orders are shifted (advanced or delayed), but later returned on their original timeslot.
39 Process orders are cancelled (!) (partly production failure/ partly customer behavior)
7 Process orders are shifted to a timeslot one week earlier
9 Process orders were increased with more than 50%
If a process order is shifted, i.e. advanced or delayed, this concerns often one week in the planning. However, the quantity adjustments fall mostly within the replenishment lead times of the raw materials. In general, there is sufficient stock to buffer against these changes, as the purchasers request the raw materials four weeks in advance. Besides, if purchase orders are submitted, in general they are not delayed or cancelled later on.
The master production plans for the base productions (Towers) show also fluctuations. However, the
Tower master plan is heavily influenced by the disapproval and reproduction need of base. Once a produced batch is disapproved, it has to be produced again. Therefore, additional raw materials are required, namely if the raw materials are processed, one cannot separate them anymore. As implied, the disapproval of base amounts 1% of the total base production. The reproductions concern 16% of the total base production. Unfortunately, it is nearly impossible to assess the impact of reproduction to the raw material requirements, because all reproductions are order specific.
Concerning the base production planning and production output, it is nearly impossible to assess the impact to the raw material requirements. In contrast, concerning the end product production planning, the planning shifts concern in general one week. Nonetheless, the cancelled end product production orders result in additional holding costs, or even in obsolescence. For the items with the longest lead times, the planning adjustments have the largest impact.
1) ABC-classification 2) XYZ-classification
3) Allowed amount of weeks coverage 4) Safety stock quantity
ABC-classification
The ABC-classification is a method to assess the importance of SKUs. It is used in many production companies. The methodology is based on the Pareto principle, which states that around 80% of the money is possessed by 20% of the people (Pareto, 1971). However, the annual turnover or annual usage value is the main part in the ABC-classification. The organization’s SKUs have to be ranked from highest turnover (=demand*material value) to lowest turnover. Then, the organization is able to classify its SKUs according to certain thresholds. For example, Domo Beilen labels the top 80% as class A, the next 15% as class B, and the remaining 5% as class C.
XYZ-classification
Another classification used by Domo Beilen is the classification (see Zäpfel, 1996). The XYZ-classification aims at the demand distribution, e.g. is the demand steady or lumpy over time? For this classification, the coefficient of variation (CV) over the demand per week is calculated. Equation 3 shows how Domo Beilen determines the CV of the demand per week.
⁄
⁄
(Eq. 3)
Domo Beilen uses the thresholds CV≤0.3 for class X, 0.3<CV≤0.7 for class Y, and CV>0.7 for class Z. Hence, class X concerns the steadiest demand and class Z concerns the lumpiest demand.
Remarks
1. The CV is calculated over the predictable variance as well. It is not considering the
uncertainty of the demand alone, i.e. the standard deviation of the forecast error. For predictable variance, there is no safety stock required, because we know it is coming.
2. The variance in the past six months and the variance of forecasted demand for the coming six months are weighed equally, while the forecasts capture uncertainty and the actual demand does not.
Week
’
s coverage
The week’s coverage variable is an ‘approved’ period of having a certain SKU in stock. Coverage of 6, 8, or 16 weeks is allocated based on three variables: the material’s ABC-class, its XYZ-class, and its replenishment lead time. However, in practice, nothing is done with this characteristic.
Safety stock
The k denotes the safety factor. Domo Beilen uses three different safety factors are used, which are allocated based on the XYZ-classification (Table 3.6).
(Eq. 4)
However, because Domo Beilen uses a periodic review policy, the safety stock should also cover the review period. This makes the formula:
(Eq. 5)
Remarks
1. The review model solely considers the demand variance per week. This includes the predictable variance, instead of solely the uncertainty in demand.
2. The review model does not consider (the uncertainty during) the review period. 3. The review model does not consider realistic entrance inspection lead times.
Safety stock meeting
As said, the safety stocks are reviewed every quarter. During the safety stock meeting the proposals for the safety stock quantities will be discussed. A masterplanner (from Supply Chain), a purchaser (Business Office), the location procurement manager (Procurement), and the stock control officer (Supply Chain) will attend this meeting. They are expected to determine together optimal safety stock values. I have witnessed one such Safety Stock meeting and there were two interesting peculiarities:
1. No attendee benefits from a tighter safety stock
The common goal and interest is ‘no stockouts’. Higher (safety) stocks make the job easier for the work preparer; higher safety stocks provide the masterplanner more latitude in creating a feasible plan; higher safety stocks mean more replenishments, thus in theory the Procurement Manager is able to agree better contracts. Finally, the Stock control officer did not take a vote.
Class Safety factor k
Probability of no stockout X 1.282 90 %
Y 1.64 95 %
Z 3 99.9 %
Class CV
demand per week
X 0 ≤ CV < 0.3 55 28,5%
Y 0.3 ≤ CV < 0.7 91 47,2%
Z CV ≥ 0.7 47 24,4%
193 100%
X
Y
Z
Cl
assi
fi
ca
t. # Article
groups The most important remarks on the model are mentioned already in this chapter (denoted by: remarks). For a more information about the current model, all the models functions are explained in more detail in Appendix C.
3.4
SKU characteristics raw materials
With a business analytics program, named Every Angle, data from SAP is easily analyzable (Every Angle, 2013). With the help of Every Angle (EA) data is filtered from SAP, to provide some interesting statistics about the raw materials and their demand.
Within SAP, 697 article groups are labeled as raw materials. Other material types are for example: finished products, packaging, or semi-finished products. Of the 697 article groups, just 195 raw materials are required the past 12 months and two SKUs concern the RMO (milk) and whey, which are purchased by others. Hence, 193 SKUs remain to be analyzed. These findings indicate that the dataset is polluted with redundant information.
ABC classification
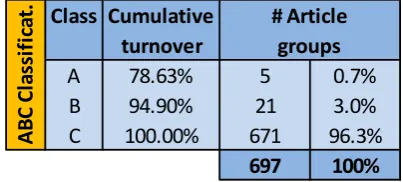
The ABC-classes are determined by considering all known raw material SKUs, even the SKUs without demand in the future (and/or in the past). In the ABC classification, also bulk articles, like RMO and whey, are incorporated. These SKUs are processed in large quantities and within a day. In other words, these items receive a special treatment with respect to the other SKUs. They bias the ABC-classification if we use it to assess the criticality of the ‘on the shelf’ SKUs.
Table 3.5 depicts the results of Domo Beilen’s ABC classification of March 2014. If we exclude the irrelevant SKUs, i.e. the RMO and whey products and the SKUs without demand, the figures in Table 3.6 remain.
XYZ classification
Furthermore, Domo Beilen uses the XYZ-classification (see Zäpfel, 1996). Table 3.7 depicts the XYZ-class sizes according to the safety stock review of March 2014. The abbreviation CV denotes the coefficient of variance of the demand per week. At Domo Beilen, this is an average of the demand of the past six months and the forecasted demand for the upcoming 6 months.
Table 3.7 - XYZ-class sizes and their CV thresholds Class Cumulative
turnover
A 78.63% 5 0.7%
B 94.90% 21 3.0%
C 100.00% 671 96.3%
697 100% # Article
groups
A
B
C
Cl
assi
fi
ca
[image:39.595.81.283.470.561.2]t.
Table 3.5 - ABC-class sizes of all known SKUs
Class
A 1 0.5%
B 21 10.9%
C 171 88.6%
193 100%
A
B
C
Cl
assi
fi
ca
t.
groups # Article
[image:39.595.361.502.471.563.2]Procurement costs
In order to determine what is cost efficient, i.e. holding more inventory or replenish more often, the procurement costs are researched. FrieslandCampina Domo agreed all-inclusive prices for its raw materials. The total procurement costs are made variable per kilogram or multiplicity. Hence, no fixed order costs are incorporated.
Further, I found discount prices for 84 SKUs. These discount prices can lead to cost savings and will therefore be incorporated in the final replenishment model. As explained in Section 3.31, I have provided the purchasers an overview of discount prices and break-even points such that they can make some beneficial decisions already.
Replenishment lead times
The analysis of the lead times leads to other interesting outcomes. The replenishment lead time is the time elapsing between the moment an order is placed and the moment that the raw materials are physically on the shelf ready to satisfy customer demands (Silver, Pyke, & Peterson, 1998). Hence, for Domo Beilen applies:
Replenishment lead time = delivery lead time + inspection lead time (Eq. 6) Table 3.8 provides insight regarding the replenishment lead times. The black lines represent the boundaries of a planning level (Forecast > Masterplan > Detailed Production Plan PKV). Hence, it means that at least 14 SKUs are ordered on demand forecast, which includes more uncertainty than the master plan.
Another discrepancy exists regarding the replenishment lead time and the material requirement plans. Namely, the Logistics Manager explained that a customer has to submit his (definitive) purchase order 11 weeks for its delivery date. Because the final quality inspection takes 2 weeks, this implies that a customer order is submitted at least 9 weeks before the packaging date. One exception is made: one customer is allowed to submit its purchase orders 6 weeks before packaging. Further applies: “No order changes are allowed, unless Master planning gives a positive advice.”
Shelf lives
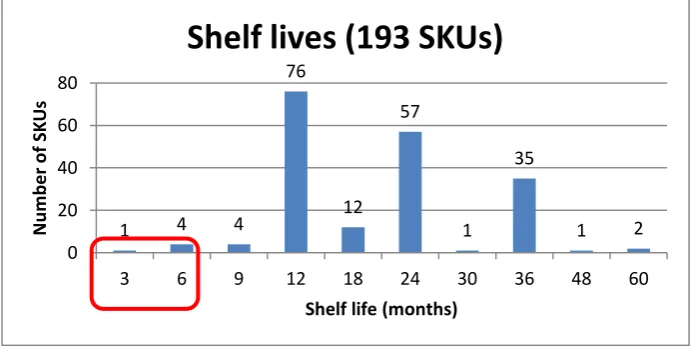
[image:41.595.66.552.89.415.2]Most SKUs have shelf lives of 12 months or more. Just five SKUs have shelf lives of six months or less (see Figure 3.4). A shorter shelf life enlarges the possibility of obsolescence. These SKUs represent 20% of the yearly obsolescence costs, i.e. € 60.000. Despite the items are C-items, the obsolescence should be prevented, as the production cycles are shorter than the shelf lives.
Figure 3.4 - SKU Shelf lives
[image:41.595.245.550.119.376.2]Table 3.8 - Characteristics of SKUs with the longest replenishment lead times
Table 3.9 - Replenishment lead times SKUs SKUs
Totals 193 193
1 week 1 16,1%
2 weeks 3 31
3 weeks 12
4 weeks 15
5 weeks 18 76,7%
6 weeks 16 148
7 weeks 22
8 weeks 45
9 weeks 28
10 weeks 9
11 weeks 1
12 weeks 9
13 weeks 0
14 weeks 4 7,3%
15 weeks 2 14
16 weeks 1
17 weeks 0
18 weeks 1
19 weeks 4
20 weeks 1
21 weeks 1
Pe ri o d be fo re a va il abl e = Pl ann e d D e li v. Ti m e + Q ua li ty Insp. Ti m e SKU Replenishment leadtime (weeks)
ABC XYZ Week coverage
Total shelf life
Vendor
1 13,3 B Y 16 9 Q
2 13,3 C Y 16 9 Q
3 13,3 C Y 16 9 Q
4 14 B Y 16 9 Q
5 14,1 C X 16 36 R
6 15 B Y 16 24 Q
7 15,6 # # # 24 Q
8 17,3 C X 16 24 S
9 18,4 B Y 16 36 R
10 18,4 B Z 16 36 R
11 18,4 C Z 16 24 R
12 18,4 C X 16 24 R
13 19,1 B Y 16 24 R
14 20,6 C X 16 24 T
1 4 4
76
12 57
1 35
1 2 0
20 40 60 80
3 6 9 12 18 24 30 36 48 60
N u m b e r o f SK Us
Shelf life (months)
[image:41.595.112.458.576.749.2]Intermittent demand and non-normal demand distributions
Some raw materials are required a few times a year. Around 30 SKUs are expected to be used 6 times or less during 2014. This means that the raw materials are used once per 8.7 weeks on average. Appendix D presents the amounts of SKUs sorted on the number of weeks per year that the SKUs are required.
3.5
Performance and current inventory
To provide a reference point for the current situation versus the future situation, the current performance needs to be assessed. There are several figures indicating that the current inventory control of raw materials can be improved. Officially, the performance of the purchasers is not assessed with so-called key performance indicators. Therefore, I provide some figures representing the current situation myself.
Performance in Figures
I. Stock value
i. During April 2014 the average raw material stock value amounted € 23.000.000 ii. The official safety stock is worth €1.200.000 (19% of total raw material stock) II. Amount of pallet locations occupied
During April 2014, on average 6050 pallets with raw materials were kept in stock. i. A pallet remains on average 54.3 days or 7.8 weeks in stock.
ii. Therewith, we estimate the yearly storage costs at €315.000, i.e. €1 per pallet per week.
iii. The official safety stock concerns 705 pallets. This equals to storage costs of €36.400 per year and a material value of approximately €1.200.000.
III. Obsolescence costs (excl. the unnecessary holding costs made)
In 2013, the costs caused by obsolescence of raw materials amounted to €315.000 (this is by chance the same amount as the storage costs).
i. 55% concerns product specific ingredients, which is not used due to cancellation ii. 25% concerns stock without demand; lack of out phasing procedure
iii. 20% concerns SKUs with a shelf life being ≤ 6 months