ISSN Online: 2161-6663 ISSN Print: 2161-6620
DOI: 10.4236/ajmb.2018.81004 Dec. 28, 2017 39 American Journal of Molecular Biology
Phylogenetics and Molecular Divergence of
Tilapia Fish (Oreochromis Species) Using
Mitochondrial D-Loop and Cytochrome b
Regions
Ekerette Emmanuel Ekerette
1*, Ekei Victor Ikpeme
1, Ogbuagu Ugorji Udensi
1,
Michael Ohiokhuaobo Ozoje
2, Owoidihe Monday Etukudo
1, Anthony John Umoyen
1,
Samuel Olutunde Durosaro
2, Matthew Wheto
21Department of Genetics and Biotechnology, University of Calabar, Calabar, Nigeria
2Department of Animal Breeding and Genetics, Federal University of Agriculture, Abeokuta, Nigeria
Abstract
Understanding the level of genetic diversity in any population is an important requisite towards strategizing measures for conservation and improvement of stocks. This study focused on the assessment of phylogenetics and molecular divergence of tilapia fish species obtained from two populations (Domita in South-South and Odeda in South-West, Nigeria) using the displacement loop (D-loop) and cytochrome b region of the mitochondrial deoxyribonucleic ac-id (mtDNA). A total of 28 samples (15 from South-South and 13 from South- West) were used for the genetic analysis. DNA was extracted from the tissue of all the samples using Quik-gDNATM miniPrep kit. The D-loop containing the hypervariable region was sequenced for all samples from the two popula-tions, while cytochrome b (Cyt b) region of mtDNA was only sequenced for samples from South-South population. Chromatograms of the sequences were viewed and edited using Bioedit software. Multiple sequence alignment was carried out using molecular evolutionary genetic analysis (MEGA) software before subsequent genetic analyses. Phylogenetic analysis grouped the samples into two clusters based on population. Also, when the two mitochondrial re-gions were pooled together, they clustered into two major groups based on mitochondrial regions. Analysis of molecular variance (AMOVA) revealed 37.32% variation within population and 62.68% variation among population with a significant fixation index of 0.627 (p < 0.05). The genetic distance in-ferred between D-loop regions of South-South and South-West populations was 0.243. Maternal lineage analysis revealed that the origin of tilapia fish How to cite this paper: Ekerette, E.E.,
Ikpeme, E.V., Udensi, O.U., Ozoje, M.O., Etukudo, O.M., Umoyen, A.J., Durosaro, S.O. and Wheto, M. (2018) Phylogenetics and Molecular Divergence of Tilapia Fish (Oreochromis Species) Using Mitochon-drial D-Loop and Cytochrome b Regions. American Journal of Molecular Biology, 8, 39-57.
https://doi.org/10.4236/ajmb.2018.81004
Received: July 22, 2017 Accepted: December 25, 2017 Published: December 28, 2017
Copyright © 2018 by authors and Scientific Research Publishing Inc. This work is licensed under the Creative Commons Attribution International License (CC BY 4.0).
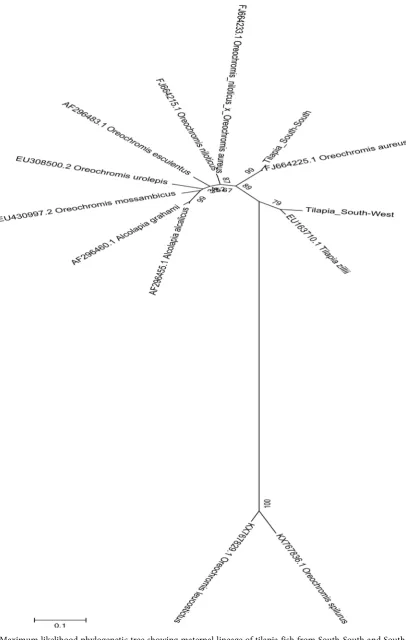
DOI: 10.4236/ajmb.2018.81004 40 American Journal of Molecular Biology from both populations could be traced to Oreochromis spirilus and Oreochromis leucostictus based on mitochondrial D-loop region. The findings of this study re-vealed molecular divergence among the tilapia populations and may serve as pivot information for the genetic improvement of this important species.
Keywords
Phylogenetics, Molecular Divergence, Maternal Lineage, Tilapia Fish
1. Introduction
The Nile tilapia (Oreochromis niloticus) is the most commonly farmed tilapia species in Nigeria with good aquaculture qualities such as ability to withstand poor water quality and wide range of feed that support its cultivation. Reference
[1] reported that tilapia has fast growth rate that can be further improved in a more favourable environment. According to [2], Nile tilapia has special features such as cycloid scales, grey/black body bars, pointed mouth part that ease it identification. As a maritime nation, integrating tilapia farming into agricultural schemes will be a necessary step towards addressing the problem of protein malnutrition, which is currently a challenge faced by many impoverished Nige-rians. Comparing the nutritional values of tilapia to other animal protein sources, [3] documented protein content of 20.1 g, 18.6 g and 21.2 g and choles-terol content of 50 mg, 68 mg and 64 mg per 100 g of tilapia, beef and chicken respectively. Although catfish is the most farmed fish in Nigeria, tilapia is a good candidate that could compete with catfish farming and consumption if given adequate research attention. It had been earlier reported that the total fat of 6 g and 18 g; 59 g and 42 g protein content; 130 mg and 145 mg cholesterol per 80 ounce are available in tilapia and catfish, respectively [4]. With the growing rate of insecurity in the country, the number of internally displaced people is conse-quentially increased daily. These people are faced with malnutrition, especially protein malnutrition in their various camps across the country leading to high mortality rate. Although government has made effort to meet the nutrient re-quirement of these unfortunate Nigerians, this effort is not just sufficient and as such, sourcing protein from tilapia fish to meet this need may be advantageous considering that it is cheaper, readily accessible, with high protein content and other nutritionally essential elements needed for body growth. The challenge in achieving this objective is that Nigeria is far behind in fish production [5] with an estimated N125 billion spent annually on fish importation that has left the country as the highest importers of fish in developing countries [6]. Also, there is a serious concern over the possible genetic erosion of tilapia fish perceived from the continuous exploitation and indiscriminate fishing from the wild by local fishermen to meet market demand.
DOI: 10.4236/ajmb.2018.81004 41 American Journal of Molecular Biology no research interest over the past years. This will pave new way for possible in-tegration of tilapia fish farming into agricultural programmes. To achieve this, it is necessary to assess the different ecosystems where tilapia fish species are available as well as identifying reliable methods for their proper management, conservation and genetic improvement. Genetic variation and phylogenetic stu-dies which assess the variation and relationships existing within and between populations have recently become an integral part in agricultural programmes as a tool for selection of breeding stock and characterization of species for possible conservation [7]. A good insight into the pattern of variation as well as the rela-tionship in a population is a requisite for producing improved breeds. These re-lationships could be studied via morphological data from a population. Al-though morphometric method is the simplest and the most direct way used for fish identification and characterization [8] [9], it may not be very reliable for phylogeny considering that it is more subjected to environmental influences [10] [11] [12]. To fill this gap, different marker techniques have been developed and used for fish phylogenetics. The use of biochemical methods such as isozymes and protein banding patterns has been promising [13] [14]. Protein banding methods are often less informative and are used as preliminary phylogenetic in-vestigative tool [15]. The advent of genetic markers such as RAPD, RFLP, and microsatellite in conjunction with statistical tools has revolutionized population studies geared towards exploring the phylogenetic relationships within and be-tween populations. Importantly, DNA sequence data have proven to be the most direct and reliable method of assessing the pattern of variation and relationships among species.
Sequence data may be obtained from mtDNA or nuclear DNA. However, mtDNA found within the cytoplasm of a cell remains a good choice over nuclear DNA for phylogenetic studies due to the fast rate of mutation in the region [16] [17] and specificity as it is inherited only through maternal cell line [18]. These features of mtDNA are used by evolutionary biologists to establish relationships and to trace maternal lineage of species using array of sequence data. The dis-placement loop (D-loop) is the most variable region of mtDNA [19] and pre-vious research reported that high variation in the region is useful in characteriz-ing tilapia species [20] [21] [22]. Similarly, cytochrome b (Cytb) region of mtDNA has been used to establish the phylogenetic relationships within and between populations [17] [23] [24] [25] [26] [27]. In the present study, it was our aim to assess the phylogenetics of Oreochromis niloticus, a common species of tilapia fish in Nigeria using mitochondrial D-loop and Cytb.
2. Materials and Methods
2.1. Location and Sample Collection
DOI: 10.4236/ajmb.2018.81004 42 American Journal of Molecular Biology Figure 1. Map of Nigeria showing sampling locations.
Farm in Akwa Ibom State, a South-South region of Nigeria located at approximately 5˚1'4''N, 7˚59'52''E. Thirteen samples were obtained from Odeda Farm in Ogun State, a South-West region of Nigeria located at 7˚13'00''N, 3˚31'00''E (Figure 1).
2.2. DNA Isolation
DNA was extracted from the tissue samples of all the fish using Quick-gDNATM MiniPrep kit (Zymo Research, USA). Beta-mecaptoethanol was added to the ly-sis buffer to a final solution of 500 µl per 100 ml according to the manufacturer’s instruction. Approximately 25 mg of each fish tissue was homogenized in 500 µl of genomic lysis buffer in Ependorff tube. The lysate was centrifuged at 10000 × g under room temperature for five minutes using a Centurion Scientific micro-centrifuge (Model: C2015, USA). The supernatant was carefully transferred to a Zymo-SpinTM column in a collection tube and centrifuged at 10,000 × g for one minute. Both the flow through and the collection tube were then discarded be-fore transferring the Zymo-SpinTM column to a new collection tube. 200µl of DNA pre-wash buffer was added to the spin column and centrifuged at 10,000 × g for one minute. 500 µl of g-DNA wash buffer was added to the spin column and further centrifuged at 10000 × g for one minute. The spin column was transferred to a clean microcentrifuge tube and ≥50 µl of DNA elution buffer was added to the spin column. This was incubated for two to five minutes at room temperature and afterward centrifuged at top speed (14,000 × g) for 30 seconds to elute the DNA. The eluted DNA was stored at −20˚C for further analysis.
2.3. PCR Amplification
For-DOI: 10.4236/ajmb.2018.81004 43 American Journal of Molecular Biology ward (5’-GGATTYTAACCCYTRCCCC-3’) and Czilli Reverse (3’-AGTAAAG TCAGGACCAAGCC-5’) for D-loop region as previously used by [22]. Czilli Forward (5’-GGATTTTAACCCTTACCCC-3’) and Czilli Reverse (3’- AGTAAAGTCAGGACCAAGCC-5’) were designed and used for cytochrome b region of the mtDNA. PCR for each mtDNA region was carried out using 25 µl reaction volume containing 1 µl genomic DNA, 2 mM MgCl2, 200 µM of dNTP, 2.5 µl of 10 × PCR buffer, 1 µM of each primer and two units of STABVIDA proprietary Taq polymerase. This was performed using the GeneAmp® PCR sys-tem (9700 thermal cycler, USA) with the cycling condition of initial denatura-tion step at 95˚C for five minutes, followed by 25cycles of denaturadenatura-tion at 94˚C for 40 seconds, annealing at 54˚C for 45 seconds, extension at 72˚C for one minute and final extension at 72˚C for seven minutes. PCR products were puri-fied using exofast protocol according to the manufacturer.
2.4. Sequencing of D-Loop and Cytochrome b Regions of mtDNA
D-loop and cytochrome b region of the mtDNA were sequenced for all tissue- DNA extracts using the primers (5’-GGATTYTAACCCYTRCCCC-3’) and Czilli Reverse (3’-AGTAAAGTCAGGACCAAGCC-5’) for D-loop region and Czilli Forward (5’-GGATTTTAACCCTTACCCC-3’) and Czilli Reverse (3’- AGTAAAGTCAGGACCAAGCC-5’) for cytochrome b region. Sequencing reac-tion was performed with AB13730 × L sequencer using 20 µl reacreac-tion compris-ing approximately 20 ng of purified PCR product as template DNA, 8 µl of Big Dye Terminator Reaction Mix (dNTPs, ddNTPs, buffer, enzyme and MgCl2), 8 µl of deionized water, 2 µl of primer programmed as 25 cycles at 96˚C for 10 seconds, 50˚C for five seconds and 60˚C for four minutes [28]. The length of the sequenced fragments ranged from 950 to 1366 bp for D-loop and 1241 to 1401 bp for cytochrome b.
2.5. Statistical Analysis
DOI: 10.4236/ajmb.2018.81004 44 American Journal of Molecular Biology and AF370632.1 were used. These were all aligned with the query sequences ob-tained from tilapia in the studied populations to construct a maximum likelih-ood tree using MEGA 6.06 with 1000 bootstrap replications [30].
3. Results
3.1. Phylogenetic Relationship Analysis
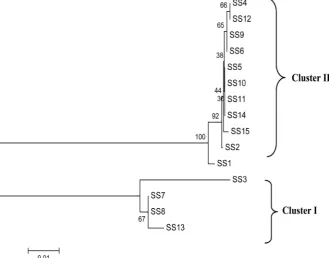
[image:6.595.149.539.220.688.2]The Neighbor-Joining phylogenetic relationship of tilapia fish from the two populations based on mitochondrial D-loop is presented in Figure 2. The num-bers at the node represent the percentage bootstrap values for branches with
Figure 2. Neighbor-Joining phylogenetic tree showing the relationship between tilapia fish from two
DOI: 10.4236/ajmb.2018.81004 45 American Journal of Molecular Biology
Figure 3. Neighbor-Joining phylogenetic tree showing the relationship between tilapia
fish from South-South population based on mtDNA Cyt b (SS = South-South).
1000 bootstrap replications. Two major clusters were revealed, which were based on populations. Cluster I consisted of all the samples from South-West D-loop with assigned sequence accession number: MF385002 sub-clustered into two groups. Similarly, cluster II consisted of all the samples from South-South D-loop with assigned sequence accession number: MF385001. SS11 was sepa-rated into a different lineage from other samples within the South-South popula-tion. For mtDNA Cyt b with sequence accession number: MF384326, two major clusters were also revealed where SS3, SS7, SS8 and SS13 shared the same lineage (Figure 3). The comparative clustering of D-loop and cyt b separated the sam-ples into two major clusters based on mitochondrial DNA regions. Samsam-ples from South-South and South-West D-loop were grouped together under the same major cluster while samples sequenced for cyt b had a different lineage as shown in Figure 4.
3.2. Analysis of Molecular Variance (AMOVA)
From Table 1, AMOVA revealed that molecular genetic variation among popu-lations was higher (62.68%) than within population variation (37.32%) inferred from the D-loop of the two populations. Additionally, fixation index was 0.627, which made the variation significant (p < 0.05).
3.3. Genetic Distance
DOI: 10.4236/ajmb.2018.81004 46 American Journal of Molecular Biology
Figure 4. Neighbor-Joining phylogenetic tree showing the relationship between tilapia fish based on two
DOI: 10.4236/ajmb.2018.81004 47 American Journal of Molecular Biology
Table 1. AMOVA showing genetic variation within and between tilapia in South-South and South-West Nigeria.
SOV Df SS Variance components %Variance FST
Among populations 1 613.704 42.255 62.68
0.627 (p < 0.05)
Within populations 26 654.046 25.156 37.32
Total 27 1267.750 67.410
SOV (source of variation); df (degree of freedom); SS (sum of squares); FST (fixation index).
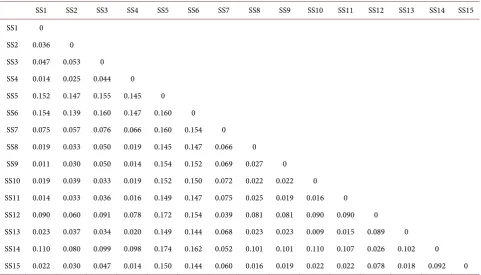
Table 2. Pairwise genetic distance of tilapia fish from South-South Nigeria based on mitochondrial D-loop region.
SS1 SS2 SS3 SS4 SS5 SS6 SS7 SS8 SS9 SS10 SS11 SS12 SS13 SS14 SS15 SS1 0
SS2 0.036 0 SS3 0.047 0.053 0 SS4 0.014 0.025 0.044 0 SS5 0.152 0.147 0.155 0.145 0 SS6 0.154 0.139 0.160 0.147 0.160 0 SS7 0.075 0.057 0.076 0.066 0.160 0.154 0 SS8 0.019 0.033 0.050 0.019 0.145 0.147 0.066 0 SS9 0.011 0.030 0.050 0.014 0.154 0.152 0.069 0.027 0 SS10 0.019 0.039 0.033 0.019 0.152 0.150 0.072 0.022 0.022 0 SS11 0.014 0.033 0.036 0.016 0.149 0.147 0.075 0.025 0.019 0.016 0 SS12 0.090 0.060 0.091 0.078 0.172 0.154 0.039 0.081 0.081 0.090 0.090 0 SS13 0.023 0.037 0.034 0.020 0.149 0.144 0.068 0.023 0.023 0.009 0.015 0.089 0 SS14 0.110 0.080 0.099 0.098 0.174 0.162 0.052 0.101 0.101 0.110 0.107 0.026 0.102 0 SS15 0.022 0.030 0.047 0.014 0.150 0.144 0.060 0.016 0.019 0.022 0.022 0.078 0.018 0.092 0
SS (South-South).
chondrial D-loop of tilapia from South-South population was between SS5 and SS14 (0.174), while the lowest distance was between SS10 and SS13 (0.009). The highest genetic distance within South-West population was 0.133 recorded be-tween SW2 and SW6 and bebe-tween SW3 and SW10, while the lowest distance was between SW9 and SW12 (0.002), Table 3. Similarly, Table 4 showed that the highest genetic distance within mitochondrial Cyt b of South-South population was 0.149 (SS3 and SS12) while the lowest genetic distance was 0.000 (SS7 and SS8, SS6 and SS9, SS5 and SS10, SS5 and SS11, SS10 and SS11, SS4 and SS12, SS5 and SS14, SS10 and SS14, SS11 and SS14).
3.4. Maternal Lineage
[image:9.595.58.540.197.472.2]DOI: 10.4236/ajmb.2018.81004 48 American Journal of Molecular Biology
Table 3. Pairwise genetic distance of tilapia fish from South-West Nigeria based on mitochondrial D-loop region.
SW1 SW2 SW3 SW4 SW5 SW6 SW7 SW8 SW9 SW10 SW11 SW12 SW13
SW1 0
SW2 0.116 0 SW3 0.052 0.123 0 SW4 0.010 0.117 0.055 0 SW5 0.007 0.117 0.053 0.006 0 SW6 0.033 0.133 0.039 0.034 0.033 0 SW7 0.039 0.097 0.060 0.042 0.040 0.065 0 SW8 0.009 0.119 0.045 0.012 0.009 0.025 0.042 0 SW9 0.009 0.116 0.056 0.005 0.004 0.037 0.043 0.013 0
SW10 0.088 0.052 0.133 0.081 0.083 0.111 0.123 0.093 0.078 0
SW11 0.016 0.123 0.058 0.015 0.012 0.038 0.043 0.014 0.016 0.092 0
SW12 0.009 0.118 0.056 0.005 0.005 0.037 0.045 0.011 0.002 0.080 0.016 0
SW13 0.014 0.120 0.045 0.011 0.014 0.026 0.042 0.014 0.016 0.090 0.017 0.016 0
SW (South-West).
Table 4. Pairwise genetic distance of tilapia fish from South-South Nigeria based on mitochondrial Cyt b region.
SS1 SS2 SS3 SS4 SS5 SS6 SS7 SS8 SS9 SS10 SS11 SS12 SS13 SS14 SS15 SS1 0
SS2 0.007 0 SS3 0.144 0.146 0 SS4 0.008 0.003 0.149 0 SS5 0.008 0.001 0.148 0.002 0 SS6 0.007 0.002 0.148 0.001 0.001 0 SS7 0.118 0.119 0.032 0.123 0.120 0.122 0 SS8 0.118 0.119 0.032 0.123 0.120 0.122 0.000 0 SS9 0.007 0.002 0.148 0.001 0.001 0.000 0.122 0.122 0 SS10 0.008 0.001 0.148 0.002 0.000 0.001 0.120 0.120 0.001 0 SS11 0.008 0.001 0.148 0.002 0.000 0.001 0.120 0.120 0.001 0.000 0 SS12 0.008 0.003 0.149 0.000 0.002 0.001 0.123 0.123 0.001 0.002 0.002 0 SS13 0.122 0.126 0.035 0.127 0.127 0.126 0.005 0.005 0.126 0.127 0.127 0.127 0 SS14 0.008 0.001 0.148 0.002 0.000 0.001 0.120 0.120 0.001 0.000 0.000 0.002 0.127 0 SS15 0.010 0.003 0.145 0.004 0.002 0.003 0.120 0.120 0.003 0.002 0.002 0.004 0.125 0.002 0
SS (South-South).
FJ664233.1, AF296455.1, AF296460.1 and FJ664215.1) is presented in Figure 5
[image:10.595.62.540.368.641.2]DOI: 10.4236/ajmb.2018.81004 49 American Journal of Molecular Biology from GenBank. Similar result was obtained when mtDNA cyt b reference se-quences (AB018989.1, X81565.1, AF375617.1, HM049957.1, EF059808.1, KX347644.1, JQ755415.1, EF679275.1, KX347652.1, EF679291.1, KX347643.1 and AF370632.1) were compared with South-South population (Figure 7).
[image:11.595.206.538.133.699.2]DOI: 10.4236/ajmb.2018.81004 50 American Journal of Molecular Biology
Figure 6. Maximum likelihood phylogenetic tree showing maternal lineage of tilapia fishfrom South-South and South-West
DOI: 10.4236/ajmb.2018.81004 51 American Journal of Molecular Biology
Figure 7. Maximum likelihood phylogenetic tree showing maternal lineage of tilapia fishfrom South-South Nigeria based on
DOI: 10.4236/ajmb.2018.81004 52 American Journal of Molecular Biology
4. Discussion
Understanding the genetic architecture of species in a population is very critical in developing conservation and management strategies for endangered species
[32]. Tilapia fish is highly migratory species with high rate of introgression, which may alter their genetic originality. Thus, for management and improve-ment of this important species, it becomes imperative to assess their genetic blue-print and relationships.
The importance of understanding the phylogenetic relationship existing within and between species in a population cannot be overemphasized as it has become a handy method used in tracing the origin and evolution of species, pre-diction of physiological, biochemical and structural features of sequences ob-tained from organism [33]. Phylogenetic tree can be constructed using different features and characters of species such as morphology, RAPD information or sequence data of the DNA. Important to note is the reliability of sequence data over other methods in establishing the relationship between closely related spe-cies [34]. In this study, the phylogenetic tree constructed from the sequence data (D-loon and cyt b) of samples from the two populations clearly separated the samples into two major clusters based on population. All samples from South- South population were grouped under the same major cluster while South-West samples clustered under a common group. This could suggest that the two pop-ulations are genetically distinct although they may share a common ancestor. The findings here corroborate the earlier report by [22] that populations of tila-pia species in Nigeria showed no evidence of sub-structuring in their phylogeny but may be traced to a single ancestral lineage. Similarly, phylogenetic analysis by [35] and [36] also revealed population-based phylogenetic clustering of fish. Comparing the two mitochondrial DNA regions showed that the samples are genetically distinct as they were specifically grouped based on the two mito-chondrial regions used for the study. Although D-loop was sequenced for two different populations, the samples from these populations shared the same major cluster. This might suggest that sequence evolution of mtDNA D-loop region is not environmentally influenced but the differences could be traced to other fac-tors inherent in the sequence. Also, the fact that there was no intertwining of D-loop and cyt b samples on the phylogenetic tree could be an indication of the dissimilarity of these regions in predicting evolutionary trends [19]. Phylogeny of the two populations corroborates the findings of the genetic distance based on D-loop region. In South-South population, samples with the highest genetic dis-tance (SS5 and SS14) were found in separate sub-clusters, while the lowest ge-netic distance (SS10 and SS13) were sub-clustered together with a bootstrap val-ue of 83. In South-West population, the highest genetic distance (SW2 and SW6) were in different sub-clusters, while the lowest distance observed between SW9 and SW12 were in the same sub-clusters.
maxi-DOI: 10.4236/ajmb.2018.81004 54 American Journal of Molecular Biology mum performance of specific species of tilapia fish may not have been met. It therefore suggests that for better improvement of tilapia fish, there should be collaboration between geneticists, breeders and fish farmers.
The genetic distance between South-South and South-West populations based on D-loop was 0.243, which was higher than within population genetic distance. Genetic distance measures the genetic differences between species/populations. Populations with similar alleles are expected to have low genetic distance as an indication of their genetic relatedness [39]. Therefore, genetic distance between the populations may be further indication of the molecular divergence between tilapia from South-South and South-West Nigeria. The result on the genetic dis-tance further support the speculation that tilapia fish sampled from South-South and South-West may not be the same species as the genetic distance is wide. Going by the report of [39], it does suggest that the two populations might not be genetically related especially using mtDNA D-loop reference. The genetic unrelatedness may also be from the fact that due to random mutation, alleles that were similar from the ancestral root had changed frequency [40]. This di-vergence is important for the survivability of tilapia fish in the advent of envi-ronmental hazard. Comparing the within group genetic distance of D-loop and Cyt b of South-South population, the highest distance from D-loop was observed between SS5 and SS14 (0.174), while SS3 and SS12 (0.149) was highest based on Cyt b. Although from the same population, D-loop and Cyt b seem to predict the within group genetic distance differently which could be an indication that the two regions of mtDNA may not estimate genetic relatedness in a similar pattern. As it is reported that the mutation rate of the different regions of mtDNA are different
[19], the findings of the present study may not be unexpected.
5. Conclusion
The findings of this study revealed the existence of molecular divergence be-tween tilapia fish from the two geographical regions of Nigeria. Also, the two mtDNA regions used in this study showed dissimilarity in estimating genetic re-latedness.
Acknowledgements
The authors wish to thank the Animal Genetics and Genomics unit, Department of Genetics and Biotechnology, University of Calabar, Nigeria for the support granted to facilitate this research.
Conflict of Interest
We declare that there is no conflict of interest in the manuscript from any au-thor.
References
DOI: 10.4236/ajmb.2018.81004 55 American Journal of Molecular Biology
Programme on Oreochromis niloticus. FAO Fisheries and Aquaculture Depart-ment, Rome.
[2] Picker, M.D. and Griffiths, C.L. (2011) Alien and Invasive Animals: A South African Perspective. Randomhouse/Struik, Cape Town.
[3] Agricultural Research Service (ARS), United States Department of Agriculture (USDA) (2009) Nutrient Data Release 22. http://www.ars.usda.gov/ba/bhnrc/ndl
[4] Sparkpeople (2013). Food vs. Food. http://www.sparkpeople.com/
[5] Oyakhilomen, O. and Zibah, R.G. (2013) Fishery Production and Economic Growth: Pathway for Sustainable Development. Journal of Sustainable Develop-ment, 15, 2.
[6] Agbo, D.I. (2015) Bridging the Fish Demand, Supply Gap in Nigeria. Daily Trust Newspaper, 14 May.
[7] De-Silva, M.P.K.S.K. (2015) Genetic Diversity of Genetically Improved Farmed Ti-lapia (GIFT) Broodstocks in Sri Lanka. International Journal of Scientific Research and Innovative Technology, 2, 66-76.
[8] Hockaday, S., Beddow, T.A., Stone, M., Hancock, P. and Ross, L.G. (2000) Using Truss Networks to Estimate the Biomass of Oreochromis niloticus and to Investi-gate Shape Characters. Journal of Fish Biology, 57, 981-1000.
[9] Samaradivakara, S.P., Hirimuthugoda, N.Y., Gunawardana, R.H.A.N.M., Illeperu-ma, R.J., Fernandopulle, N.D., De-Silva, A.D. and Alexander, P.A.B.D. (2012) Morphological Variation of Four Tilapia Populations in Selected Reservoirs in Sri Lanka. Tropical Agricultural Research, 23, 105-116.
[10] Thompson, J.D. (1991) Phenotypic Plasticity as a Component of Evolutionary Change. Trends in Ecology and Evolution, 6, 246-249.
[11] Wimberger, P.H. (1992) Plasticity of Fish Body Shape, the Effects of Diet, Develop-ment, Family and Age in Two Species of Geophagus (Pisces: Cichlidae). Biology Journal of Linnean Society, 45, 197-218.
[12] Ikpeme, E.V., Ekerette, E.E., Udensi, O.U. and Ozoje, M.O. (2017) Assessment of Morphological Variation in Wild and Cultured Populations of Tilapia Fish (Oreochromis niloticus). Journal of Advances in Biology & Biotechnology, 13, 1-10. [13] Na-Nakorn, U. (2001) Genetic Differentiation of Fishes in the Genera, Clarias and
Prophagorus in Thailand, Using Protein Electrophoresis and RAPD-PCR. In: Bai-mai, V. and Kumhom, R., Eds., BRT Research Reports, Biodiversity Research Training Program, Jirawat Express, Bangkok.
[14] Jesslin, G., Sabaridasan, A., Edwinthahgam, P., Palanikani, R. and Soranam, R. (2013) Electrophoretic Studies on the Muscle Proteins of Three Species of Genus
Puntius (Osteichthyes-Cyprinidae). International Journal of Research in Fisheries and Aquaculture, 2, 16-20.
[15] Adeleke, M.A., Peters, S.O., Ozoje, M.O., Ikeobi, C.O.N., Adebambo, A.O., Olowo-feso, O., Bamgbose, A.M. and Adebambo, O.A. (2013) A Preliminary Screening of Genetic Lineage of Nigerian Local Chickens Based on Blood Protein Polymor-phisms. Animal Genetic Resources, 48, 23-28.
[16] Wilson, A.C., Cann, R.L., Carr, S.M., George, M., Gyllensten, U.B., Helm-Bychowski, K.M., Higuchi, R.G., Palumbi, S.R. and Prager, E.M. (1985) Mitochondrial DNA and Two Perspectives on Evolutionary Genetics. Biological Journal of Linnean So-ciety, 26, 375-400.https://doi.org/10.1111/j.1095-8312.1985.tb02048.x
DOI: 10.4236/ajmb.2018.81004 56 American Journal of Molecular Biology
Mitochondrial DNA Diversity of Terubok (Tenualosatoli) from Daro and Mukah, Sarawak Inferred by Partial Cytochrome b (Cyt-b). Journal of Fisheries and Aquatic Science, 10, 92-101.https://doi.org/10.3923/jfas.2015.92.101
[18] Brown, J.R., Bechenbach, A.T. and Smith, M.J. (1993) Intraspecific DNA Sequence Variation of the Mitochondrial Control Region of White Sturgeon (Acipenser transmontanus). Molecular Biology and Evolution, 10, 326-341.
[19] Meyer, A. (1993) Evolution of Mitochondrial DNA in Fishes. In: Mochachka, P.W. and Mommsen, T.P., Eds., Biochemistry and Molecular Biology of Fishes, Elsevier Press, New York.
[20] Fajen, A. and Breden, F. (1992) Mitochondrial DNA Sequence Variation among Natural Populations of the Trinidad Gtppy, Poecilia reticulata. Evolution, 46, 1457-1465.https://doi.org/10.1111/j.1558-5646.1992.tb01136.x
[21] Abdel-Hamid, Z.G., Heba, A.M., El-Kader, A., Aboelhassan, D.M. and Mahrous, K.F. (2014) Genetic Diversity in Egyptian Tilapia Species using PCR-RFLP of D-Loop Mitochondrial DNA Gene. Research Journal of Pharmaceutical, Biological and Chemical Sciences, 5, 469-475.
[22] Agbebi, O.T., Echefu, C.J., Adeosun, I.O., Ajibade, A.H., Adegbite, E.A., Adebambo, A.O., Ilori, M.B., Durosaro, S.O. and Ajibike, A.B. (2016) Mitochondrial Diversity and Time Divergence of Commonly Cultured Cichlids in Nigeria. British Biotech-nology Journal, 13, 1-7.https://doi.org/10.9734/BBJ/2016/25470
[23] Fontana, F., Conterio, F., Gandolfi, G., Tagliavini, J., Rosenthal, H., Bronzi, P. and McKenzie, D.J. (2007) Mitochondrial DNA Sequences of 6 Sturgeon Species and Phylogenetic Relationships within Acipenseridae. Journal of Applied Ichthyology, 15,17-22.
[24] Bouza, C., Vilas, R. and Castro, J. (2008) Mitochondrial Haplotype Variability of Brown Trout Populations from North-Western Iberian Peninsula: A Secondary Contact Area between Lineages. Conservative Genetics, 9, 917-920.
https://doi.org/10.1007/s10592-007-9398-8
[25] Norfatimah, M.Y., Abdulah, M.N.S., Othman, A.S., Patimah, I. and Jamsari, A.F.J. (2009) Genetic Variation of Lates Calcarifer in Peninsular Malaysia Based on the Cytochrome B Gene. Aquaculture Research, 40, 1742-1749.
https://doi.org/10.1111/j.1365-2109.2009.02279.x
[26] Pereyra, S., Garcia, G., Miller, P., Oviedo, S. and Domingo, A. (2010) Low Genetic Diversity and Population Structure of the Narrownose Shark (Mustelusschmitti).
Fisheries Research, 106, 468-473.https://doi.org/10.1016/j.fishres.2010.09.022
[27] Tseng, M.C., Shiao, J.C. and Hung, Y.H. (2011) Genetic Identification of Thunnus orientalis, Thunnus thynnus and Thunnus maccoyii by a Cytochrome b Gene Analysis. Environmental Biology of Fishes, 91, 103-115.
https://doi.org/10.1007/s10641-010-9764-0
[28] Ajibike, A.B. (2016) Genetic Diversity of Nigerian Indigenous Chicken using Mi-crosatellite Markers and Mitochondrial D-loopDNA Sequences. M. Agric. Disserta-tion, Department of Animal Breeding and Genetics, Federal University of Agricul-ture, Abeokuta.
[29] Hall, T.A. (1999) Bioedit: A User Friendly Biological Sequence Alignment Editor and Analysis Program for Windows 95/98/NT. Nucleic Acid Symposium Series, 41, 95-98.
DOI: 10.4236/ajmb.2018.81004 57 American Journal of Molecular Biology
[31] Excoffier, L., Guillaume, L. and Stefan, S. (2005) Arlequin. Version 3.0, an Inte-grated Software Package for Population Genetics Data Analysis. Evolutionary Bio-informatics Online, 1, 4750.https://doi.org/10.1177/117693430500100003
[32] Habib, M., Lakra, W.S., Vindhya, M., Praveen, K., Barman, A.S., Akanksha, S., Kul-deep, K.L., Peyush, P. and Asif, A.K. (2010) Evaluation of Cytochrome b mtDNA Sequences in Genetic Diversity Studies of Channa marulius (Channidae: Perci-formes). Molecular Biology Reports, 6, 41-49.
[33] Chambers, J.K., Macdonald, L.E., Sarau, H.M., Ames, R.S., Freeman, K., Foley, J.J., Zhu, Y., McLaughlin, M.M., Murdock, P., McMillan, L., Trill, J., Swift, A., Aiyar, N., Taylor, P., Vawter, L., Naheed, S., Szekeres, P., Hervieu, G., Scott, C., Watson, J.M., Murphy, A., Duzic, E., Klein, C., Bergsma, D.J., Wilson, S. and Livi, P. (2000) AG Protein-Coupled Receptor for UDP-Glucose. Journal of Biological Chemistry, 15, 10767-10771.https://doi.org/10.1074/jbc.275.15.10767
[34] Michu, E. (2007) A Short Guide to Phylogeny Reconstruction. Plant Soil and Envi-ronment, 53, 442-446.
[35] Singh, N.S., Bijay, K.B. and Anil, P.S. (2013) Population Structure of Puntius so-phore Inferred from Variation in Mitochondrial. International Journal of Research in Fisheries and Aquaculture, 3, 112-115.
[36] Brahmane, M.P., Kundu, S.N., Das, M.K. and Sharma, A.P. (2013) Low Genetic Di-versity and Absence of Population Differentiation of Hilsa (Tenualosailisha) Re-vealed by Mitochondrial DNA Cytochrome b Region in Ganga and Hooghly Rivers.
African Journal of Biotechnology, 12, 3383-3389.
[37] Masel, J. (2011) Genetic Drift. Current Biology, 21, R837-R838.
https://doi.org/10.1016/j.cub.2011.08.007
[38] Holsinger, K.E. and Bruce, S.W. (2009) Genetics in Geographically Structured Pop-ulations: Defining, Estimating and Interpreting Fixation Index (FST). Nature Re-views Genetics, 10, 639-650.https://doi.org/10.1038/nrg2611
[39] Nei, M. (1987) Molecular Evolutionary Genetics. Columbia University Press, New York.


![Figure 4. Neighbor-Joining phylogenetic tree showing the relationship between tilapia fish based on two mtDNA regions [SS1-15 = South-South D-loop; SS16-SS30 = South-South cyt b; SW1-13 = South-West D-loop]](https://thumb-us.123doks.com/thumbv2/123dok_us/28608.502820/8.595.136.538.66.664/figure-neighbor-joining-phylogenetic-showing-relationship-tilapia-regions.webp)