ISSN Online: 2473-1900 ISSN Print: 2473-1889
DOI: 10.4236/ojogas.2018.31001 Jan. 31, 2018 1 Open Journal of Yangtze Gas and Oil
Research on Realization of Petrophysical Data
Mining Based on Big Data Technology
Yu Ding
1,2, Rui Deng
2,3, Chao Zhu
4*1School of Computer Science, Yangtze University, Jingzhou, China
2Key Laboratory of Exploration Technologies for Oil and Gas Resources (Yangtze University), Ministry of Education, Wuhan, China
3School of Geophysics and Oil Resource, Yangtze University, Wuhan, China
4The Internet and Information Center, Yangtze University, Jingzhou, China
Abstract
This paper studied the interpretation method of realization of data mining for large-scale petrophysical data, which took distributed architecture, cloud computing technology and B/S mode referred to big data technology and data mining methods. Based on petrophysical data mining application of K-means clustering analysis, it elaborated the practical significance of application asso-ciation with big data technology in well logging field, which also provided a scientific reference for logging interpretation work and data analysis and processing method to broaden the application.
Keywords
Big Data Technology, Data Mining, Logging Field Method
1. Introduction
With the increasing scale of oil exploration and the development of engineering field, the application of high-tech logging tools is becoming more and more ex-tensive. The structural, semi-structured and unstructured complex types of oil and gas exploration data are exploded. In this paper, the petrophysical data was taken as the object; Big data technology and data mining methods were used for data analysis and processing, which mines effective and available knowledge to assist routine interpretation of work and to broaden the scientific way to en-hance the interpretation of precision. The research allows full play to great po-tential of logging interpretation for comparative study of geologic laws and oil and gas prediction.
How to cite this paper: Ding, Y., Deng, R. and Zhu, C. (2018) Research on Realization of Petrophysical Data Mining Based on Big Data Technology. Open Journal of Yangtze Gas and Oil, 3, 1-10.
https://doi.org/10.4236/ojogas.2018.31001
Received: May 24, 2017 Accepted: January 28, 2018 Published: January 31, 2018
Copyright © 2018 by authors and Scientific Research Publishing Inc. This work is licensed under the Creative Commons Attribution International License (CC BY 4.0).
http://creativecommons.org/licenses/by/4.0/
DOI: 10.4236/ojogas.2018.31001 2 Open Journal of Yangtze Gas and Oil The rapid development of network and computer technology as well as the large-scale use of database technology makes it possible to extract effective in-formation from petrophysical data in more different ways adopted by logging interpretation. Relying on the traditional database query mechanism and ma-thematical statistical analysis method, it is difficult to satisfy the effective processing of large-scale data. It tends to be that the data contains a lot of valua-ble information, but it cannot be of efficient use because the data is in an isolated state and cannot be transformed into useful knowledge applied to logging inter-pretation work. Too much useless information will inevitably lead to the loss of information distance [1] and useful knowledge which is in the “rich information and lack of knowledge” dilemma [2].
2. Analysis of Big Data Mining of Petrophysical Data
2.1. Processing Methods of Big Data
Big data can be taken as the reasons for the basis of the data scale, and it is diffi-cult to use existing software tools and mathematical methods in a reasonable time to achieve the analysis and processing of data which has the features of large scale, complex structure and many types [3].
At present, the amount of rock physical data information gradually increases more and more types, which is consistent with the basic characteristics of big data. With the advantages of cloud computing in data processing performance and the good characteristics of distributed architecture, the existing C/S mode interpretation method is transformed into B/S mode on basis of distributed ar-chitecture. Then, the situation, in which processing capacity of the original client single node is insufficient, can be handled through increasing the horizontal scaling of the monomer processing node and the node server in the condition of the rational allocation and the use of system resources. Meanwhile, the on-line method is adopted for the analysis and processing of the petrophysical data which can store the data mining results and analysis process in the server. Interpreters can interpret process documents through querying the server-side to make a more reasonable explanation of the logging data in the unknown area or the same type of geological conditions, which can achieve the change of data sharing from the lower stage (data sharing) to the advanced stage (knowledge sharing).
The essence of big data processing methods can be seen as the development and extension of grid computing and prior distributed computing. The signific-ance of big data processing does not just lie in the amount of data, but in these massive available data resources in which valuable information can be gained quickly and effectively while the available mode can be mined and the purpose of acquiring new knowledge can be achieved.
2.2. Overview of Big Data Technology
2.2.1. Distributed System Architectureunder-DOI: 10.4236/ojogas.2018.31001 3 Open Journal of Yangtze Gas and Oil lying and the upper-level file system. It is the software system on the basis of the network with a high degree of cohesion and transparency. The distributed sys-tem architecture can be considered as the software architecture design that op-erates in multiple processors. This paper chooses HDFS open source distributed file system to build software operating environment [4].
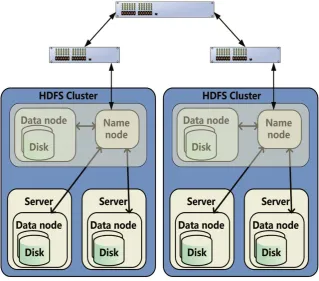
[image:3.595.213.533.235.516.2]HDFS system architecture shown in Figure 1 adopts master/slave architec-ture, and an HDFS cluster is composed of a Namenode and a number of Data-nodes. The Namenode node is used to manage the namespace of the file system and to handle client access to the file. The Datanodenode is used to manage the li-teracy requests of the storage and processing of the file system clients on its nodes.
Figure 1. HDFS system architecture.
2.2.2. Cloud Computing Technology
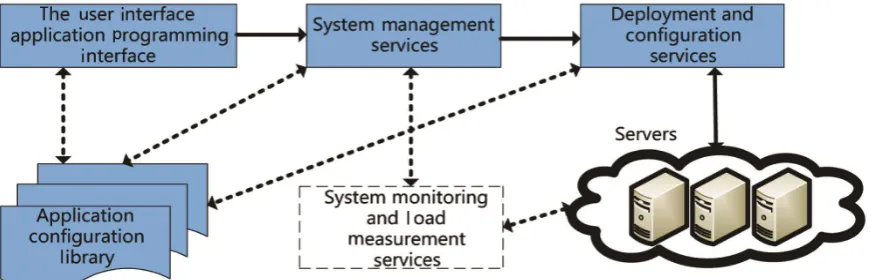
Cloud computing is the Internet-based computing which has been put forward on the basis of the context of the development, being stuck in the bottlenecks, of the traditional computer storage technology and computing capacity (Figure 2)
DOI: 10.4236/ojogas.2018.31001 4 Open Journal of Yangtze Gas and Oil Figure 2. Cloud computing architecture.
2.3. The Combination and Application of Data Mining Methods
2.3.1. Clustering Mining MethodData clustering is one of the important tasks of data mining. Through clustering, it is possible to clearly identify the regions between inter-class and intra-class of data concentration, which is convenient to understand the global distribution pattern and to discover the correlation between data attributes [7].
In the pattern space S, if given N samples X1, X2, ∙∙∙, Xn, the clustering is de-fined to find the corresponding regions R1, R2, ∙∙∙, Rm, according to the similarity degree of each other; any of Xi (i = 1, 2, ∙∙∙, N) is classified into only one instead of the two classes at the same time, to wit, R1∪R2∪∪Rm=R and
i j
R ∩R = ∅ (i ≠ j) [8]. Clustering analysis is mainly based on some features of the data set to achieve division according to the specific requirements or rules, which satisfies the following two characteristics under normal circumstances: intra-class similarity, namely, that data items in the cluster should be as similar as possible; inter-class dissimilarity, namely, that data items in the heterogene-ous cluster should be as different as possible [9].
2.3.2. Petrophysical Data Clustering Mining Analysis
DOI: 10.4236/ojogas.2018.31001 5 Open Journal of Yangtze Gas and Oil random noise is used to achieve the purpose of lithological and stratigraphic di-vision.
3. Mining Based on K-Means Clustering Analysis
3.1. K-Means Algorithm Principle
Assuming that there is a set of elements, the goal of K-means is to divide the elements of the set into K clusters or classes so that the elements within each clus-ter have a high degree of similarity while the similarity of elements of different clusters is low, namely, similar elements are clustered into a collection, eventually forming the multiple clustering clustered by feature-similar elements [10].
K-means first randomly generates k objects from n data as the initial cluster-ing center while the rest of the data objects are clustered by calculatcluster-ing the simi-larity (distance) of each data to the clustering centers (minimum distance be-tween the two points), to divide the data object into the class, and then to recal-culate the new cluster of the class center formed by each cluster (cluster the mean of all data objects) to update the cluster class center as the next class center of the iterations. It repeats the clustering process until the criterion function be-gins to converge.
In this paper, the Euclidean distance is taken as the discriminant condition of similarity measure, and the criterion function Er is defined as the error sum of the squares of all the data objects to the class center. Obviously, the purpose of the K-means algorithm is to find K divisions of the data set based on the optimal criterion function.
2 r
1 i
K
i i x C
E x x
= ∈
=
∑ ∑
− (1)Here, X represents a data object in the data set; Ci represents the ith cluster, and xi represents the mean of cluster Ci.
3.2. Lithological Division Based on K-Means
The logging physics values of the same layer lithology are relatively stable and generally do not exceed an allowable error. The mean value of the samples in the same layer can be used to represent the overall true value of the similar parts of the surrounding lithology. When the difference between the value of the adja-cent sampling point and the mean is within the given error range, the lithologi-cal type of the point can be replaced by the lithology corresponding to the mean. Otherwise, it will proceed with the search for the home class until the division of all sampling points is completed. In order to facilitate the study, this paper se-lects the natural gamma logging curve with strong longitudinal resolution for the division of lithology, while the other passive curves are selected to adjust the division results to improve the accuracy of the decision outcomes in the comple-tion of the lithological division at the same time.
DOI: 10.4236/ojogas.2018.31001 6 Open Journal of Yangtze Gas and Oil as follows,
(
) (
2)
2e 1 2 1 2
D = X −X + Y −Y (2)
[image:6.595.202.538.259.340.2]Here, Figure 3 is taken as the example to show the clustering process of K-means petrophysical data. In Figure 3(a), the black triangles are labeled in two-dimensional space with two-dimensional eigenvectors as coordinates. They can be regarded as examples reflected by two-dimensional data (composed of the data of two logging curves), that is, primitive petrophysical data sets in need of clustering. Three different colored boxes represent the clustering center points (analogical to some lithology) given by random initialization. Figure 3(b) shows the results of the completion of clustering, that is, to achieve the goal of lithological division. Figure 3(c) shows the trajectory of the centroid in the iterative process.
Figure 3. Clustering process of petrophysical data.
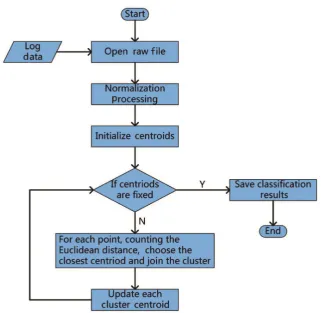
The program flow chart is shown in Figure 4 as follow.
[image:6.595.212.534.393.706.2]DOI: 10.4236/ojogas.2018.31001 7 Open Journal of Yangtze Gas and Oil
3.3. Software Implementation
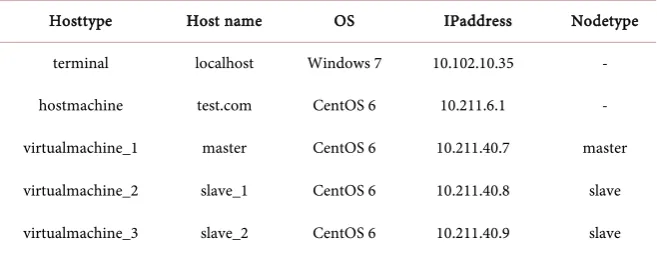
[image:7.595.210.539.286.413.2]3.3.1. Distributed Architecture and Cloud Computing Environment Hadoop operates three modes—the stand-alone, pseudo-distributed and fully distributed. Taking into account the test environment required for the simula-tion software operasimula-tion and the main content of this study with the combinasimula-tion of methods to the application, the test environment adopts Hadoop’s fully dis-tributed mode in which VMware vSphere 5.5 is used to build another two virtual machines with the CentOS 6 Linux system in the high-performance server equipped with CentOS 6 and the distributed computing is done by three nodes in the cluster (Table 1). Different from the physical node, the cluster node is the use of software virtual composition and the actual operation of the process with differences in performance.
Table 1. Description of the hosts and terminals in the cluster.
Hosttype Host name OS IPaddress Nodetype
terminal localhost Windows 7 10.102.10.35 -
hostmachine test.com CentOS 6 10.211.6.1 -
virtualmachine_1 master CentOS 6 10.211.40.7 master
virtualmachine_2 slave_1 CentOS 6 10.211.40.8 slave
virtualmachine_3 slave_2 CentOS 6 10.211.40.9 slave
3.3.2. Application and Analysis
A total of three production wells in the SZ development Zone of an oilfield are selected to complete the conventional logging interpretation pretreatment by using the collected core material of core section of well walls, relatively complete logging data, geological and drilling data combined with the actual geological conditions, in which the samples with possible existence of the borehole diame-ter, too large proportion of mud and too high viscosity, leading to measurement curve distortion of the logging instrument, are selected to choose the sample da-ta with the true reflection of the strada-ta information. Then, according to the de-scription of the reservoir performance and the actual division of the corres-ponding oil and gas standards, the lithology of the working area is divided into four distinct divisions, namely, sandstone, argillaceous sandstone, sandy mud-stone and mudmud-stone combined with the core material.
After the K-means algorithm and the lithological judgment condition are programmed, the B/S mode and the cloud computing technology are used to di-vide the well section lithology of the petrophysical data mining program in the cluster in the built fully distributed simulation environment of Hadoop. The accuracy of lithology is about 78%, and the accuracy of sandstone and mud-stone is relatively high which is more than 85%, and the results are shown in
DOI: 10.4236/ojogas.2018.31001 8 Open Journal of Yangtze Gas and Oil Figure 5. Data mining result.
The data in Figure 5 shows that the same notions of SPLI values indicate that they are of the same layer, i.e., lithological consistency or similarity viewed from the results of artificial stratification. Compared with the data mining results, due to the difference of the value of the empirical coefficient in the stratigraphic age, the division results based on the discriminant conditions are different in some logging sampling points. According to the correction process of the core data, the result is related to the value of the empirical coefficient. For a certain section of stratum, the value of 2 may have a relatively high degree of coincidence. Simi-larly, the value of 3.7 of some layers have a relatively high degree of coincidence. This also shows that the general selection of the single empirical coefficient may have an impact on the accuracy of the interpretation results. On the one hand, viewed form the upper and lower adjacent types, the results are identified cor-rectly which belong to the same kind of lithology. On the other hand, viewed from the comparison of the results of the left and right division, the lithological division has changed while the corresponding SPLI value is not exactly the same, indicating that the data have the value of further fine study.
Therefore, in-depth study of inconsistent results of lithological division can help to find valuable unexpected pattern in petrophysical data. Compared with the experimental methods and empirical methods, this method of “Data to talk”, from which the potential correlation and extract knowledge are explored, leads to the more objection and science for some regional empirical parameter values and empirical formulas in scientific induction and summary.
DOI: 10.4236/ojogas.2018.31001 9 Open Journal of Yangtze Gas and Oil Figure 6. Running time of program in Windows and HDFS.
4. Conclusions
1) The advantages of distributed architecture and cloud computing are used to improve the overall processing capacity of the system, and in the process of large-scale petrophysical data processing, the B/S mode is integrated to achieve data mining to combine big data analysis and processing mechanism with con-ventional interpretation. The exploratory research idea of the new method of logging interpretation is put forward, with the starting point of discovering the novel knowledge, to provide a scientific reference for the routine widening ap-plied by the interpretation work and data analysis methods.
2) The combination of multidisciplinary knowledge and the rational applica-tion of cross technology can perfect the deficiencies in the existing logging in-terpretation to a certain extent, making the inin-terpretation work of qualitative analysis and quantitative computing of logging data more scientific, with favora-ble theory and practical guidance significance.
Acknowledgements
This work is supported by Yangtze University Open Fund Project of key labora-tory of exploration technologies for oil and gas resources of ministry of educa-tion (K2016-14).
References
[1] Wang, H.C. (2006) DIT and Information. Science Press, Beijing.
[2] Wang, L.W. (2008) The Summarization of Present Situation of Data Mining Re-search. Library and Information, 5, 41-46.
[3] Pan, H.P., Zhao, Y.G. and Niu, Y.X. (2010) The Conventional Well Logging Data-base of CCSD. Chinese Journal of Engineering Geophysics, 7, 525-528.
[4] Ghemawat, S., Gobioff, H. and Leung, S.-T. (2003) The Google File System. ACM SIGOPS Operating Systems Review, 37, 29-43.
https://doi.org/10.1145/1165389.945450
Tuto-DOI: 10.4236/ojogas.2018.31001 10 Open Journal of Yangtze Gas and Oil rials, 13, 311-336. https://doi.org/10.1109/SURV.2011.032211.00087
[6] Low, Y., Bickson, D., Gonzalez, J., et al. (2012) Distributed GraphLab: A Framework for Machine Learning and Data Mining in the Cloud. Proceedings of the VLDB Endowment, 5, 716-727. https://doi.org/10.14778/2212351.2212354
[7] Song, Y., Chen, H.W. and Zhang, X.H. (2007) Short Term Electric Load Forecasting Model Integrating Multi Intelligent Computing Approach. Computer Engineering and Application, 43, 185-188.
[8] Abraham, B. and Ledolter, J. (1983) Statistical Methods for Forecasting. John Wiley & Sons, Inc., NewJersey.
[9] Farnstrom, F., Lewis, J. and Elkan, C. (2000) Scalability for Clustering Algorithms Revisited. AcmSigkdd Explorations Newsletter, 2, 51-57.
https://doi.org/10.1145/360402.360419