Impact of North-South Shift of Azores High on Summer
Precipitation over North West Europe
Shahnaz Ali Rashid1,2, Muhammad Jawed Iqbal2,3, Muhammad Arif Hussain4
1Department of Sciences & Humanities, National University of Computer & Emerging Sciences (FAST), Karachi, Pakistan 2Department of Mathematics, University of Karachi, Karachi, Pakistan
3Institute of Space & Planetary Astrophysics, University of Karachi, Karachi, Pakistan 4Institute of Business and Technology, Karachi, Pakistan
Email: javiqbal@uok.edu.pk
Received August 21, 2012; revised September 23, 2012; accepted October 19, 2012
ABSTRACT
Several Studies demonstrate that North Atlantic Oscillation (NAO) influences variability of climate over Europe. As NAO is has significant influence on climate of Europe during boreal cold season (November to April), we use the cen-ters of action approach for the study of summer precipitation (June to August) variability over Europe, taking into ac-count variations in the components of the NAO North Atlantic Oscillation (NAO), the Azores High and the Icelandic Low pressure systems. This study shows that north-south shifts of the Azores High has significant impact on interan-nual variations of summer precipitation over North West Europe, there being more precipitation when the Azores High shifts southward versus when it is northward. Thus this article demonstrate that when the Azores High system is to the south there is flux of moist and warm air from the Atlantic into NW Europe. We present a regression model for summer precipitation over North-west in which the Azores High latitude and the Icelandic low longitude are independent vari-ables and it explains 53 percent of the variance of precipitation during 1952-2002, a significant enhancement over the NAO value of R2 = 0.10.
Keywords: NAO; COA; Azores High Pressure; Icelandic Low Pressure
1. Introduction
North Atlantic Oscillation (NAO) is the most prominent and persistent pattern of atmospheric variability over middle and high latitudes of the Northern Hemisphere. It refers to swings in the atmospheric sea level pressure difference between Arctic and subtropical Atlantic that are most perceptible during boreal cold seasons (No-vember to April) and linked with changes in the mean wind speed and direction [1-4]. Such changes alter the seasonal mean heat and moisture transport between the Arctic and the neighboring countries, as well as the in-tensity and number of storms, their path and their weath-er. Therefore, NAO has been identified as one of the five principal research areas of the DecCen component of CLIVAR [5].
However, NAO is a useful concept to explain the va-riability of precipitation during winter season; it is less useful during summer, as the Icelandic Low ceases to be important [6]. Therefore, several studies even employ winter NAO for describing the summer precipitation va-riability [7,8]. This article investigates possible role of Azores High on precipitation over Europe during the summer season. In this paper, centers of action ap-
proach [9-11] is employed for the mentioned purpose. The centers of action (COA) which are the large semi- permanent pressure systems seen in the global distribu-tion of sea level pressure [12], such as the Azores High or the Icelandic Low, dominating the atmospheric circu-lation over a large region. Each COA is characterized by three indices: the longitudinal and latitudinal positions of its center of gravity and its central pressure. Hence, in contrast to the NAO, the COA approach makes use of the information on position as well as pressure. It therefore provides additional degrees of freedom so as to more directly explain the interannual variations of summer precipitation over Europe. In fact, this paper examines how the intensity and position of Azores High as well as Icelandic Low have impact on precipitation during sum-mer seasonan.
2. Data
We use monthly precipitation data obtained from Climate Research Unit, University of East Anglia:
http://www.cru.uea.ac.uk/cru/data/hrg/cru_ts_2.10 for the period from 1952 to 2002 for the Iberian Peninsula. Monthly averaged gridded SLP data are also used for
calculating objective COA indices for the monthly aver- aged pressure, latitude and longitude of the Icelandic Low pressure, the Azoress High pressure and Siberian High pressure systems as described by [13]. NAO, AO and SOI monthly indices are available at the Climate Data Center, National Center for Environmental Prediction.
3. Method
As we know that the NAO index is defined by measure-ment of the pressure difference between the Icelandic Low and Azores High at two fixed locations, Lisbon, Portugal and Stykkisholmur, Iceland. However, it is known that these two pressure systems have extended structures that migrate considerably and their motions are not entirely coupled. As such, a better estimate of influ-ence of atmospheric pressure fluctuations on the climate variability in this region can be attained through a more quantitative assessment of the fluctuations in the pressure and locations of Icelandic Low and Azores High. Each of these COA exhibits a characteristic seasonal cycle. Dur-ing winter the Icelandic Low and the Azores High are most pronounced. In summer the low-pressure center weakens, and the Azores High dominates. In addition to a weakening and strengthening of the pressure centers, there is also displacement; for example, in summer the Azores High moves to the northeast compared to the summer season. The position and the strength of each COA are captured by three indices representing its lon-gitude, latitude, and pressure. Recently, this approach has successfully been used to explain the role of the move-ment and intensity of individual atmospheric COAs on such varied biogeochemical systems as copepod abun-dance [14], the variation in the location of the Gulf Stream [15] the variability of the transport of African dust [16], impact of Indian Ocean High pressure on pre-cipitation over Western Australia [17] and influence of Azores High on Middle Eastern Rainfal [18].
The pressure index Ip is defined as an area-weighted
pressure departure from a threshold value over the do-main (I, J):
,
1 1 , 1 1 cos cos I Jij t t i j
p t I J
ij i j P P I
, , 1 M ij ij tij t
where Pij,t is the SLP value at grid point (i, j)average
over a time interval t, in this case monthly SLP values
are taken from NCAR, Pt is the threshold SLP value (Pt =
1014 mb for Azores High and Icelandic Low), ij is the
latitude of the grid point (i, j), M = 0 for the Azores High
and for the Icelandic Low. = 1 if (−1)M(
Pij,t− Pt) > 0
and = 1 if (−1)M(
Pij,t− Pt) < 0, this ensures that the
pressure difference is due to an Azores High or Icelandic
Low system. The intensity is thus a measure of the ano-maly of the atmospheric mass over the section (I, J).
Similarly, the latitudinal index is defined as:
, , 1 1 , , , 1 1 cos 1 cos 1 I J M ij t t ij ij ij t i j
t I J
M
ij t t ij ij t
i j P P I P P
and the longitudinal index I,t.
We first calculate seasonal average of summer pre-cipitation for the months from June to August over the European region bounded by 30˚N - 70˚N and 10˚W - 30˚E at each grid point. We next compute correlation of summer precipitation at each grid point over Europe with NAO and COA indices (Azores High pressure, Azores High latitude, Azores High longitude, Icelandic Low pressure, Icelandic Low latitude, Icelandic Low longi-tude). The purpose is to identify regions where a signifi-cant amount of variation can be possibly explained by further study.
Next we identify the indices with large contributions that could be significant. Correlations are calculated among the Centers of Action (CAO) indices. Only mutu-ally independent indices are considered for further inves-tigation. Thus, significant independent COA indices are identified for the construction of a linear regression model of summer precipitation of north Europe.
4. Results
We construct the correlation maps for examining the influence of NAO as well as COA variables on summer-time (JJA) precipitation with p = 0.05. NAO has
signifi-cant relation with summer precipitation in some places in England and Ireland (see, Figure 1). However, Figure 2 also shows that summer precipitation over a large region of north-west Europe is strongly correlated with Azores High Latitude (see, Figure 2). Therefore, we select the region (10˚W - 8˚E, 44˚ - 58˚N) in north-west Europe for the further analysis of summer precipitation
Then, we next compute correlations between six indi-ces of COA (Icelandic Low latitude, Icelandic Low lon-gitude, Icelandic Low pressure, Azores High pressure, Azores High latitude, Azores High longitude), AO, Ni-no34 and NOA with the mean of summer precipitation for the region of north-west Europe.
[image:2.595.92.252.581.629.2]Figure 1. Correlation summer precipitation over Europe and NAO.
[image:3.595.58.285.594.730.2]Figure 2. Correlation summer precipitation over Europe and Azores High latitude.
Table 1. Correlation coefficients of summer precipitation over north-west Europe with NAO, AO and the center of action (COA) variables.
# Variables Correlation Coefficients
1 NAO −0.29
2 AO −0.52
3 Nino34 0.29
4 ILPS 0.49
5 AZPS −0.11
6 ILLT −0.70
7 ILLN 0.31
8 AZLT −0.69
9 AZLN −0.44
10 ILLNA & ILLT 0.74 (55)
11 ILLN & AZLT 0.725 (53)
summer NAO, AO and Nino34 have −0.29, −0.5 and 0.29 respectively with the precipitation of NW Europe.
To examine the variable which has dominant influence on summer precipitation over NW Europe, we compute the partial correlation coefficients for NAO index, AO index, Nino34, Azores High Longitude and summer precipitation. The partial correlation coefficients report the contribution from a given index on the winter pre- cipitation while holding all other independent variable fixed. As shown in Table 2, Azores High latitude and winter precipitation are correlated 95% percent confi- dence level, when these indices are held fixed. Thus the partial correlation, r = −0.57, which shows that the posi-
tion of Azores latitude has a direct and significant effect on the summer precipitation over NW Europe. Similarly, the partial correlation between AO index and the pre- cipitation is −0.32, keeping other variables as fixed. However, the partial correlations between NAO index the precipitation and between Nino34 and precipitation are not significant. Thus it shows that Azores High lati- tude has dominant influence on summer precipitation over NW Europe.
As Icelandic Low longitude and Icelandic Low latitude has not significantly correlated (correlation between them is −0.11), we construct a linear model of summer precipitation over NW Europe using these two variables. Thus, we have a linear model of precipitation:
NWER = 1210.452 − 14.922 (ILLat) + 1.613 (ILLon).
R2 for the region is 0.55, a significant enhancement
over the NAO value of R2 = 0.10.
Similarly, we also construct a linear model using two independent variables i.e. Azores High latitude and
Ice-landic Low longitude. Thus, we have another linear model of precipitation:
NWER = 1655.677 − 40.216 (AHLat) +1.613 (ILLon).
R2 for the region is 0.53, a significant enhancement
over the NAO value of R2 = 0.10.
[image:3.595.308.535.651.733.2]By separating the NAO index into COA components, we have been able to isolate the main variable related to the precipitation and thus improve our regression model by 43% over the fit to the NAO data alone. The regres-
Table 2. Partial correlation matrix for winter precipitation of Iberia with respect to NAO index, AO, Nino 34 and, Azores High latitude.
# Variables Partial Correlation Coefficients
1 NAO index and Rain −0.01
2 AO index and Rain −0.33
3 Nino34 and Rain −0.07
4 AHLT and Rain −0.57
air from the Atlantic into NW Europe. sion with Azores High latitude and Icelandic Low
lati-tude (including Icelandic Low Longilati-tude) both sepa-rately capture the major patterns of wintertime observed precipitation variations from 1952 to 2002 over NW Europe (Figures 3-4).
The pressure composite for the years of extreme south minus extreme north of Azores High at 850 mb is shown in Figures 7. This figure shows that there is anomalous low pressure band extends over North Atlantic and west-ern Europe. Figure 8 shows the vector wind differences at 850 mb between the winters in which the when Azores High latitude was located to extreme south. There is anomalous cyclonic flow Over Northern Atlantic and NW Europe. We know that the seasonal mean cyclonic anomalies represent greater frequency of synoptic scale storm in the region. As shown in Figure 9, when Azores High latitude was located to extreme north, vector wind anomaly shows that there is anomalous anticyclonic flow over Northern Atlantic and NW Europe. We know that the seasonal mean anticyclonic anomalies represent greater frequency of blocking episode in the region. Thus our analysis confirms that regional circulations of the atmosphere and the ocean are consistent with the em-pirically determined relationship between summer pre-cipitation and Azores High latitude.
5. Mechanisms for the Relationships between
Azores High Latitude and the
Precipitation Variability
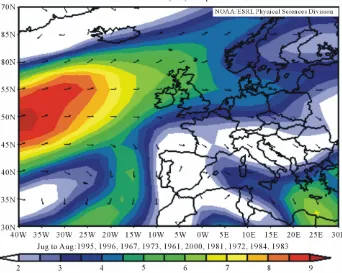
In this section we present evidences that regional circula-tions of the atmosphere and the ocean are consistent with the empirically determined relationships. We construct different composites with the phase of Azores High lati-tude using NCEP/NCAR Reanalysis monthly averaged fields of winds, pressure and humidity. Figure 5 shows composite mean of 850 mb vector wind for 10 years when Azores High latitude was located to extreme north (dry over north-west Europe). The strong jet is located at 50˚N. While, Figure 6 shows composite mean of 850 mb vector wind for 10 years when Azores High latitude was located to extreme south (more rain over north-west Eu-rope). The jet is displaced southward by 5˚N. There is direct westerly flow over north-west Europe. When the Azores High system is to the south there is flux of moist
6. Conclusions and Discussion
The North Atlantic Oscillation has been considered the
0 50 100 150 200 250 300 350
1952 1956 1960 1964 1968 1972 1976 1980 1984 1988 1992 1996 2000 Years
Prec
ipitation (mm)
[image:4.595.88.512.399.689.2]Observed Regression
0 50 100 150 200 250 300 350
1952 1956 1960 1964 1968 1972 1976 1980 1984 1988 1992
Years
Pr
e
c
ip
it
at
io
n (
m
m
)
[image:5.595.91.509.82.378.2]1996 2000 Observed Regression
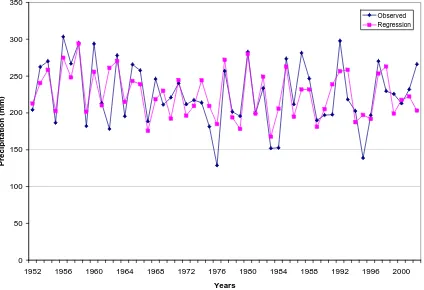
Figure 4. A comparison of the summer precipitation of NW Europe and our modeled values based on linear regression model for the years 1952-2002. The independent variables in our regression model are June, July and August (JJA) averaged Azores High Latitude (AHLat) and Icelandic Low Longitude. The variance in the winter precipitation explained by our re-gression model is R2 = 0.53.
Figure 5. 850 mm vector wind speed shows that when Azores High displaced northwards, jet is located around 50˚N.
[image:5.595.126.468.446.719.2]Figure 6. 850 mm vector wind speed shows that when Azores High displaced southwards, jet displaced southward by 5 de-grees.
[image:6.595.87.511.433.707.2]Copyright © 2012 SciRes. IJG Figure 8. Composite anomaly of vector wind at 850 mb shows that the anomalous cyclonic flow over Northern Atlantic and NW Europe when Azores High displaced southward.
Figure 9. Composite anomaly of vector wind at 850 mb shows that the anomalous anticyclonic flow over Northern Atlantic and NW Europe when Azores High displaced northward.
dominant modulator of regional variability over Europe. The results presented in this work show that north-south shifting of Azores High latitude and Icelandic Low lati-tude is the primary dominant dynamical mode for ex-plaining variations in summer precipitation over NW Europe. This mode explains significantly greater vari-ance in summer precipitation variability than the North Atlantic Oscillation or the Arctic Oscillation. When the Azores High system is to the south there is flux of moist and warm air from the Atlantic into NW Europe.
There has been a discussion in the literature on weath-er the NAO or the AO represent the best paradigm for representing atmospheric variability in the north Atlantic
[image:7.595.165.433.346.540.2]can be shown to be more pervasive and extensive than can be accounted for processes operating in or remotely forced from the Atlantic sector, it would argue in favor of annular mode paradigm”. In the results presented in this
paper we see that the four criteria listed by Wallace are satisfied and that would favor the NAO as the better pa-radigm. However, the correlation of precipitation over NW Europe with the NAO is smaller than with the AO. The results presented in this paper show that this is be-cause the NAO definition, as traditionally defined, does not include the interannual variations in the sea level pressure distribution in the north Atlantic. The north At-lantic is the dominant influence on of precipitation over NW Europe, but the relevant dynamics cannot be repre-sented by time variations of affixed pattern such as an EOF, a formalism that can be used to define the NAO and AO.
This article suggests that the north-south fluctuations of the Azores High is a dynamical mode of tropospheric variability which is not adequately represented by either the AO or the NAO paradigms. This is because both the AO and the NAO are defined as EOFs (Wallace, 2000). However, a major limitation of the EOF method is that it seeks to find a time independent pattern in the data field, and gives the principal component as the time variation of the fixed pattern. We suggest that the COA is a better paradigm in comparison with NAO or NAM for under-standing regional variations.
REFERENCES
[1] M. H. P. Ambaum, B. J. Hoskins and D. B. Stephenson, “Arctic Oscillation or North Atlantic Oscillation?”
Jour-nal of Climate, Vol. 14, No. 16, 2001, pp. 3495-3507.
doi:10.1175/1520-0442(2001)014<3495:AOONAO>2.0.C O;2
[2] F. Bakalian, S. Hameed and R. Pickar, “Influences of the Icelandic Low Latitude on the Frequency of Greenland Tip Jet Events: Implications for Irminger Sea Convec-tion,” Journal of Geophysical Research, Vol. 112, 2007, 6 p.
[3] A. Colman and M. Davey, “Prediction of Summer Tem-perature, Precipitation and Pressure in Europe from Pre-ceding Winter North Atlantic Ocean Temperature,”
In-ternational Journal of Climatology, Vol. 19, No. 5, 1999,
pp. 513-536.
doi:10.1002/(SICI)1097-0088(199904)19:5<513::AID-JO C370>3.0.CO;2-D
[4] P. Ginoux, J. Prospero, O. Torres and M. Chin, “Long- Termsimulation of Global Dust Distribution with the GOCART Model: Correlation with North Atlantic Oscil-lation,” Environmental Modelling & Software, Vol. 19, No. 2, 2004, pp. 113-128.
doi:10.1016/S1364-8152(03)00114-2
[5] S. Hameed, W. Shi, J. Boyle and B. Santer, “Investiga-tion of the Centers of Ac“Investiga-tion in the North Atlantic and the
North Pacific,” Proceedings of the 1st International
AMIP Scientific Conference, Monterey,Vol. 92, 1995, pp.
221-226.
[6] S. Hameed and S. Piontkovski, “The Dominant Influence of the Icelandic Low on the Position of the Gulf Stream Northwall,” Geophysical Research Letters, Vol. 31, 2004,
4 p. doi:10.1029/2004GL019561
[7] S. Hameed, M. J. Iqbal, S. Rehaman and D. Collins, “Impact of the Indian Ocean High Pressure System on Winter Precipitation over Western Australia and Southwest Western Australia,” Australian Meteorological and Oceano-
graphic Journal, Vol. 61, 2011.
[8] J. W. Hurrell, “Decadal Trend in the North Atlantic Os-cillation: Regional Temperatures and Precipitation,” Sci-ence, Vol. 269, No. 5224, 1995, pp. 676-679.
doi:10.1126/science.269.5224.676
[9] J. W. Hurrell and H. van Loon, “Decadal Variations in Climate Associated with the North Atlantic Oscillation,”
Climatic Change, Vol. 36, No. 3-4, 1997, pp. 301-326.
doi:10.1023/A:1005314315270
[10] W. Hurrel and C. K. Folland, “A Change in the Summer Atmospheric Circulation over the North Atlantic,”
Ex-changes, No. 25, 2002.
[11] M. J. Iqbal, S. Hameed and F. Khan, “Influence of Azores High Pressure on Middle Eastern Rainfall,” Theoretical
and Applied Climatology, 2012.
doi:10.1007/s00704-012-0648-4
[12] P. S. Kettlewell, D. B. Stephenson, M. D. Atkinson and P. D. Hollins, “The Impact of Winter NAO on Summer Pre-cipitation in NW Europe,” Geophysical Research
Ab-stracts, Vol. 5, 2003, p. 12398.
[13] P. S. Kettlewell, D. B. Stephenson, M. D. Atkinson and P. D. Hollins, “Summer Precipitation and Wheat Grain Quality: Relationship with the North Atlantic Oscilla-tion,” Weather, Vol. 58, 2003, 9 p.
[14] S. Piontkovski and S. Hameed, “Precursors of Copepod Abundance in the Gulf of Maine in Atmospheric Centers of Action and Sea Surface Temperature,” Global
Atmos-phere and Ocean System, Vol. 8, No. 4, 2002, pp. 283-
291.
[15] B. Qian, J. Corte-Real and H. Xu, “Is the North Atlantic Oscillation the Most Important Atmospheric Pattern for Precipitation in Europe,” Journal of Geophysical
Re-search, Vol. 105, No. D9, 2000, p. 11901.
[16] N. Riemer, O. M. Doherty and S. Hameed, “On the Vari-ability of African Dust Transport across the Atlantic,”
Geophysical Research Letters, Vol. 33, 2006, 4 p.
[17] J. C. Rogers, “On the Cause of Mild Winters in Northern Europe,” NCAR Technical Note, 1997, pp. 5l-67.
[18] C. G. Rossby, “Relation between Variations in the Inten-sity of the Zonal Circulation of the Atmosphere and the Displacement of the Semipermanent Centers of Actions,”
Journal of the Marine Research, Vol. 2, 1939, pp. 38-55.
[19] J. M. Wallace, “North Atlantic Oscillation/Annular Mode: Two Paradigms-One Phenomenon,” Quarterly Journal of
the Royal Meteorological Society, Vol. 126, No. 564,