Is Consumption in the United States and Japan Too Much
or Too Little?
Yutaka Kurihara1, Kei Tomimura2
1Department of Economics, Aichi University, Nagoya, Japan; 2Department of Business Administration, Aichi University, Nagoya,
Japan.
Email: kurihara@vega.aichi-u.ac.jp
Received May 25th, 2012; revised June 14th, 2012; accepted June 23rd, 2012
ABSTRACT
This article reports on the results of an empirical examination of whether consumption in the United States and Japan is too much or too little relative to productivity in these countries (1993-2011). Findings reveal some clear and common characteristics of both countries for the sample period. The most typical one occurred during financial crises around 2008, which is often called the Lehman shock. In both countries, consumers had considerably reduced consumption around that period. The IT boom collapse at the beginning of the 2000s also diminished consumption in the United States. This paper examines impulse responses to trace the effect of a productivity shock to one of the innovations on the current and future value of consumption. Findings indicate that the effect of the shock of productivity on consump- tion is long both countries.
Keywords: Consumption; IT Boom; Japan; Production; Productivity; United States
1. Introduction
Many developed countries have experienced booms and suffered recessions in the 1990s and 2000s repeatedly and cyclically. This article focuses on the United States and Japan among other industrialized economies. The United States experienced recession; however, the econ- omy has been stable except for the period of the Lehman shock, which damaged not only the United States but also the world economy around 2008. On the contrary, Japan has suffered unprecedented recession and deflation for more than 10 years. The Japanese economy, at last, had begun an optimistic atmosphere of recovery from long recession and deflation around the middle of the 2000s; however, the situation has not changed greatly. The 2011 earthquake seriously damaged the Japanese economy. These two countries have experienced opposite economic situations from the beginning of the 1990s until now. Analysis of these factors for some European countries would be interesting and important; however, the period since the introduction of the Euro is not ade- quate to allow performance of empirical analyses. This article focuses on the relationship between consumption and productivity in the United States and Japan. The pos- sible existence of a link between consumption and pro- ductivity raises a question about the relationship, and no consensus has yet been formed. Few studies have fo- cused on this relationship.
This reports on an empirical examination of the rela- tionship between consumption and productivity for the United States and Japan based on the theoretical models of [1,2]. The main assumption in the present study is that current movements in consumption are primarily influ- enced by changes in consumers’ expectations of the eco- nomy’s long-run potential. More concretely, consumers continuously obtain information about the future. Based on this information, consumers decide on consumption and affect output in the short run. If ex post the informa-tion turns out to be noise, the economy returns to its ini-tial condition. This assumption does not seem to fit per-fectly, however, in the real economy. The following sec-tion explains this in detail.
[3-5] suggested that permanent shocks appear to lead to an increase in production activity in the short run and may have a larger effect in the long run. [2] used the data for the United States and found that consumers learned about a subsequent decline in productivity, which led to the 2008 financial crisis. However, little recent study has analyzed consumption empirically, especially the case of Japan.
ercises that have attempted to find deviations from the efficient market hypothesis in stock markets. [4,6-9] showed that demand shocks account for a small portion of volatility and permanent technology shocks provide a bigger one. [10] indicated that housing effects are bigger in the United States than in Europe and Japan. [11] ex- amined the impact of fluctuations on consumption in the United States and Japan and found the effect of the wealth ratio on predictions of stock returns in Japan. Some articles have examined the relationship between consumption and financial variables (e.g., stock prices); however, the relationship between consumption and pro- ductivity has not been examined fully.
This article is structured as follows. Section 2 presents a model for the empirical analysis. Section 3 shows the results and analyzes them. Finally this paper ends with a brief summary.
2. Model for Empirical Analysis
2.1. Theoretical Analysis
This empirically examines the relationship between con- sumption and productivity. The model employed here is based on the theoretical model in [1].
First, consumers with rational expectations anticipate what the future will bring in terms of productivity, which is, for simplicity’s sake, determined exogenously by a permanent and a temporary component. Consumers’ de- cisions are made based on their expectations of future productivity. Consumers are rational in that they employ the information available as well as they are able, and they change consumption volume according to the per- manent income hypothesis. Their expectations affect con- sumption and output in the short run.
The permanent component of consumption pet follows
a trend that changes randomly as a result of permanent productivity shocks.
1
t t
pe pe t
(1)
t means time and εtdenotes normal shock with variables
2
. The temporary component tet changes as a result of
shocks that die out over time:
1
t t
te te t (2) ηt denotes normal shock with variables 2.
Actual productivity (in logs) is determined by the sum of these two components:
t t
ac pe zt
t
(3)
act is assumed to be a random walk and is defined as
follows:
1
t t
ac ac u (4)
ut is normal shocks with the variances at equal to u2.
[12] showed a similar process for technology. The co- efficient α is in (0, 1). Consumers observe productivity but not the two components separately. According to the permanent income hypothesis, consumers maximize the expected utility function given the information for each period.
Consumers are assumed to follow Euller’s equation, which leads to the smoothing process (5):
t t j
c E c It (5) where It is the consumer’s obtained information I at date
t. To simplify the model and analyze consumption di- rectly, consumption is set as the only component of de- mand and output is determined only by the demand side. Output yt is given yt = ct and the labor cost adjusts to
produce yt, and given the current level of moves, leads to
its natural level in the long run, as show in Equation (6): limjE ct t j act j 0 (6)
Consumption smoothing movements leads to the equa- tion (in logs).
lim
t j t t j
c E ac It (7)
Equation (7) shows that consumption is determined by expectations about the level of productivity in the long run. Moreover, it is necessary to specify the consumers’ information set. Consumers observe current and past pro- ductivity, act.
From Equations (1)-(3) and (7), the result is as fol- lows:
1
1 1
t t tt t t
c pe pe pe (8) In Equation (8), pet t and pet 1t1 denote consum-
ers’ expectations.
Consumers enter the market at each period with con- sumption xt t and xt1t1 for the current and lagged
values of the permanent component of productivity.
2.2. Empirical Analysis
This model is estimated using data for consumption and productivity. The logarithm of the ratio of consumption to GDP and the logarithm of the ratio of GDP to em- ployment are used for consumption and productivity. The variables, the permanent component of productivity, pe is calculated by Hodrick-Prescott method. This method is a tool used in economics in business cycle theory to sepa- rate the cyclical component of a time series from the original data. The method can obtain a smoothed one in the data that is more sensitive to long-run than to short- run fluctuations.
three typical methods: augmented Dickey-Fuller (ADF), Phillips-Perron (PP), and Kwiatkowski-Phillips-Schmidt- Shin (KPSS) tests.
The ADF test is often used for empirical estimation; however, if the series is correlated at higher order lags, the assumption of white noise disturbances is violated. The PP test proposes a method by which to control for higher order serial correlation in a series than is accepted in the equation. The test makes a nonparametric correc- tion to the t-test statistic. The test is robust with respect to unspecified autocorrelation and heteroskedasticity in the disturbance process of the test equation. Finally, KPSS time series test is stationary around a deterministic trend. This test differs from those in common use in that they have a null hypothesis of stationarity. The test may be conducted under the null of either trend or nontrend stationarity. Inference from this test is complementary to that derived from those based on the ADF. This test is often employed with ADF to examine the possibility that a series is fractionally integrated [13].
This article examines the effect of changes in produc- tion on consumption. The method employed is LS (least squares) and VAR (vector autoregression). VAR is com- monly used to forecast systems of interrelated time series and to analyze the dynamic impact of random distur-bances on the employed variables. Empirical estimation and interface are complicated by the fact that endogenous variables may appear on both the left and right sides of equations. The use of VAR can avoid this issue. The variables employed are consumption and production [13]. Also, impulse responses are examined to trace the effect of a one-time shock to one of the innovations on current and future values of the endogenous variables.
The sample period is from 1993:1 to 2011:4. The year 1993 was selected for data availability (for Japanese em- ployment). The data are quarterly. All the data are from International Financial Statistics (IMF). Around the mid- dle of 2008, the differences in the economic situations of both countries appear evident. Since the middle of the 1990s, the Japanese economy has been in recession and deflation; on the other hand, the US economy has ex- panded stably except for a few years. Moreover, it has been said that consumption is too large for economic
conditions in the United States. Whether or not this is true or should be examined. Also, the effect of produc- tions shock on consumption is examined. The template is used to format your paper and style the text. All margins, column widths, line spaces, and text fonts are prescribed; please do not alter them. You may note peculiarities. For example, the head margin in this template measures pro- portionately more than is customary. This measurement and others are deliberate, using specifications that an- ticipate your paper as one part of the entire proceedings, and not as an independent document. Please do not revise any of the current designations.
3. Empirical Results
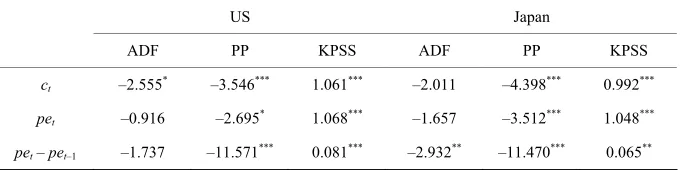
The results of the unit root tests are shown in Table 1.
In some cases, the results are not conclusive. However, the use of each datum is not problematic especially in the case of the PP test for empirical estimations.
The results of the regressions for Equation (9) are shown in Table 2.
The results fit well for both the cases of the United States and Japan. Also, it is interesting to note that the coefficients of both countries are similar. Both countries have common characteristics in consumption patterns de- spite that both countries have experienced opposite eco-nomic conditions since the middle of the 1990s. In the past, US overconsumption has been pointed out; on the contrary, lower Japanese consumption has been pointed out. However, in reality, the two countries have similar characteristics in consumptions.
Figure 1 (US) and Figure 2 (Japan) show the con-
[image:3.595.129.469.630.715.2]sumptions in reality with the HP filter and as estimated. It should be noted that US overconsumption and lower levels of Japanese consumption were found in general. During the sample period, the US economy expanded at a steady rate; however, the Japanese economy has suf- fered recession and deflation. In Japan, reduced wages and uneasiness about the future have both seemed to lead to declines in consumption. From 1992 to 2011, the Japanese average wage fell about 11%. No downward wage rigidity has been found in the past. Also, people are concerned about the future because of the huge deficit in
Table 1. Unit root tests.
US Japan
ADF PP KPSS ADF PP KPSS
ct –2.555* –3.546*** 1.061*** –2.011 –4.398*** 0.992***
pet –0.916 –2.695* 1.068*** –1.657 –3.512*** 1.048***
pet – pet–1 –1.737 –11.571*** 0.081*** –2.932** –11.470*** 0.065**
Figure 1. US consumption.
[image:4.595.59.287.557.643.2]Figure 2. Japanese consumption.
Table 2. Regression results for consumption.
US Japan
pet 1.009*** (898.747) 1.000*** (504.605)
pet – pet–1 –1.438*** (–5.933) –1.521*** (–6.157)
D.W. 2.252 2.302
Adj.R2 0.825 0.705
Note: ***, **, and * denote statistical significance at the levels of 1%, 5% and 10% respectively. Parentheses in the table indicate t values.
Japan. The ration of the Japanese deficit/debt to GDP is the highest among industrialized economies. Regardless of a long period quite low interest rates in Japan to over- come recession, people in Japan have not consumed much because of the reform plan for increased consump-
tion taxes and pension reduction, which has been dis- cussed for several years. For the United States, the debt ratio also is high; however, the situation is not as serious as in Japan.
The United States experienced a large increase in permanent productivity in the second half of the 1990s. The productivity boom that started in 1995 can be related to a number of major innovations in information and communication technology. This situation did not occur in Japan. A slowdown in 2000 (with the collapse of IT boom) and a further decline in 2005 were expected with the start of the fall in housing prices. Consumption growth slowed started in 2007 and exhibited a large de- cline at the end of 2008. The September 2008 financial crisis triggered a decline in expectations about the future.
2007 to 2009, similar to the case of the United States. The damage seemed small compared the effect with the United States. In 2010, consumption rose greatly. How- ever, a sharp decline occurred as a result of the 2011 earthquake.
Finally, the VAR results are shown in Table 3.
The impulse responses are shown in Figures 3 (US)
and 4 (Japan).
[image:5.595.103.496.208.374.2]As in [14], temporary shocks to consumption around the permanent component of production seem large in both countries. The effects of other shocks (response of consumption to consumption, consumption to production, and production to production) are quite large and con- tinuous. According to these production shocks, consum- ers in both countries are likely to make mistakes, think- ing of these movements as permanent until they have
Table 3. VAR results for consumptions.
US Japan
Consumption Production Consumption Production
c 0.016 (0.442) 0.010 (0.576) 0.032 (0.732) 0.031 (1.596)
Consumption (−1) −0.156 (−1.407) −0.080 (−1.468) −0.191* (−1.622) −0.127** (−2.433)
Consumption (−2) −0.306*** (−3.357) 0.010 (0.241) −0.188* (−1.948) −0.079* (−1.861)
Production (−1) 1.082*** (4.583) 0.678*** (5.833) 1.151*** (4.532) 0.582*** (5.183)
Production (−2) 0.370 (1.232) 0.377** (2.548) 0.171 (0.525) 0.570*** (3.965)
Adj.R2 0.832 0.952 0.682 0.912
F-static 95.565 366.443 40.231 191.383
Akaike AIC −7.252 −8.667 −6.437 −8.068
Note. ***, **, and * denote statistical significance at the levels of 1%, 5% and 10% respectively. Parentheses in the table indicate t values.
[image:5.595.101.496.402.727.2]Figure 4. Japanese impulse response.
obtained sufficient evidence to convince themselves oth- erwise. In Japan, the effect of production shocks on con- sumption is larger than in the United States. In Japan, severe economic conditions have continued for so long that people have tended to react too much or too nerv- ously to production shocks, including innovation. These effects may reveal some important implications for poli- cymakers to use to prompt recovery from such serious economic situations.
4. Conclusions
This article examined US and Japanese consumers’ be- havior in terms of too much or too little consumption. The study examined empirically how customers tried to identify shifts in permanent productivity.
Similar characteristics exist in both countries, espe- cially in the case of financial crisis all over the world around 2008. Also, US consumption reduced around the beginning of the 2000s because of the collapse of the IT boom. Americans have reduced consumption to less than the level as expected. Such situations sometimes have occurred in Japan; however, they have been little bit small. Also, the trend of over-consumption in the United States and under-consumption in Japan was noted in
general. US consumption is too much and Japanese con- sumption is too little for most cases from the 1990s until the present.
Japan has suffered unprecedented recession and defla- tion for more than 20 years, which may have affected consumption. Finally, the shock of productivity has in- fluenced consumption for a longer time in Japan than in the United States. The effect of production shocks on consumption is much larger in Japan than in the United States. Serious economic conditions in Japan have con- tinued for more than 20 years, so people may tend to overreact to production shocks.
5. Acknowledgements
We appreciate a referee’s comments and suggestions.
REFERENCES
[1] O. J. Blanchard, J.-P. L’Hullier and G. Lorenzoni, “News, Noise, and Fluctuations: An Empirical Exploration,” NBER Working Paper, No. 15015, 2009.
[2] J. L’Huillier, “Did the US Consumer Overreact? A Test of Rational Expectations,” Economics Letters, Vol. 116, No. 2, 2012, pp. 207-209.
doi:10.1016/j.econlet.2012.02.019
[3] O. Blanchard and D. Quah, “The Dynamic Effects of Ag- gregate Demand and Aggregate Supply Disturbances,”
American Economic Review, Vol. 79, No. 4, 1989, pp.
654-673.
[4] J. Galí, “How Well Does the IS-LM Model Fit Postwar US Data?” Quarterly Journal of Economics, Vol. 107, No. 2, 1992, pp. 709-738. doi:10.2307/2118487
[5] J. Galí, “Monetary Policy, Inflation and the Business Cycle: An Introduction to the New Keynesian Frame-work,” Princeton University Press, Princeton, 2008. [6] W. F. M. DeBondt and R. H. Thaler, “Does the Stock
Market Overreact?” Journal of Finance, Vol. 40, No. 3, 1985, pp. 793-808.
doi:10.1111/j.1540-6261.1985.tb05004.x
[7] P. Veronesi and L. Pastor, “Technology Revolution and
Stock Prices,” American Economic Review, Vol. 99, No. 4, 2009, pp. 1451-1463. doi:10.1257/aer.99.4.1451 [8] M. D. Shapiro and M. W. Watson, “Sources of Business
Cycle Fluctuations,” NBER Macroeconomics Annual, Vol. 3, 1988, pp. 111-156.
[9] J. Greenwood and B. Jovanovic, “The Information-Te- chnology Revolution and the Stock Market,” American
Economic Review Papers and Proceedings, Vol. 89, No.
2, 1999, pp. 116-122. doi:10.1257/aer.89.2.116
[10] C. Kerdrain, “How Important Is Wealth for Explaining Household Consumption over the Recent Crises,” OECD Economic Department Working Papers, No. 869, 2009. [11] C. Tsuji, “Consumption, Aggregate Wealth, and Expected
Stock Returns in Japan,” International Journal of
Eco-nomics and Finance, Vol. 1, No. 2, 2009, pp. 123-127.
[12] E. Boz, C. Daude and C. B. Durdu, “Emerging Market Business Cycles Revisited: Learning about the Trend,” FRB International Finance Discussion Paper, No. 927, 2008.
[13] Y. Kurihara, “Exchange Rate Determination and Struc-tural Changes in Response to Monetary Policies,” Studies
in Economics and Finance, Vol. 29, No. 3, 2012, pp. 187-
196. doi:10.1108/10867371211246858
[14] P. Beaudry and F. Portier, “Stock Prices, News, and Eco- nomic Fluctuations,” American Economic Review, Vol. 96, No. 4, 2006, pp. 1293-1307.