ORIGINAL RESEARCH
ADULT BRAIN
Identification of Chronic Active Multiple Sclerosis Lesions on
3T MRI
XM. Absinta,XP. Sati,XA. Fechner,XM.K. Schindler,XG. Nair, andXD.S. Reich
ABSTRACT
BACKGROUND AND PURPOSE: MR imaging–pathologic studies have reported that paramagnetic rims on 7T susceptibility-based MR imaging identify, in vivo, the subset of MS lesions with compartmentalized inflammation at the lesion edge and associated remyelination failure. Here, we assessed the reliability of detecting these rims on high-resolution 3T phase images.
MATERIALS AND METHODS: High-resolution T2* and phase MR imaging was collected in 20 patients with MS at 3T (3D segmented EPI, 0.65 mm3) and 7T (2D gradient-echo, 0.2⫻0.2⫻1 mm) MR imaging. In each case, 5 discrete chronic (nonenhancing) MS lesions were selected on T2 FLAIR images for rim evaluation. Five raters experienced in MS imaging contributed to the rim assessment, of whom 3 worked independently on 3T data, and 2, on 7T data. Consensus agreement was reached for both 3T and 7T rim evaluations. Discrepancies between 3T and 7T were discussed, and consensus was reached.
RESULTS: Phase rims were seen in 34 lesions at 7T and in 36 lesions at 3T by consensus. Inter- and intrarater reliability were “substantial/ good” both at 3T and 7T analysis (Cohen,⬎0.71). Based on consensus agreement, the reliability of rim visualization at 3T versus 7T was 0.78 () with a pair-wise agreement of 90%. More lesions were judged to be false-positive or false-negative at 3T than at 7T.
CONCLUSIONS: Nearly all 7T paramagnetic rims can also be seen at 3T. Imaging at 3T opens the possibility of implementing paramagnetic rims as an outcome measure in multicenter, MR imaging– based clinical trials aimed at treating perilesional persistent inflammation and its potential effects on remyelination.
ABBREVIATIONS:EDSS⫽Expanded Disability Status Scale; QSM⫽Quantitative Susceptibility Mapping
I
n multiple sclerosis, plaques of demyelination, the hallmark of this disease, can present simultaneously at different pathologic stages.1,2Especially relevant from a disease perspective are 2types of chronic plaques that can be considered opposite ends of the pathologic spectrum: lesions in which, after active in-flammatory demyelination, the repair process has been rela-tively efficient (leading to remyelination), and lesions in which
regeneration has completely failed, due, in part, to residual compartmentalized inflammation at the lesion margin (ie, chronic active/slowly expanding/smoldering lesions, hence-forth denoted “chronic active”).1,2
Chronic active lesions are pathologically characterized by a hypocellular demyelinated core and a hypercellular edge of acti-vated microglia/macrophages related to smoldering inflamma-tion and axonal degenerainflamma-tion.1,2On MR imaging, these lesions
have a characteristic paramagnetic rim on 7T susceptibility-based MR imaging sequences; the paramagnetic shift is due to the stable presence of iron-laden activated microglia/macrophages3-11and,
potentially, reactive astrocytes12at the lesion edge. Usually,
para-magnetic rims are seen on 7T phase images, but a proportion can also be detected on 7T T2* magnitude images, mostly when iron content is higher.4-6,13,14In the context of early lesion evolution,
we recently reported that paramagnetic rims in active lesions co-localize with peripheral or centripetal gadolinium enhancement14
and that persistence of these rims after restoration of the blood-brain barrier (ie, approximately 3 months after initial demyelina-tion) predicts failure of tissue repair and remyelination.10
There-Received December 8, 2017; accepted after revision March 13, 2018.
From the Translational Neuroradiology Section (M.A., P.S., A.F., M.K.S., G.N., D.S.R.), Division of Neuroimmunology and Neurovirology, National Institute of Neurologi-cal Disorders and Stroke, National Institutes of Health, Bethesda, Maryland; and Department of Radiology (A.F.), Fondation Ophtalmologique Adolphe de Roth-schild, Paris, France.
This work was supported by the Intramural Research Program of National Institute of Neurological Disorders and Stroke.
Please address correspondence to Daniel S. Reich, MD, PhD, Translational Neurora-diology Section/National Institute of Neurological Disorders and Stroke/National Institutes of Health, 10 Center Dr, MSC 1400, Building 10, Room 5C103, Bethesda, MD 20892; e-mail: [email protected]
Indicates open access to non-subscribers at www.ajnr.org Indicates article with supplemental on-line photo.
after, in chronic lesions, rims have been shown to be stable during short-to-medium-term follow-up (up to 3.5 years)13-15and are
not known to be affected by current disease-modifying treat-ments. These results establish paramagnetic rims as potential out-come measures in MR imaging– based clinical trials of therapies that might treat perilesional persistent microglial-/macrophage-driven inflammation.
Because 7T MR imaging scanners remain relatively sparse and confined to major academic centers in developed countries, the abil-ity to reliably identify paramagnetic rims on more widespread, lower field strength (3T) scanners seems to be a necessary step toward ap-plication in multicenter clinical trials and—as important— clinical practice. A proper investigation of the detection of paramagnetic rims on 3T susceptibility-based MR images is necessary to achieve this. Here, we aimed to assess the reliability of visualizing 7T para-magnetic rims (our criterion standard in vivo) on high-resolution 3T susceptibility-based MR images in 20 patients with MS. At 3T, we implemented a 0.65-mm isotropic voxel, whole-brain 3D segmented echo-planar imaging sequence that is already known in the MS im-aging field for its benefits in assessing the central vein sign within MS lesions.16-21
MATERIALS AND METHODS
Participants
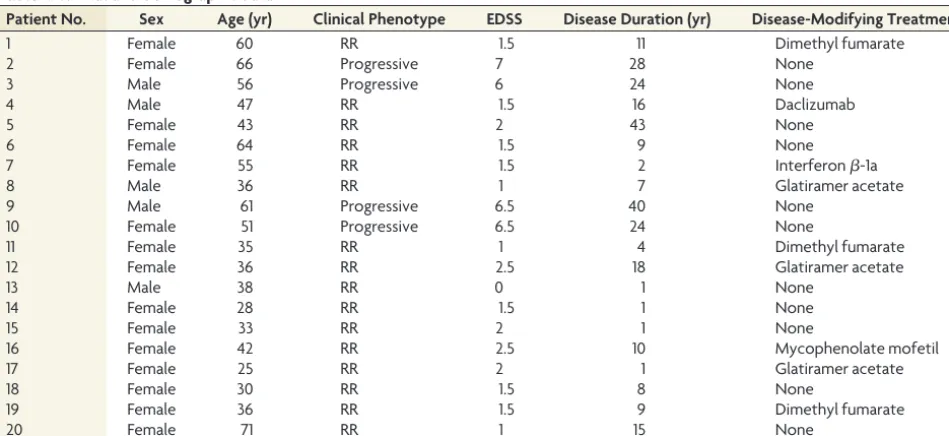
Under an institutional review board–approved natural history pro-tocol, we recruited, from May 2012 to December 2016, twenty indi-viduals with MS (15 women/5 men; mean age, 46 years; range, 28 –71 years; all fulfilling the 2017 McDonald revised MS criteria22). Sixteen
had relapsing-remitting and 4 had progressive MS.23Experienced
MS clinicians determined disability according to the Expanded Dis-ability Status Scale (EDSS)24and obtained clinical data. The median
EDSS score was 1.5 (range, 0 –7), and mean disease duration was 14 years (range, 1– 40 years); clinical data were collected at the first MR imaging acquisition (Table 1).
MR Imaging Acquisition
Participants underwent 2 MR imaging acquisitions approximately a year apart, one on a Magnetom Skyra (Siemens, Erlangen, Germany) 3T scanner (equipped with a body transmit coil and a 32-channel receive coil) and one on a Siemens Research System 7T MR imaging scanner (equipped with a birdcage-type transmit coil and a 32-chan-nel receive coil). The mean time lapse between the first and second MR imaging was 0.9 years (median, 0.7 years; range, 2 days to 3.4 years). Because paramagnetic rims in chronic lesions have been shown to be stable with time,13-15including in our cohort, we did not
implement a maximum time lapse between 3T and 7T scans. The following details the 3T MR imaging protocol for rim detection:
● Whole-brain 3D segmented echo-planar imaging providing T2* magnitude and phase contrasts (TR⫽64 ms; TE⫽35 ms; flip angle⫽10°; acquisition time⫽5 minutes 46 seconds; 256 sagittal slices; 0.65-mm isotropic voxels with a voxel size of 0.27L).
● Whole-brain 3D T2 FLAIR (TR⫽4800 ms; TE⫽354 ms; TI⫽ 1800 ms; flip angle⫽120°; acquisition time⫽6 minutes 30 sec-onds; 176 sagittal slices; 1-mm isotropic voxels with voxel size⫽1 L).
The following details the 7T MR imaging protocol for rim detection:
● 2D high-resolution gradient recalled-echo providing T2* and phase contrasts (TR⫽1300 ms; TE⫽32 ms; 29 axial slices; flip angle⫽50°; acquisition time⫽8 minutes 36 seconds; in-plane resolution⫽0.2⫻ 0.2 mm; slice thickness⫽1 mm; voxel size⫽0.04L). Three minimally overlapping slabs were ac-quired to allow coverage of most of the supratentorial brain.
[image:2.594.55.530.54.272.2]Additional MR imaging sequences, including postcontrast T1-weighted images, were typically acquired for clinical or other re-search purposes at both 3T and 7T MR imaging and were exam-ined qualitatively as part of this study.
Table 1: Clinical and demographic data
Patient No. Sex Age (yr) Clinical Phenotype EDSS Disease Duration (yr) Disease-Modifying Treatment
1 Female 60 RR 1.5 11 Dimethyl fumarate
2 Female 66 Progressive 7 28 None
3 Male 56 Progressive 6 24 None
4 Male 47 RR 1.5 16 Daclizumab
5 Female 43 RR 2 43 None
6 Female 64 RR 1.5 9 None
7 Female 55 RR 1.5 2 Interferon-1a
8 Male 36 RR 1 7 Glatiramer acetate
9 Male 61 Progressive 6.5 40 None
10 Female 51 Progressive 6.5 24 None
11 Female 35 RR 1 4 Dimethyl fumarate
12 Female 36 RR 2.5 18 Glatiramer acetate
13 Male 38 RR 0 1 None
14 Female 28 RR 1.5 1 None
15 Female 33 RR 2 1 None
16 Female 42 RR 2.5 10 Mycophenolate mofetil
17 Female 25 RR 2 1 Glatiramer acetate
18 Female 30 RR 1.5 8 None
19 Female 36 RR 1.5 9 Dimethyl fumarate
20 Female 71 RR 1 15 None
MR Imaging Analysis
Phase postprocessing and coregistration among images were per-formed as previously described.10,14Postcontrast T1-weighted
im-ages were implemented to exclude enhancing lesions from the analysis.
As previously described,6a chronic lesion was defined as
“rim-positive” when it showed a paramagnetic rim signal on phase images while being either hyper- or isointense in its inner portion. The paramagnetic rim assessment included 5 investigators with experience in imaging MS, including 2 neurologists (M.A., M.K.S.), 2 neuroradiologists (A.F., D.S.R.), and an MR physicist (P.S.). On 3T T2 FLAIR images, an investigator (M.A.) selected 5 discrete supratentorial chronic MS lesions (largest diameter of⬎3 mm) from each case. The lesion location and largest lesion diam-eter were recorded. To remain masked to data acquired at 3T and 7T, we planned rim assessment as follows:
3T Paramagnetic Rim Assessment
● For each selected lesion, 3 investigators (A.F., M.K.S., D.S.R.) independently assessed the presence of paramag-netic rims on 3T phase MR images. T2 FLAIR and phase images were reviewed simultaneously by each investigator using OsiriX software (http://www.osirix-viewer.com). Le-sions to be analyzed were marked on MR images with a number and an arrow. A binary code was implemented as 0⫽no rim and 1⫽rim.
● After 4 months, 1 rater repeated the analysis on 3T phase data.
● Consensus agreement was subsequently reached by all in-vestigators, and comments were recorded.
7T Paramagnetic Rim Assessment
● Similar to the previous analysis, for each selected lesion, an investigator (M.A.) assessed the presence of paramagnetic rims on 7T phase MR imaging.
● After 5 months, a second investigator (P.S.) performed the analysis, and the first rater repeated the analysis.
● Consensus agreement was subsequently reached, and com-ments were recorded.
After consensus, discrepancies between rim visualization at 3T versus 7T were retrospectively investigated and discussed. The presence of rims on 3T T2* magnitude images (known to be less sensitive to susceptibility shifts) was assessed retrospectively by consensus of 2 investigators (M.A., P.S.).
Statistical Analysis
Intra- and interrater reliability for rim as-sessment was computed on the basis of the number of raters, using the Cohen(2 raters) and Fleiss(3 raters). MR imaging differences (lesion diameter and location) between lesions with-versus-without rims were assessed with attest and Fisher exact test when appropriate.
RESULTS
One hundred discrete supratentorial chronic MS lesions were initially evaluated (5 lesions per patient). Two lesions were excluded from the final analysis, one for abutting a confluent lesion and one for obvious changes in size at the second time point (time lapse, 1.7 and 1.4 years, respectively). Of the remaining 98 lesions, 35 (36%) were periventricular; 39 (40%), in the deep white matter; and 24 (24%), juxtacortical/leukocortical.
Lesion Rim Assessment at 3T MR Imaging (Masked to the 7T Data)
Of 98 analyzed lesions, 36 had a paramagnetic rim on 3T phase im-ages by consensus agreement. Rim lesions were larger than nonrim lesions (mean diameter, 8.1⫾2.3 mm and 6.7⫾2.3 mm, respec-tively;ttest,P⫽.007). Overall, we did not notice any preferential lesion location: 13 lesions with rim were periventricular (38% of total periventricular lesions), 14 were in the deep white matter (38% of total deep white matter lesions), and 9 were juxtacortical/leukocor-tical (38% of total juxtacorjuxtacortical/leukocor-tical/leukocorjuxtacortical/leukocor-tical lesions).
[image:3.594.53.378.64.179.2]The intrarater and interrater agreement results are provided in
Table 2. The reliability between each rater and the final consensus agreement was “substantial/good,” with a Cohenranging from 0.71 to 0.79 and a pair-wise agreement ranging from 86% to 90%. Sixteen of 36 lesions with a phase rim (44%) also showed a rim on T2* magnitude images. The presence of a T2* rim was signif-icantly associated with the detection of a rim on phase images by consensus (Fisher exact test,P⬍.0001).
Lesion Rim Assessment at 7T MR Imaging (Masked to the 3T Data)
Of 98 analyzed lesions, 34 had a paramagnetic rim on 7T phase images by consensus agreement. Twenty-one of 34 lesions with a phase rim (62%) also showed a rim on T2* magnitude images (Fig 1). The intrarater and interrater agreement results are provided in
Table 2. The reliability between each rater and the final consensus agreement was “almost perfect,” with a Cohenranging from 0.81 to 0.91 and a pair-wise agreement ranging from 91% to 96%.
Lesion Rim Assessment at 3T versus 7T and Analysis of Disagreements
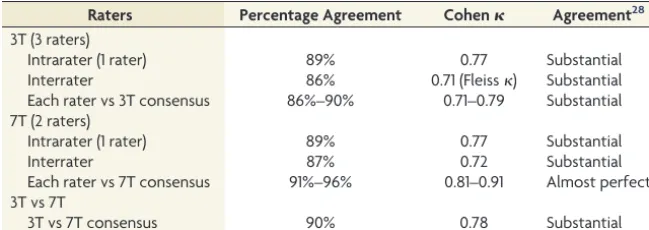
Rims were seen in 34 lesions on 7T phase images and in 36 lesions on 3T phase images by consensus. The reliability between the consensus agreement at 3T versus 7T was substantial/good, with a Cohenof 0.78 and a pair-wise agreement of 90%. After discus-sion, discrepancies between 3T and 7T were seen in 10 lesions: Table 2: Intra- and interrater agreement for paramagnetic rim evaluation on 3T and 7T
phase MRI
Raters Percentage Agreement Cohen Agreement28
3T (3 raters)
Intrarater (1 rater) 89% 0.77 Substantial
Interrater 86% 0.71 (Fleiss) Substantial
Each rater vs 3T consensus 86%–90% 0.71–0.79 Substantial 7T (2 raters)
Intrarater (1 rater) 89% 0.77 Substantial
Interrater 87% 0.72 Substantial
Each rater vs 7T consensus 91%–96% 0.81–0.91 Almost perfect 3T vs 7T
● Four lesions were considered to have been missed at 3T (“false-negative”). One possible explanation is a small susceptibility effect at the edge of these lesions because none had a T2* rim. ● Three lesions identified as having rims at 3T did not have rims
at 7T and were therefore considered “false-positive” at 3T. On review, this misinterpretation was thought to be related to a “rim-like” configuration of vessels at the lesion edge.
● Two lesions were considered to have been missed at 7T. On review, this was thought to be due to the relatively thick slices in the 7T acquisition (1 mm versus 0.65 mm at 3T).
● One lesion, even after re-evaluation, was considered to have a rim at 3T but not at 7T. For this lesion, the 3T scan preceded the 7T scan by 1 month, and none of the other lesions in this case were discordant.
Representative concordant and discordant cases are shown inFigs 1–3.
DISCUSSION
In this study, we tested the reliability of 3T susceptibility-based imaging in visualizing 7T-detected paramagnetic rims in nonen-hancing MS lesions. Anticipated difficulties revolved mainly around the lower sensitivity of 3T MR imaging to susceptibility effects, as well as the lower voxel volume of the 3T acquisition. At 7T MR imaging, the mean rim thickness in nonenhancing MS lesions has been estimated at⬃430m (range, 150 –1200m),14
indicating the necessity of acquiring submillimeter susceptibility-based imaging. Here, we implemented a 3T whole-brain 3D seg-mented EPI sequence, providing 0.65-mm isotropic voxels and both T2* magnitude and phase contrasts. This is the optimized sequence for FLAIR* imaging16and the related assessment of the
central vein sign in MS lesions.17-21The potential of detecting
central vein and paramagnetic rims with the same sequence would also be a clear advantage in terms of acquisition time in a clinical setting. In addition, like the central vein, small 7T MR imaging studies showed that lesions with rims are not frequently seen in other inflammatory disorders of the central nervous sys-tem such as neuromyelitis optica spectrum disorder25,26 and
Susac syndrome.27
Overall, detection of paramagnetic rims performed well at 3T; representative examples are shown inFigs 1and2. Intra- and interrater agreement was substantial/good or better28for both 3T
and 7T. Most important, agreement was not perfect at 7T; this outcome suggests that a clear MR imaging definition of what con-stitutes a rim is necessary for future research studies (population analysis) and/or MR imaging– based clinical trials. In addition, our results suggest that dedicated training in MS MR imaging should be a prerequisite for assessing this important morphologic feature at both 3T and 7T.
The discussion that took place within our group during the consensus process highlighted several important observations about imaging of paramagnetic rim lesions at 3T. On the one hand, rim detection on 3T phase images was more reliable when the rim was seen: 1) on T2* magnitude and phase images, indi-cating stronger susceptibility effects; 2) on⬎1 consecutive slice; and 3) on multiple orthogonal views. On the other hand, rim detection was less reliable: 1) in areas with a high density of veins, such as around the ventricular horns; 2) within the corpus callo-sum; 3) when the rim was seen only partially around the lesion; 4) when the rim did not match the edge of the lesion seen on T2-FLAIR images; and 5) in areas with motion and/or bulk suscepti-bility artifacts.
One important limitation of phase imaging at both 3T and 7T is the presence of dipolar fields surrounding cerebral vessels and some MS lesions. These dipolar projections may hinder the detection of phase rims (especially thin ones) or may be misinterpreted as (false-positive) phase rims.29,30One way to
remove these dipolar fields is to apply an extra processing step called Quantitative Susceptibility Mapping (QSM), which computes the magnetic susceptibility of tissues by solving the field-to-source inversion problem using the dipole model.31
However, the appearance of QSM images depends heavily on the choice of the algorithm and parameters used for solving the inversion problem.32 Moreover, QSM images are typically
smoothed. This step can result in a loss of conspicuity for fine structures such as the thin paramagnetic rims frequently ob-served in our study (On-line Figure). Therefore, further devel-opment is warranted for establishing a robust and effective QSM algorithm that can display all types of paramagnetic rims around MS lesions.
Potential limitations of our study are the limited number of lesions included in the analysis and the sometimes long time lapse between 3T and 7T MR imaging acquisitions, which ranged from 2 days to 3.4 years (mean, 0.9 years, median, 0.7 years). Because paramagnetic rims in chronic lesions have been consistently shown to remain stable for similar durations of follow-up,13-15any detection difference is more likely to be
[image:4.594.53.286.47.298.2]related to different magnetic strengths (3T versus 7T) than to the biologic variability of this feature.
CONCLUSIONS
Our results show that nearly all 7T paramagnetic rims can also be seen at 3T. This finding suggests the possibility of implementing paramagnetic rims for MS diagnosis and as outcome measures in MR imaging– based clinical trials, potentially affecting perilesional persis-tent microglial/macrophage-mediated inflammation.
ACKNOWLEDGMENTS
We thank the study participants, the Neuroimmunology Clinic for recruiting and evaluating the patients and for coordinating the
scans, and the National Institutes of Health Functional Magnetic Resonance Imaging Facility. We thank Souheil Inati, John A Derbyshire, and Sunil Patil for support with MR imaging sequences and Christian Langkammer for help with QSM image processing.
Disclosures: Martina Absinta—UNRELATED:Grant: National Multiple Sclerosis Society and Conrad N. Hilton Foundation.* Daniel S. Reich—UNRELATED: Grants/Grants Pending: Vertex Pharmaceuticals*; Payment for Lectures Including Service on Speakers Bureaus: At the Limits,Comments: Continuing Medi-cal Education lecture; Travel/Accommodations/ Meeting Expenses Unrelated to Activities Listed: Verily Life Sciences, Biogen,Comments: support for travel and accommodations to present scientific lectures.* *Money paid to the institution.
REFERENCES
1. Lassmann H, Raine CS, Antel J, et al.Immunopathology of multiple sclerosis: report on an international meeting held at the Institute of Neurology of the University of Vienna.J Neuroimmunol1998;86: 213–17CrossRef Medline
2. Kuhlmann T, Ludwin S, Prat A, et al.An updated histological clas-sification system for multiple sclerosis lesions.Acta Neuropathol
2017;133:13–24CrossRef Medline
3. Hammond KE, Metcalf M, Carvajal L, et al.Quantitative in vivo magnetic resonance imaging of multiple sclerosis at 7 Tesla with sensitivity to iron.Ann Neurol2008;64:707–13CrossRef Medline 4. Pitt D, Boster A, Pei W, et al.Imaging cortical lesions in multiple
sclerosis with ultra-high-field magnetic resonance imaging.Arch Neurol2010;67:812–18CrossRef Medline
5. Bagnato F, Hametner S, Yao B, et al.Tracking iron in multiple sclerosis: a combined imaging and histopathological study at 7 Te-sla.Brain2011;134:3602–15CrossRef Medline
6. Yao B, Bagnato F, Matsuura E, et al.Chronic multiple sclerosis lesions: characterization with high-field-strength MR imaging. Ra-diology2012;262:206 –15CrossRef Medline
7. Hagemeier J, Heininen-Brown M, Poloni GU, et al.Iron deposition in multiple sclerosis lesions measured by susceptibility-weighted imaging filtered phase: a case control study.J Magn Reson Imaging
2012;36:73– 83CrossRef Medline
8. Walsh AJ, Lebel RM, Eissa A, et al.Multiple sclerosis: validation of MR imaging for quantification and detection of iron.Radiology
2013;267:531– 42CrossRef Medline
9. Wisnieff C, Ramanan S, Olesik J, et al.Quantitative susceptibility mapping (QSM) of white matter multiple sclerosis lesions: inter-preting positive susceptibility and the presence of iron.Magn Reson Med2015;74:564 –70CrossRef Medline
10. Absinta M, Sati P, Schindler M, et al.Persistent 7-Tesla phase rim predicts poor outcome in new multiple sclerosis patient lesions.
J Clin Invest2016;126:2597– 609CrossRef Medline
11. Dal-Bianco A, Grabner G, Kronnerwetter C, et al.Slow expansion of multiple sclerosis iron rim lesions: pathology and 7 T magnetic resonance imaging. Acta Neuropathol 2017;133:25– 42 CrossRef Medline
12. Popescu BF, Frischer JM, Webb SM, et al.Pathogenic implications of distinct patterns of iron and zinc in chronic MS lesions.Acta Neu-ropathol2017;134:45– 64CrossRef Medline
13. Bian W, Harter K, Hammond-Rosenbluth KE, et al.A serial in vivo 7T magnetic resonance phase imaging study of white matter lesions in multiple sclerosis.Mult Scler2013;19:69 –75CrossRef Medline 14. Absinta M, Sati P, Gaita´n MI, et al.Seven-Tesla phase imaging of
acute multiple sclerosis lesions: a new window into the inflamma-tory process.Ann Neurol2013;74:669 –78CrossRef Medline
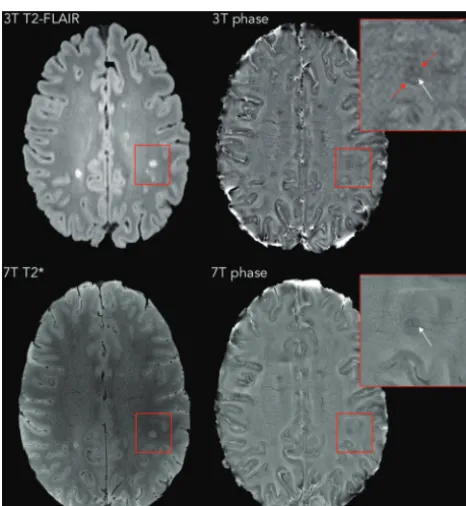
FIG 2.Representative examples of MS lesions in which a paramagnetic rim (red arrows) can be easily seen on both 7T and 3T phase images. Note the superior image quality at 7T in at least 3 of the 4 examples.
[image:5.594.55.377.48.201.2] [image:5.594.53.286.245.498.2]15. Dal-Bianco A, Hametner S, Grabner G, et al.Veins in plaques of multiple sclerosis patients: a longitudinal magnetic resonance im-aging study at 7 Tesla.Eur Radiol2015;25:2913–20CrossRef Medline 16. Sati P, George IC, Shea CD, et al.FLAIR*: a combined MR contrast technique for visualizing white matter lesions and parenchymal veins.Radiology2012;265:926 –32CrossRef Medline
17. Solomon A, Schindler M, Howard DB, et al.“Central vessel sign” on 3T FLAIR* MRI for the differentiation of multiple sclerosis from migraine.Ann Clin Transl Neurol2015;3:82– 87CrossRef Medline 18. George IC, Sati P, Absinta M, et al.Clinical 3-Tesla FLAIR* MRI
improves diagnostic accuracy in multiple sclerosis.Mult Scler2016; 22:1578 – 86CrossRef Medline
19. Sati P, Oh J, Constable RT, et al.The central vein sign and its clinical evaluation for the diagnosis of multiple sclerosis: a consensus state-ment from the North American Imaging in Multiple Sclerosis Co-operative.Nat Rev Neurol2016;12:714 –22CrossRef Medline 20. Campion T, Smith RJ, Altmann DR, et al.FLAIR* to visualize veins
in white matter lesions: a new tool for the diagnosis of multiple sclerosis?Eur Radiol2017;27:4257– 63CrossRef Medline
21. Samaraweera AP, Clarke MA, Whitehead A, et al.The central vein sign in multiple sclerosis lesions is present irrespective of the T2* sequence at 3 T.J Neuroimaging2017;27:114 –21CrossRef Medline 22. Thompson AJ, Banwell BL, Barkhof F, et al.Diagnosis of multiple
sclerosis: 2017 revisions of the McDonald criteria.Lancet Neurol
2018;17:162–73CrossRef Medline
23. Lublin FD, Reingold SC, Cohen JA, et al.Defining the clinical course of multiple sclerosis: the 2013 revisions.Neurology2014;83:278 – 86 CrossRef Medline
24. Kurtzke JF.Rating neurologic impairment in multiple sclerosis: an expanded disability status scale (EDSS).Neurology1983;33:1444 –52 CrossRef Medline
25. Sinnecker T, Do¨rr J, Pfueller CF, et al.Distinct lesion morphology at 7-T MRI differentiates neuromyelitis optica from multiple sclero-sis.Neurology2012;79:708 –14CrossRef Medline
26. Sinnecker T, Schumacher S, Mueller K, et al.MRI phase changes in multiple sclerosis vs neuromyelitis optica lesions at 7T.Neurol Neu-roimmunol Neuroinflamm2016;3:e259CrossRef Medline
27. Wuerfel J, Sinnecker T, Ringelstein EB, et al.Lesion morphology at 7 Tesla MRI differentiates Susac syndrome from multiple sclerosis.
Mult Scler2012;18:1592–99CrossRef Medline
28. Landis JR, Koch GG.The measurement of observer agreement for categorical data.Biometrics1977;33:159 –74CrossRef Medline 29. Eskreis-Winkler S, Deh K, Gupta A, et al.Multiple sclerosis lesion
geometry in quantitative susceptibility mapping (QSM) and phase imaging.J Magn Reson Imaging2015;42:224 –29CrossRef Medline
30. Cronin MJ, Wharton S, Al-Radaideh A, et al.A comparison of phase imaging and quantitative susceptibility mapping in the imaging of multiple sclerosis lesions at ultrahigh field. MAGMA 2016;29: 543–57CrossRef Medline
31. Deistung A, Schweser F, Reichenbach JR.Overview of quantitative susceptibility mapping.NMR Biomed2017;30CrossRef Medline 32. Langkammer C, Schweser F, Shmueli K, et al.Quantitative
suscepti-bility mapping: report from the 2016 reconstruction challenge.