ORIGINAL RESEARCH
ADULT BRAIN
Measuring Brain Tissue Integrity during 4 Years Using Diffusion
Tensor Imaging
XD. Ontaneda,X K. Sakaie,XJ. Lin,XX.-F. Wang,XM.J. Lowe,XM.D. Phillips, andXR.J. Fox
ABSTRACT
BACKGROUND AND PURPOSE: DTI is an MR imaging measure of brain tissue integrity. Little is known regarding the long-term longitudinal evolution of lesional and nonlesional tissue DTI parameters in multiple sclerosis and the present study examines DTI evolution over 4 years.
MATERIALS AND METHODS: Twenty-one patients with multiple sclerosis were imaged for up to 48 months after starting natalizumab therapy. Gadolinium-enhancing lesions at baseline, chronic T2 lesions, and normal-appearing white matter were followed longitudinally. T2 lesions were subclassified as black holes and non-black holes. Within each ROI, the average values of DTI metrics were derived by using Analysis of Functional Neuro Images software. The longitudinal trend in DTI metrics was estimated by using a mixed-model regression analysis.
RESULTS:A significant increase was observed for axial diffusivity (P⬍.001) in gadolinium-enhancing lesions and chronic T2 lesions during 4 years. No significant change in radial diffusivity either in normal-appearing white matter or lesional tissue was observed. The evolution of axial diffusivity was different in gadolinium-enhancing lesions (P⬍.001) and chronic T2 lesions (P⫽.02) compared with normal-appearing white matter.
CONCLUSIONS: An increase in axial diffusion in both gadolinium-enhancing lesions and T2 lesions may relate to the complex evolution of chronically demyelinated brain tissue. Pathologic changes in normal-appearing white matter are likely more subtle than in lesional tissue and may explain the stability of these measures with DTI.
ABBREVIATIONS:AD⫽axial diffusivity; BH⫽black hole(s); FA⫽fractional anisotropy; GAD⫽gadolinium-enhancing lesion; MD⫽mean diffusivity; NAWM⫽ normal-appearing white matter; NBH⫽non-black hole(s); RD⫽radial diffusivity
M
S is the leading nontraumatic cause of neurologic disability in young adults in North America. MS pathology is charac-terized by focal inflammatory demyelinating lesions and diffuse changes in myelin, axon, and neuronal components.1Conven-tional MR imaging in MS has limitations because this technique provides little insight into the underlying pathology of MS lesions, is not sensitive enough to detect tissue changes outside lesions (ie, normal-appearing white matter [NAWM]), and is unable to quantify pathologic substrates of disease such as myelin or axonal
content. Additionally, conventional MR imaging is a relatively insensitive technique in progressive forms of MS in which there is little overt inflammatory activity, and MR imaging– detected le-sion burden often does not change despite frequent clear-cut clin-ical progression.2
DTI is a quantitative MR imaging– based technique that mea-sures the diffusion of water in brain tissue.3The diffusion
prop-erties are thought to reflect the microstructure of the underlying tissue.4 DTI metrics include the following: mean diffusivity
(MD), fractional anisotropy (FA), radial diffusivity (RD), and ax-ial diffusivity (AD). The different DTI metrics carry a pathologic specificity as well. AD is correlated pathologically with axonal loss in animal models of retinal ischemia.5RD is thought to be a
mea-sure of myelin content based on studies examining animal models of demyelination.6DTI may provide a window into the
patho-logic processes in MS, and through serial imaging studies, it can be used to follow MS lesions in different stages and tissue changes with time.7Additionally, DTI has demonstrated the ability to
de-tect changes in brain tissue that is apparently free of lesions (nor-mal-appearing brain tissue) under standard MR imaging.8
Longitudinal studies examining DTI characteristics have
typ-Received May 10, 2016; accepted after revision July 26.
From the Department of Neurology (D.O., R.J.F.), Neurological Institute, Mellen Center for Multiple Sclerosis Treatment and Research; Imaging Institute (K.S., J.L., M.J.L., M.D.P.); and Department of Quantitative Health Sciences (X.-F.W.), Cleve-land Clinic Foundation, CleveCleve-land, Ohio.
This work was funded by National Institutes of Health grant KL2 TR000440 to D. Ontaneda and National Multiple Sclerosis Society grants, FP1769-A-1 to D. On-taneda and RG3548 to R.J. Fox.
Please address correspondence to Daniel Ontaneda, MD, Mellen Center for Multi-ple Sclerosis Treatment and Research, Cleveland Clinic Foundation, 9500 Euclid Ave, U-10, Cleveland, OH 44195; e-mail: [email protected]; @dxo60_daniel
Indicates open access to non-subscribers at www.ajnr.org
ically only been conducted for 1–2 years with a smaller number of diffusion directions than with currently available high-angular-resolution diffusion imaging. Harrison et al8studied the
evolu-tion of white matter tracts based on tractography and found that there was a significant increase in FA and a decrease in RD during a 2-year follow-up period, with most patients in that study being on disease-modifying treatment. Lesional tissue has been studied in acute phases or for short periods of follow-up (1–2 years), and it most consistently has shown increases in MD and RD with a decrease in FA.9-12Diffusion imaging studies have also shown
that T1 black holes have higher levels of diffusivity compared with isointense T1 lesions.13There is evidence that radial diffusivity is
a strong predictor of T1 black hole conversion.11Alternatively,
longitudinal studies of high-angular-resolution diffusion imaging following lesion evolution with time have not been conducted, to our knowledge.
Natalizumab is a monoclonal antibody directed at the very late antigen-4 receptor on leukocytes.14Most patients treated with
natali-zumab enter a relatively inflammation-free state, which enables the study of the underlying neurodegenerative and reparative aspects of MS, similar to those seen in progressive MS. DTI is a feasible alterna-tive to measure underlying neurodegeneration and to assess the effi-cacy of potential neuroprotectant medications.
In this study, we aimed to study the evolution of lesional and nonlesional tissue in patients treated with natalizumab during a 4-year period. Previous DTI studies have used low angular reso-lution and have followed patients for only up to 2 years.8The
high-angular-resolution diffusion imaging acquisition15reduces
the variability and bias found in lower-angular-resolution ap-proaches, allows a more accurate study of DTI metrics with time, and shows advantages over using a small number of diffusion directions.16
MATERIALS AND METHODS
ParticipantsTwenty-two patients with relapsing MS starting natalizumab ther-apy were sequentially enrolled from neurologist referrals at an aca-demic specialty clinical center in an institutional review board–ap-proved longitudinal observational imaging study, as previously described.17Inclusion criteria were clinically definite MS by the 2005
Revised McDonald Criteria,18age older than 18 years, and the ability
to provide informed consent. Exclusion criteria were clinical relapse or steroid treatment in the previous 8 weeks, pregnancy, and contra-indications to MR imaging such as severe claustrophobia and im-planted devices such as neurostimulators and pacemakers. One pa-tient discontinued imaging follow-up after only 2 months and was removed from the data analysis.
MR Imaging Protocol
MR imaging of the brain was serially performed at time baseline (before natalizumab dosing) and at 1, 2, 6, 12, 18, 24, 36, and 48 months. Images were obtained on a 3T Magnetom Trio scanner (Siemens, Erlangen, Germany). Diffusion-weighted imaging used 71 noncollinear diffusion-weighting gradients (2.5⫻2.5⫻2.5 mm voxels,b⫽1000 s/mm2, 8b⫽0 acquisitions, 260⫻260 mm
FOV, 104⫻104 matrix, forty-eight 2.5-mm sections, TE⫽95 ms, TR⫽7300 ms). The b-value of the DTI sequence was reduced at
12 months fromb⫽2000 s/mm2tob⫽1000 s/mm2. This change
was implemented to address vibration-related artifacts observed at the higher b-value.19Anatomic imaging was performed for
lesion detection and coregistration: 3D MPRAGE (256⫻256 mm FOV, 128⫻256 matrix, one hundred twenty 1.2-mm sections, TE⫽1.71 ms, TR⫽1900 ms, T1⫽900 ms, flip angle⫽8°); proton density/T2-weighted (230⫻230 mm FOV, 320⫻320 matrix, forty-eight 3-mm sections, TE1⫽20 ms, TE2⫽91 ms,
TR⫽3600 ms); and T1 postgadolinium sequences (230⫻230 mm FOV, 320⫻320 matrix, forty-eight 3-mm sections, TE⫽ 2.46 ms, TR 300 ms, flip angle⫽75°).
Image Analysis
For each subject, ROIs were manually drawn (authors: D.O. and R.J.F.) using Analysis of Functional Neuro Images software (AFNI; http://afni.nimh.nih.gov/afni) on all areas with patho-logic gadolinium enhancement on T1 postcontrast images at the baseline scan and will be referred to as GAD tissue. Ten ROIs were sequentially drawn in selected chronic lesional tissue (T2 lesions and T1 black holes) also on the baseline scan, and these included 2 lesions in the following locations: periventricular, juxtacortical, corpus callosum, infratentorial, and posterior periatrial (Fig 1). If subjects did not have lesions in the prespecified regions with the required T1/T2 signal characteristics, these regions were ignored. T2 lesions were labeled as black hole (BH) and non-black hole (NBH). T1 black holes were differentiated from NBH by a visible decrease in signal intensity on the T1 sequence compared with normal-appearing adjacent white matter tissue, as has been de-scribed previously.20
Images from each time point were coregistered by using the FMRIB Software Library (FSL; http://fsl.fmrib.ox.ac.uk/).21
The images from the DTI dataset without diffusion weighting, the b⫽0 images, were coregistered to the baseline T1-weighted im-ages to determine tensor properties in lesional tissues. Inverse transformation was applied to localize ROIs in DTI space. GAD ROIs were observed on FA maps to ensure that these ROIs did not include CSF or CSF volume-averaging artifacts. Lesional ROIs were examined on FA maps and T1 postcontrast images to ensure that ROIs did not include T1 GAD lesions, CSF, or CSF volume-averaging artifacts. FA was used, given the possibility of image warping in DTI space to ensure that ROIs were not in the CSF or voxels adjacent to the CSF.
Statistical Analysis
The data from each ROI from the FA, MD, RD, and AD maps at all the different time points were extracted. For each subject, distri-bution plots of the data were created to identify extreme outliers (⬎2 SDs from the mean). ROI positions of outliers were checked on the different DTI maps and were corrected as needed to ensure that the ROIs did not include CSF, vascular spaces, or lesional tissue (for NAWM). The data were then re-extracted and rechecked.
Statistical testing was directed at demonstrating longitudinal change in DTI metrics among the different tissue types. Hypoth-esis-driven separate linear mixed models were used to estimate the mean difference in DTI metrics (RD, AD, FA, and MD) with time between NAWM and GAD tissue, NAWM versus T2 lesions, and BH versus NBH. We hypothesized that NAWM would be more stable compared with GAD and that BH would demonstrate more tissue injury than NBH. Each model included fixed effects for the following: 1) tissue type (NAWM and GAD tissue, NAWM and T2 lesions, or BH and NBH), 2) an interaction between tissue type and follow-up time in months (to separately model the DTI evolution in each group with time), and 3) subject age at the time of study initiation (to account for the change observed in DTI metrics with normal aging with time). The model also accounted for the effects of between-lesion variation with time by adding a normal random effect for each ROI to control the heterogeneity over different ROIs. ANOVA tests were used to determine whether the rate of change in DTI measures with time differed between tissue types. All analyses were performed by using the R Statistical Computing Software (Version 3.1.3; http://www.r-project.org/). The level of statistical significance was set atP⬍ .025 (2-tailed) with a correction for multiple comparisons, to ad-just for the 2 independent DTI metrics used in the study (RD, AD). A formal sample size calculation was not conducted, given the exploratory nature of the study.
RESULTS
Twenty-one subjects were recruited into the study. Demographics and baseline clinical/MR imaging characteristics have been previ-ously published in theAmerican Journal of Neuroradiology.17
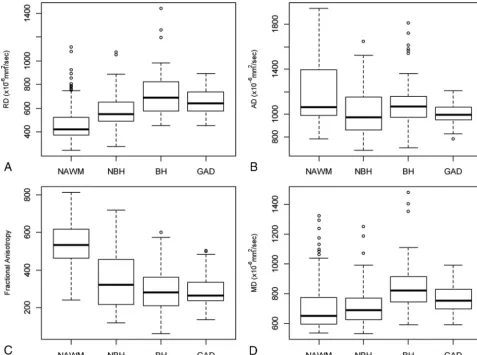
Sev-enteen (81.0%) subjects completed the 48-month scan, 1 subject died due to an unrelated cardiac event, and 3 subjects withdrew from the study before completion (at 12, 18, and 24 months). Figure 2shows AD and RD boxplots for NAWM, GAD, and T2 lesions. Sixty-one GADs were identified at baseline (mean lesion size, 751.3 mm3) along with 141 chronic T2 lesions, of which 90
were BH and 51 were NBH (mean T2 lesion size, 666.8 mm3).
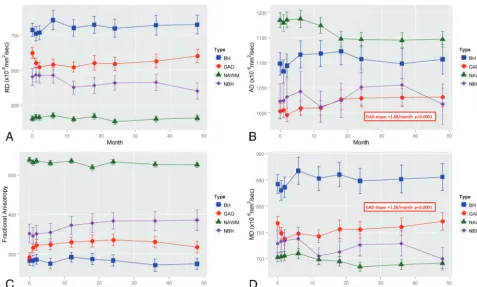
Longitudinal DTI metrics for NAWM, GAD, and T2 lesions are presented inFig 3. Results of linear mixed-effects models with average yearly changes in DTI metrics are presented inTables 1 (NAWM, GAD) and2(T2 lesions).
DTI Changes in NAWM
No statistically significant changes were observed with time in DTI metrics from NAWM ROIs (allP⬎.08). RD and MD showed an increasing trend with time, while FA and AD showed a trend toward decreases with time.
DTI Changes in GAD
An increase in AD of 1.88⫻10⫺6mm2/s per month was observed
during 4 years in GAD tissues (P⬍.0001). A nonsignificant in-crease of 0.66⫻10⫺6mm2/s change per month in RD was
ob-served (P⫽.037), which, in combination with AD, resulted in an overall increase of 1.28⫻10⫺6mm2/s per month (P⬍.0001) in
MD as well.
DTI Changes in T2 Lesions
RD did not significantly change with time in T2 lesions. An in-crease of 0.54⫻10⫺6mm2/s per month in AD (P⫽.003) with a
[image:3.594.56.530.47.292.2](P⫽.021) was observed. FA increased by 0.16⫻10⫺6mm2/s per
month, but this increase was not statistically significant (P ⫽ .048). No significant changes were seen in the evolution of DTI metrics in either BH or NBH when analyzed alone (allP⬎.04). RD increased with time in BH and decreased in NBH, though changes were not significant.
Comparative Evolution of DTI in Different Tissue Types
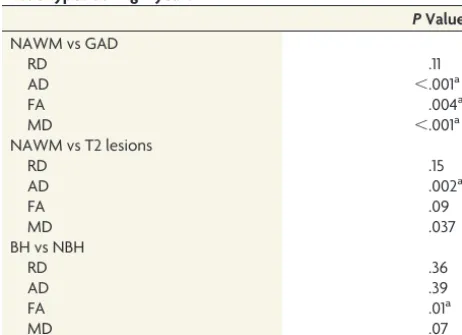
The tests of fixed effects by ANOVA (Table 3) showed a significant difference between GAD and NAWM in the rate of change with time in AD (P⬍.0001), but not for RD (P⫽.111). AD increased with time in GAD tissue and was stable in NAWM. When we compared T2 lesions and NAWM, a significant difference was detected for AD (P⫽.002), with no significant difference for RD (P⫽.86). When we compared BH and NBH, no differences were observed for RD or AD; however, a significant difference in the evolution of FA was observed between BH and NBH (P⫽.012), showing a decrease in FA in BH and an increase in NBH.
DISCUSSION
At baseline, DTI metrics showed expected differences, with higher RD and MD along with lower FA and AD in gadolinium-enhanc-ing tissue compared with NAWM. This findgadolinium-enhanc-ing suggests the pres-ence of more severe demyelination and axon loss in lesional tissue
compared with NAWM based on the findings in animal models, showing that RD correlates with myelination and AD correlates with axonal injury.6,22It is likely that edema was an additional
contributing factor to an increase in RD at the time of acute de-myelination.23 In chronic T2 lesions, DTI metrics at baseline
showed higher RD and MD with lower FA and AD compared with NAWM. DTI metrics at baseline were similar in GAD and chronic T2 lesions, but overall GAD tissues had slightly higher RD and slightly lower FA, MD, and AD at baseline. Similar to prior stud-ies,24,25BH showed greater diffusivity at baseline compared with
NBH, suggesting greater tissue injury. As would be expected, FA was significantly lower at baseline in BH than in NBH. Alterna-tively, AD at baseline was similar in BH and NBH. This outcome would not normally be expected because axon loss is a clear his-tologic feature of BH lesions.26,27 Our findings illustrate why
equating AD with axonal integrity is an oversimplification of a complex measure. Our findings are similar to previous results showing that AD does not predict BH formation.11,17
No statistically significant changes were observed in the longi-tudinal evolution of DTI metrics in NAWM. This finding is con-sistent with the findings of previous groups,28but it is in contrast
to previous shorter term studies that have shown tract-specific longitudinal changes in NAWM DTI values.8The trends observed
[image:4.594.54.532.47.402.2]in NAWM changes with time in our study were similar to what would be pathophysiologically expected, with an increase in RD and decrease in AD with time indicating progressive demyelina-tion with ongoing axonal loss. One explanademyelina-tion for the absence of statistical significance is the relative lack of inflammatory activity seen in our patient population. Highly effective treatment may mitigate longitudinal changes in DTI. Anti-inflammatory thera-pies are likely to limit the amount of demyelination and secondary axon loss, making differences more difficult to observe.29A
sec-ond explanation may relate to technical differences between our study and that of Harrison et al.8 In our study, ROIs in the
NAWM were individually drawn and voxel volume was relatively small compared with a tractography-based technique. A larger sample size of voxels may have shown statistically significant re-sults in the trends described above.
In gadolinium-enhancing tissue, significant changes were
ob-served in AD and MD during the study period. A progressive increase in AD was observed during 4 years and is similar to prior findings. Naismith et al11did not
find significant changes in AD at the time of gadolinium-enhancement, but in their data, AD also appeared to increase during 1 year of follow-up. The longitudinal in-crease in AD may have been partially driven by the increase in AD observed in the first month following lesion forma-tion; however, inspection of the trend of AD shows that this was only a marginal contribution. Given similar results observed in T2 lesions (see below), we conclude that the change in AD is likely a biologic effect in lesional tissue. An alternate explanation may relate to the severity of axon loss in acute lesions. Postmortem analyses have shown that axon loss is maximal at the time of gadolinium-en-hancement and that with time, axonal loss becomes less preva-lent.30It is hypothesized that the initial injury causes an acute and
severe loss of axons, which is detected by a marked drop in AD. The subsequent increase in AD might be a reflection of a second-ary process occurring during chronic lesion evolution. The in-crease in AD may be due to a partial repair mechanism or may represent chronic lesion changes with scar formation or replace-ment by CSF/glial tissue.
When comparing the longitudinal evolution of DTI in GAD tissue and NAWM, significant differences were found for AD but not RD. This finding may indicate that distinct processes
[image:5.594.53.531.44.331.2]FIG 3. Longitudinal evolution of DTI metrics during 4 years for, non-black holes, black holes, and gadolinium-enhancing lesions for radial diffusivity (A), axial diffusivity (B), fractional anisotropy (C), and mean diffusivity (D). Mean values (symbol) and 95% confidence intervals (error bars) are presented. Statistical significance and effect from the mixed-model effect are presented in boxes.
Table 1: Longitudinal DTI changes in NAWM and GAD Change/
Month 95% CI
% Annualized
Change PValue
NAWM
RD⫻10⫺6mm2/s 0.2193 ⫺0.187 to 0.625 0.57% .2898
AD⫻10⫺6mm2/s ⫺0.2109 ⫺0.614 to 0.192 ⫺0.21% .3052
FA⫻10⫺3 ⫺0.2572 ⫺0.551 to 0.037 ⫺0.57% .0865
MD⫻10⫺6mm2/s 0.03209 ⫺0.331 to 0.396 0.05% .8626
GAD
RD⫻10⫺6mm2/s 0.6107 0.039 to 1.285 1.22% .0374
AD⫻10⫺6mm2/s 1.8831 1.135 to 2.631 2.25% ⬍.0001a
FA⫻10⫺3 0.5074 0.031 to 0.984 2.10% .037
MD⫻10⫺6mm2/s 1.2788 0.695 to 1.863 2.00% ⬍.0001a
[image:5.594.54.370.389.516.2]outside demyelination are occurring in lesional tissue that can alter AD but not RD. The absence of changes in RD may represent the abrogation of demyelination induced by natalizumab and may explain differences with prior studies.31The exact changes
that drive the change in AD in lesional tissue are not clearly un-derstood and will require further study, including an analysis of the different enhancement patterns within the gadolinium-en-hancing lesions and pathologic correlation with DTI measures.
Similar to what was found in GAD tissue, a progressive in-crease in AD was observed during the 4-year study period in T2 lesions. This finding is of unclear significance, but similar changes have been previously reported as described above. The lack of any inflammatory-driven changes in these lesions along with the sim-ilar changes in GAD tissue suggests that the increase in AD is a real phenomenon and not a spurious result. The pathologic signifi-cance of this change is more difficult to determine. The correla-tion of AD with axonal integrity may be different in brain and optic nerve tissues,5where fibers are more-or-less homogeneous
in direction. Conversely, brain lesions may contain various differ-ent fibers, and an increase in AD may be due to selective loss of certain fibers, resulting in counterintuitive changes in DTI measures.32
Our study also showed no significant difference in the evolution of RD or AD in BH and NBH. Regarding AD, it appears that the overall progressive increase in T2 lesions was likely determined by changes in BH, and this possibility supports a bio-logic gradient among NAWM, NBH, and finally BH. While changes were not signif-icant, RD progressively increased in BH and decreased in NBH; these findings suggest ongoing demyelination in BH and possible remyelination in NBH lesions. Remyelination is a well-described phe-nomenon in NBH and has been demon-strated with magnetization transfer ratio imaging previously.33,34
Our study was limited due to the ab-sence of a control arm treated with something other than natali-zumab. We aimed to study MS in a population with little inflam-matory disease activity to minimize the effects of ongoing tissue inflammation on DTI measures. Our study was also limited by patients who dropped out of the study. However, it is likely that these drop-outs were patients who did not tolerate natalizumab or who stayed on the medication for only a short time, thus lim-iting the overall effect on the study.
An additional area of concern is the difficulty in delineating specific lesional tissue with time. Changes in the tissue architec-ture with time related to gliosis, resolution of edema, and brain atrophy complicate following lesions longitudinally. We used the T2 ROIs at baseline as a guide to follow the extent of the lesion on follow-up scans, but this method did not take into account areas where brain tissue remyelinates and lesions essentially resolve. This limitation is implicit in any study dealing with dynamic tis-sue changes. The stability of DTI measures in the first 3 time points from chronic lesion tissue and NAWM along with signifi-cant variability in GAD tissue demonstrates that DTI measures are quite sensitive to inflammatory changes. NAWM and chronic lesion measures showed good reliability during short imaging in-tervals (1 month).
A change to the b-value in the DTI sequence was required at month 12 due to vibration-related artifacts. ROI placement avoided regions affected by the vibration artifacts. Noise floor effects can result in systematic bias among measurements taken at different b-values. With a sufficiently low signal-to-noise ratio and in regions of high anisotropy, a reduction in b-value can result in an artifactual increase in diffusivity.35However, if the
effects were substantial, we would expect an increase in diffusivity in all tissue types. Decreases in diffusivity values in normal-ap-pearing white matter and lesional tissue, while not statistically significant, suggest that the impact of bias with the change in b-value did not have a meaningful impact on our data.
[image:6.594.52.371.58.232.2]The use of DTI in clinical trials has significant promise; how-ever, the DTI outcomes to be used should be tailored depending on the therapeutic mechanism of action and MS disease type. The selection of both the DTI metrics and the tissue from which these metrics are obtained is of importance when considering outcomes for clinical trials. For trials of agents that promote remyelination,
Table 2: Longitudinal DTI changes in chronic lesional tissue
Change/Month 95% CI
% Annualized
Change PValue All T2 lesions
RD⫻10⫺6mm2/s 0.05683 ⫺0.181 to 0.295 0.11% .6401
AD⫻10⫺6mm2/s 0.5411 0.251 to 0.831 0.62% .0003a
FA⫻10⫺3 0.163 0.001 to 0.324 0.61% .0482a
MD⫻10⫺6mm2/s 0.2695 0.040 to 0.499 0.41% .0211a
BH
RD⫻10⫺6mm2/s 0.3392 ⫺0.028 to 0.706 0.57% .0701
AD⫻10⫺6mm2/s 0.1967 ⫺0.200 to 0.593 0.22% .331
FA⫻10⫺3 ⫺0.2137 ⫺0.422 to⫺0.005 ⫺0.91% .0444
MD⫻10⫺6mm2/s 0.2919 ⫺0.059 to 0.643 0.42% .1026
NBH
RD⫻10⫺6mm2/s ⫺0.4137 ⫺0.967 to 0.140 ⫺0.85% .1432
AD⫻10⫺6mm2/s ⫺0.2392 ⫺0.838 to 0.360 ⫺0.28% .434
FA⫻10⫺3 0.2907 ⫺0.025 to 0.606 0.99% .0708
MD⫻10⫺6mm2/s ⫺0.355 ⫺0.174 to 0.884 ⫺0.58% .1883
a P⬍.05.
Table 3: Analysis of variance of fixed effects on longitudinal changes comparing evolution of DTI metrics from different tissue types during 4 years
PValue NAWM vs GAD
RD .11
AD ⬍.001a
FA .004a
MD ⬍.001a
NAWM vs T2 lesions
RD .15
AD .002a
FA .09
MD .037
BH vs NBH
RD .36
AD .39
FA .01a
MD .07
[image:6.594.53.284.278.445.2]RD is a natural choice because it is thought to be a marker of myelin content. In NAWM, RD shows a tendency to increase with time. Although in our study, this increase was not statistically significant, therapies that promote remyelination may show a progressive decrease in RD. The study of RD in NAWM is advan-tageous because the cellular architecture is preserved and there is no confounding inflammatory activity, making the interpretation of DTI measures more straightforward. These advantages make RD within NAWM a good potential outcome for primary neuroprotection.
Although AD has been purported as a measure of axonal in-tegrity, our results suggest that lesional AD is not likely correlated to axonal content because AD was not significantly different in BH and NBH. AD may provide a sensitive measure of ongoing disease processes in lesional tissue; however, the pathologic sig-nificance of this new finding remains unclear and will have to be studied in the future. The summary measures FA and MD are difficult to interpret as stand-alone measures, so they are less at-tractive as clinical trial outcomes. FA appears to be a good marker of acute lesion formation; however, the longitudinal evolution of FA did not show statistically significant changes in NAWM and only marginal changes in lesional tissue. In summary, our data suggest that DTI holds promise in trials that promote remyelina-tion and tissue repair within lesions and to a lesser extent in NAWM.
CONCLUSIONS
Lesional tissue demonstrated higher values of RD and lower val-ues of AD compared with NAWM, likely representing demyelina-tion with a component of axon loss. No statistically significant changes were observed with time in NAWM. A progressive in-crease in AD was also observed in GAD tissues and chronic T2 lesions; however, the significance of this change remains unclear from a pathologic standpoint. Our findings suggest that AD from lesional tissue may be a more sensitive metric than RD from le-sions or DTI measures from NAWM. The description of AD in lesional tissue as a surrogate of axon content in MS should be revisited, given its poor ability to differentiate BH and NBH.
ACKNOWLEDGMENTS
We acknowledge the assistance of our research support staff, ra-diology technicians, and information technology staff at the Mel-len Center.
Disclosures: Daniel Ontaneda—RELATED:Grants/Grants Pending: Dr Ontaneda is supported by a National Institutes of Health (Clinical and Translational Science Col-laborative of Cleveland, KL2TR000440) KL2 Award and a National Multiple Sclerosis Clinical Fellowship Award (FP 1769-A-1);UNRELATED: Consultancy: Dr Ontaneda has received consulting fees from Acorda Therapeutics, Alkermes, Biogen Idec, Gen-zyme, Genentech, Mallinckrodt, and Novartis;OTHER: research support from No-vartis and Genzyme. Ken Sakaie—UNRELATED:Grants/Grants Pending:National Institutes of Health,* National Multiple Sclerosis Society,* Department of Defense,* American Heart Association,* the Chiari and Syringomyelia Foundation,* Novartis,* Genzyme,* Biogen.* Jian Lin—RELATED:Grant: National Multiple Sclerosis Society*; UNRELATED:Grants/Grants Pending: Novartis.* Mark J. Lowe—UNRELATED: Con-sultancy: Siemens. Michael D. Phillips—UNRELATED:Payment for Lectures (includ-ing service on Speakers Bureaus): Siemens,Comments: honorarium for speaking. Robert J. Fox—RELATED:Grant: National Multiple Sclerosis Society (RG3546)*; UN-RELATED:Board Membership: MedDay,Comments: Scientific Advisory Board; Con-sultancy: Avanir Pharmaceuticals, Allozyne, Biogen Idec, Novartis, Questcor
Pharma-ceuticals, Teva Neuroscience;Research Support: Novartis. *Money paid to the institution.
REFERENCES
1. Lassmann H.Models of multiple sclerosis: new insights into patho-physiology and repair.Curr Opin Neurol2008;21:242– 47CrossRef Medline
2. Ontaneda D, Fox RJ, Chataway J.Clinical trials in progressive mul-tiple sclerosis: lessons learned and future perspectives.Lancet Neu-rol2015;14:208 –23CrossRef Medline
3. Fox RJ.Picturing multiple sclerosis: conventional and diffusion tensor imaging.Semin Neurol2008;28:453– 66CrossRef Medline
4. Beaulieu C, Allen PS.Determinants of anisotropic water diffusion in nerves.Magn Reson Med1994;31:394 – 400CrossRef Medline
5. Song SK, Sun SW, Ju WK, et al.Diffusion tensor imaging detects and differentiates axon and myelin degeneration in mouse optic nerve after retinal ischemia. Neuroimage 2003;20:1714 –22 CrossRef Medline
6. Song SK, Sun SW, Ramsbottom MJ, et al.Dysmyelination revealed through MRI as increased radial (but unchanged axial) diffusion of water.Neuroimage2002;17:1429 –36CrossRef Medline
7. Budde MD, Kim JH, Liang HF, et al.Toward accurate diagnosis of white matter pathology using diffusion tensor imaging.Magn Reson Med2007;57:688 –95CrossRef Medline
8. Harrison DM, Caffo BS, Shiee N, et al.Longitudinal changes in dif-fusion tensor-based quantitative MRI in multiple sclerosis. Neurol-ogy2011;76:179 – 86CrossRef Medline
9. Goodkin DE, Rooney WD, Sloan R, et al.A serial study of new MS lesions and the white matter from which they arise.Neurology1998; 51:1689 –97CrossRef Medline
10. Werring DJ, Brassat D, Droogan AG, et al.The pathogenesis of le-sions and normal-appearing white matter changes in multiple sclerosis: a serial diffusion MRI study.Brain2000;123(pt 8):1667–76
CrossRef Medline
11. Naismith RT, Xu J, Tutlam NT, et al.Increased diffusivity in acute multiple sclerosis lesions predicts risk of black hole.Neurology 2010;74:1694 –701CrossRef Medline
12. Rocca MA, Cercignani M, Iannucci G, et al. Weekly diffusion-weighted imaging of normal-appearing white matter in MS. Neu-rology2000;55:882– 84CrossRef Medline
13. Filippi M, Iannucci G, Cercignani M, et al.A quantitative study of water diffusion in multiple sclerosis lesions and normal-appearing white matter using echo-planar imaging. Arch Neurol 2000;57: 1017–21CrossRef Medline
14. Ransohoff RM.Natalizumab for multiple sclerosis.N Engl J Med 2007;356:2622–29CrossRef Medline
15. Tuch DS, Reese TG, Wiegell MR, et al.High angular resolution dif-fusion imaging reveals intravoxel white matter fiber heterogeneity.
Magn Reson Med2002;48:577– 82CrossRef Medline
16. Landman BA, Farrell JA, Jones CK, et al.Effects of diffusion weight-ing schemes on the reproducibility of DTI-derived fractional an-isotropy, mean diffusivity, and principal eigenvector measure-ments at 1.5T.Neuroimage2007;36:1123–38CrossRef Medline
17. Fox RJ, Cronin T, Lin J, et al.Measuring myelin repair and axonal loss with diffusion tensor imaging.AJNR Am J Neuroradiol2011;32: 85–91CrossRef Medline
18. Polman CH, Reingold SC, Edan G, et al.Diagnostic criteria for mul-tiple sclerosis: 2005 revisions to the “McDonald criteria.”Ann Neu-rol2005;58:840 – 46CrossRef Medline
19. Hiltunen J, Hari R, Jousma¨ki V, et al.Quantification of mechanical vibration during diffusion tensor imaging at 3 T.Neuroimage2006; 32:93–103CrossRef Medline
20. Brex PA, Parker GJ, Leary SM, et al.Lesion heterogeneity in multiple sclerosis: a study of the relations between appearances on T1 weighted images, T1 relaxation times, and metabolite concentra-tions. J Neurol Neurosurg Psychiatry 2000;68:627–32 CrossRef Medline
and structural MR image analysis and implementation as FSL. Neu-roimage2004;2(suppl 1):S208 –19Medline
22. Wang S, Wu EX, Tam CN, et al.Characterization of white matter injury in a hypoxic-ischemic neonatal rat model by diffusion tensor MRI.Stroke2008;39:2348 –53CrossRef Medline
23. Kim JH, Loy DN, Liang HF, et al.Noninvasive diffusion tensor im-aging of evolving white matter pathology in a mouse model of acute spinal cord injury. Magn Reson Med 2007;58:253– 60 CrossRef Medline
24. Castriota Scanderbeg A, Tomaiuolo F, Sabatini U, et al. Demyelinat-ing plaques in relapsDemyelinat-ing-remittDemyelinat-ing and secondary-progressive mul-tiple sclerosis: assessment with diffusion MR imaging.AJNR Am J Neuroradiol2000;21:862– 68Medline
25. Nusbaum AO, Lu D, Tang CY, et al.Quantitative diffusion measure-ments in focal multiple sclerosis lesions: correlations with appear-ance on TI-weighted MR images.AJR Am J Roentgenol2000;175: 821–25CrossRef Medline
26. Bitsch A, Kuhlmann T, Stadelmann C, et al.A longitudinal MRI study of histopathologically defined hypointense multiple sclerosis lesions.Ann Neurol2001;49:793–96CrossRef Medline
27. Bru¨ck W, Bitsch A, Kolenda H, et al.Inflammatory central nervous system demyelination: correlation of magnetic resonance imaging findings with lesion pathology. Ann Neurol 1997;42:783–93
CrossRef Medline
28. Rashid W, Hadjiprocopis A, Davies G, et al.Longitudinal evaluation
of clinically early relapsing-remitting multiple sclerosis with diffu-sion tensor imaging.J Neurol2008;255:390 –97CrossRef Medline
29. Boretius S, Escher A, Dallenga T, et al.Assessment of lesion pathol-ogy in a new animal model of MS by multiparametric MRI and DTI.
Neuroimage2012;59:2678 – 88CrossRef Medline
30. Kuhlmann T, Lingfeld G, Bitsch A, et al.Acute axonal damage in multiple sclerosis is most extensive in early disease stages and de-creases over time.Brain2002;125:2202–12CrossRef Medline
31. Moll NM, Rietsch AM, Thomas S, et al.Multiple sclerosis normal-appearing white matter: pathology-imaging correlations.Ann Neu-rol2011;70:764 –73CrossRef Medline
32. Roosendaal SD, Geurts JJ, Vrenken H, et al.Regional DTI differences in multiple sclerosis patients. Neuroimage 2009;44:1397– 403
CrossRef Medline
33. Zivadinov R, Hussein S, Bergsland N, et al.Magnetization transfer imaging of acute black holes in patients on glatiramer acetate.Front Biosci (Elite Ed) 2012;4:1496 –504Medline
34. Chen JT, Kuhlmann T, Jansen GH, et al; Canadian MS/BMT Study Group.Voxel-based analysis of the evolution of magnetization transfer ratio to quantify remyelination and demyelination with histopathological validation in a multiple sclerosis lesion. Neuro-image2007;36:1152–58CrossRef Medline