What is the relationship between lightness and perceived
illumination
GILCHRIST, Alan and SORANZO, Alessandro <http://orcid.org/0000-0002-4445-1968>
Available from Sheffield Hallam University Research Archive (SHURA) at: http://shura.shu.ac.uk/24619/
This document is the author deposited version. You are advised to consult the publisher's version if you wish to cite from it.
Published version
GILCHRIST, Alan and SORANZO, Alessandro (2019). What is the relationship between lightness and perceived illumination. Journal of Experimental Psychology: Human Perception and Performance, 45 (11), 1470-1483.
Copyright and re-use policy
See http://shura.shu.ac.uk/information.html
Sheffield Hallam University Research Archive
1
What is the relationship between lightness and perceived
illumination.
Alan Gilchrist* and Alessandro Soranzo&
*Department of Psychology, Rutgers University, Newark, NJ 07102, USA.
&Faculty of Social Sciences and Humanities - Sheffield Hallam University,
Sheffield, UK.
Corresponding author: Alan Gilchrist
Psychology Dept. Rutgers University Newark, NJ 07102 Fax: (973)353-1171
Tel No: (973) 353-5440 Ext.3951
E-mail [email protected]
2
Abstract
Surface reflectance and illumination level, which are confounded in the retinal image, must be disentangled by the visual system and a theory of
lightness must explain how. Thus, a theory of surface lightness should also be a theory of perceived illumination and describe the relationship between them. Perceived illumination and perceived grey values have been measured using a new technique. Looking into a vision tunnel, observers saw two square
apertures in the far wall, each revealing a patch of wall composed of two shades of grey. They adjusted the illumination level in one aperture to match that in the other. The stimuli placed in the apertures varied in luminance
range, spatial frequency, and relative area. Results show that 1) illumination is matched for highest luminance (with no effect of spatial frequency).
Combined with earlier findings that lightness is anchored by highest luminance, this supports Koffka’s suggestion that lightness and perceived
illumination are coupled in an invariant way. 2) Changes in the relative area of
the light and dark shades produced complementary influences on perceived illumination and surface lightness. That is, when stimulus conditions evoke a conflict between anchoring the highest luminance at white and anchoring the largest area at white, enlarging the darker shade causes its lightness to
3 further supporting Koffka. 3) These findings allow perceived illumination level to now be systematically incorporated into anchoring theory, which until this point has been solely a theory of surface lightness.
Public Significance:
A black surface in sunlight can reflect more light to the eye than a white in
shadow. Thus, the light coming to the eye from a surface does not reveal the
lightness (black-white dimension) of the surface. Anchoring theory is a leading
theory of human lightness computation but, until now, was silent on the question of
perceived illumination level. New experiments show the factors that determine
perceived illumination level, clarifying the relationship between perceived surface
4
The problem
The light reaching the eye from a surface bears the imprint of both the light illuminating that surface and the reflecting properties of the surface itself and this confound forms the fundamental challenge of lightness perception. The visual system must disentangle reflectance (percentage of light reflected) from illumination and a theory of lightness must explain how these are
disentangled. Thus, a theory of surface lightness should also be a theory of perceived illumination and describe the relationship between them. In this paper, we focus on two main questions, (1) What is the basis for perception of
illumination level and (2) what is the relationship between perceived illumination and perceived surface lightness? We begin with a historical overview of positions and developments on these issues.
Recognizing that the luminance (amount of light reaching the eye) from
a surface fails to specify its reflectance, von Helmholtz (1866/1925) famously suggested, as Alhazen (1083/1989) had much earlier, that the visual system unconsciously takes into account the illumination on each surface. Helmholtz did not explain how illumination level could be estimated except for a
suggestion, contained in remarks on chromatic color, that it is based on the
5 Helmholtz, attributed lightness perception to “reciprocal action in the somatic
visual field”, making no reference to the perception of illumination. Katz (1935), in his thorough phenomenalogical account of color
experience, made it clear that illumination level is part of our experience of a scene. But he also created the basic methods for studying lightness constancy still used today. Although Katz criticized Helmholtz’s theory, in practical terms his own theory is scarcely different on how perceived illumination is
estimated. And Katz was even more explicit that perceived illumination is based on average luminance, which he referred to as the “total insistence of
the visual field” (p 279).
Helmholtz’s claim that lightness depends on perceived illumination, called the albedo hypothesis, also implies that lightness and perceived
illumination are tightly coupled in a complementary relationship Anticipating the later decomposition models, the gestaltist Koffka (1935) affirmed a
complementary relationship between lightness and perceived illumination
but rejected the idea that one depends on the other, suggesting that the two “might as well be concomitant effects of a common cause” (p 349). He
formalized this complementarity in an invariance theorem, writing that, “a combination of whiteness and brightness, possibly their product, is an
6 If two equal proximal stimulations produce two surfaces of different
whiteness, then these surfaces will also have different brightnesses, the whiter one will be less, the blacker one more bright” (p 244). (Note: Koffka
used the term brightness to mean perceived illumination whereas in modern usage, brightness means perceived luminance).
Other gestalt writers, such as Gelb (1929) and Kardos (1934), endorsed the complementarity of surface lightness and perceived illumination. Indeed,
Gelb’s famous illusion has been used as an example. A piece of black paper is suspended in midair and illuminated by a spotlight. This causes two equal and opposite errors. The paper is seen as much lighter than its actual value (white
rather than black) AND its perceived illumination level is much lower than its actual value; that is, the paper is perceived to share the same illumination as the surrounding room when it is actually more brightly illuminated by the spotlight. Lightness and perceived illumination shift in opposite ways as soon as the black paper is surrounded by a larger white paper, also in the spotlight.
Lightness shifts from white to black while perceived illumination shifts from the dimmer prevailing illumination of the room to the brightness of a
spotlight.
Later, Kozaki and Noguchi (1976; Noguchi & Kozaki, 1985) would
7 distinguish Koffka’s more symmetrical view from the causal ordering implicit
in the albedo hypothesis.
Back to reductionism
The rich development of lightness theory in Europe during the 1930s was cut short by developments surrounding World War II. After the war the center of scientific work shifted to the United States, where behaviorism was firmly in control. Until the 1970s, everything in lightness perception was
attributed to lateral inhibition. A gray square on a white background appeared darker than an identical square on a white background because light from the white background inhibited neural activity associated with the enclosed gray
square. Likewise, even though the luminance of a gray paper in bright
illumination was much higher than that of a gray paper in shadow, the neural activity produced by the two papers would be similar, due to the inhibition produced by the brightly illuminated surround. The so-called contrast
theories of that period had their roots in Hering (1874/1964), and like Hering,
8 Other non-contrast theorists were skeptical about perception of the illumination and rejected the tight linkage between illumination and lightness. Beck (1959, 1961, 1972) explicitly rejected the albedo hypothesis (and by
extension, the invariance theorem), arguing that lightness and perceived illumination level have separate stimulus correlates. Wallach (1976, p 32) wrote that, “the perception of illumination is not relevant to the issue of
constancy.” Helson (1964) said little about perceived illumination. But the
adaptation level in his adaptation level theory, has sometimes been treated as a surrogate for illumination level, and it is based explicitly on average
luminance.
The rise and fall of inverse optics
The impoverished account based on lateral inhibition was swept aside during the cognitive revolution and the emergence of decomposition theories (Bergström, 1977; Barrow & Tenenbaum, 1978; Gilchrist, 1979; Marr, 1982; Adelson & Pentland, 1990; Adelson, 1993; Arend, 1994). The retinal image
was decomposed into the separate components of reflectance and
9 either reflectance or illumination, and (c) integrated within each class, to
produce two intrinsic images, one a map of the reflectances in the scene, the other a map of the perceived illumination across the scene (Gilchrist, 1979;
Gilchrist, Delman & Jacobsen, 1983). Adelson (1993) spoke of “…sophisticated mechanisms that decompose the image into a set of intrinsic images
representing reflectance, illumination, and transparency” (p 2044). The intrinsic image approach is completely consistent with Koffka’s theorem.
In this summary, we do not comment on the many so-called brightness models (Blakeslee & McCourt, 1999; Grossberg & Todorović, 1988; Shapiro & Lu, 2011). These models seek to account for the perception of luminance
(brightness) whereas we have focused on lightness, that is, the perception of surfaces that reflect light.
The rise of mid-level theories
By the end of the 1990s, failures of these decomposition theories were beginning to mount. They could not explain the familiar simultaneous contrast
10 shown by empirical results. New work on change blindness (Rensink, O'Regan & Clark, 1997; Simons & Levin, 1997) was making the same point.
Both Gilchrist and Adelson began to abandon the inverse optics
approach, developing what Nakayama (1999) called mid-level models. These offered a more adequate account of perceptual experience than the low-level contrast theories based on lateral inhibition, but stopped short of the full-blown representation implied by inverse optics, referred to by Adelson as
“overkill”. Gilchrist and his collaborators (Gilchrist et al, 1999) proposed an
anchoring theory of lightness, in which the image is parsed into frames of reference, closely related to the atmospheres and adaptive windows proposed
by Adelson (2000). In like manner, Singh and Anderson (2002) rejected Metelli’s inverse optics account of perceived transparency, in favor of a mid-level approach that contained its own anchoring rule.
Some writers, such as Soranzo and Agostini (2006a, 2006b), continue to endorse the inverse optics approach. Others, like Brainard and his co-authors
(Brainard & Wandell, 1991; Brainard, Wandell & Chichilnisky, 1993; Doerschner, Boyaci, and Maloney, (2004); Gerhard & Maloney (2010);
Brainard & Maloney, 2011), at least in the chromatic domain, have proposed an equivalent illumination model, suggesting that the visual system uses the
11 illuminant coordinates. These coordinates are then used by the visual system, much as in the albedo hypothesis, to set the transformation between the color signal corresponding to each surface and that surface’s perceived color.
Estimated illumination, however, may not correspond to physical illumination and this would explain color constancy failures.
But especially in the lightness domain, the most widely cited theories are those of Gilchrist and Adelson. Until now, neither of these mid-level
approaches has offered a concrete account of either the basis for perception of the illumination or of the relationship between surface lightness and
perceived illumination. Anchoring theory, as published, is strictly a theory of
perceived surface lightness. It has been criticized by Anderson, Whitbread and de Silva (2014) and others for its silence on the pregnant question of
perceived illumination. In the work reported here, we address this deficit. Historically, some writers have tended to deny that illumination is perceived. Helmholtz (1866/1924, v. 2, p. 287) suggested that illumination is
“eliminated” in the process of achieving lightness constancy. Katz (1935, p. 38) remarked that: “one searches Hering’s writings in vain for a statement
that the experience of illumination is an independent factor in ordinary colour-perception.” However, one need only look around to confirm that the
12 perceived, and this has been documented in many reports, both older and more recent (Kozaki & Noguchi, 1976; Noguchi & Kozaki, 1985; Oyama, 1968; Noguchi & Masuda, 1971; Kozaki, 1965, 1973; Beck, 1959, 1961; Kartashova,
et al, 2015; Xia et al, 2014; Mury et al, 2007; Xia et al, 2017).
Because the fundamental problem of lightness perception stems from the fact that surface reflectance and illumination intensity are confounded in retinal luminance values, our work is focused on the perception of
illumination intensity and its relationship to surface lightness. Thus, we do not review the many reports concerning the perception of lighting direction,
diffuseness, light source distance, shading, or lighting color.
Empirical results
Results supporting the invariance concept have been reported by Oyama (1968), Kozaki and Noguchi (1976), Noguchi and Kozaki (1985), Gilchrist, Delman and Jacobsen (1983), Gilchrist and Jacobsen, (1984), and Bonato and Gilchrist (1994). Rutherford and Brainard (2002) have presented
evidence challenging the invariance hypothesis.
Empirical work on perceived illumination is limited, but tends to show that perceived illumination depends on highest luminance, rather than
13 (1965; 1973) all found results supporting highest luminance. Beck (1959; 1961) equivocated on the issue after testing perceived illumination using several strange textures as stimuli. Zdravković, Economou & Gilchrist (2012)
showed that two spatially separate fields of illumination are perceptually treated as a single field of illumination as long as the two fields have the same highest luminance.
A new method
The aim of Experiments 1 through 4 was to determine whether
perceived illumination is based on the highest luminance (HL) or the average luminance (AL) within a field of illumination. Measuring perceived
illumination level is not as easy as measuring lightness, partly because
illumination level is not as salient a part of our visual experience as is surface lightness. In previous lab work we have found the perceived illumination matches show more variability than lightness matches (Bonato & Gilchrist, 1994). We created an apparatus for measuring the brightness of perceived
illumination that we felt would be quite intuitive and simple. Observers
14
General Method
Apparatus
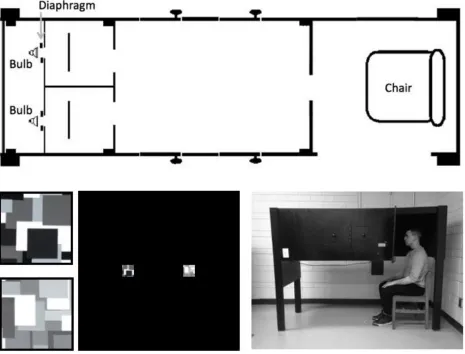
The experiment was conducted within a vision tunnel (61 cm wide, 62 cm high, and 203 cm deep), as shown in Figure 1. The tunnel was divided into a viewing booth (66 cm deep), a stimulus chamber (137 cm deep), two
side-by-side illuminations chambers (each 32 cm deep by 30 cm wide), and a chamber (17 cm deep) housing two light sources.
The observer sat in the viewing booth and looked into the stimulus chamber through a 1.5 by 13 cm horizontal aperture. The wall at the far end of
the stimulus chamber contained two 5.1 cm square windows (each
subtending 2.1 degrees of visual angle) separated by 18 cm. Each window revealed the interior of an integrating chamber that was illuminated by light from a Philips halogen 60W, 120V bulb which entered the chamber through a
round hole in the center of the back wall of each chamber. The intensity of light entering a chamber could be changed by adjusting the opening size of a circular metal diaphragm attached to the hole. A stimulus panel, containing a pattern of shades of gray and suspended in the center of this chamber, filled
the window from the observer’s point of view. Light coming through the
15 among the white walls, providing uniform illumination on the front of the panel.
The diaphragm was adjusted to provide a given intensity of illumination
in the left-hand window, designated the standard window. A plastic knob in the viewing booth was connected to the diaphragm controlling the
illumination in the right-hand, or adjustable window. The observer turned this
16
Figure 1 Clockwise from top: plan view of vision tunnel; outside view of tunnel; observer’s view of wall containing
two windows; low-range Mondrian; full range Mondrian. Wall was white, but wall luminance was 18 times lower
than a black patch in the Mondrian.
Observers
An a-priori power analysis was conducted to determine the adequate sample size within each experiment (see Maxwell, Kelley & Rausch, 2008). To this aim, we asked what would be the minimum effect that would have
17 investigating changes in the perception of illumination and in lightness, we reasoned that a theoretically meaningful effect should be at least as big as the just noticeable difference (JND) in perceived illumination and lightness for
conditions comparable with those of our study. Psychophysical measurements of perceived illumination and lightness discrimination revealed effect size estimates of 0.7 and 3.2, respectively (Kozaki, 1976). This was calculated by comparing the physical difference between two stimuli with their perceived
difference. Power analyses for one-tailed within-samples t-tests were
conducted in G*Power (Faul, Erdfelder, Lang, & Buchner, 2007) using an alpha of .05 and power of .80 and an effect size of 0.7 (i.e. the smaller between the
two estimations). These analyses suggested sample sizes of fifteen observers per experimental condition.
A separate group of fifteen observers, all with normal or corrected-to-normal acuity and naïve with the regard to the purpose of the experiments, participated in each of the experiments. The observers were undergraduate
18 University and was conducted in accordance with the Declaration of Helsinki (2008).
Procedure
Before the beginning of each experimental session, the illumination in the adjustable chamber was alternately set by the experimenter to either its maximum or minimum intensity. After being seated in the viewing chamber,
the observer was asked to adjust the illumination in the adjustable chamber until the two chambers appeared to be equally illuminated or appeared as a single chamber. The task was intuitive and easy to be performed.
Next, observers were asked to match the lightness of the darkest and lightest patch visible in each window, using the Munsell scale. Each trial lasted
about 2 minutes.
All statistical analysis was conducted using log luminance values. Any match lying more than three standard deviations away from the mean of the rest of the matches was considered an outlier, and the data from that subject
19
Experiment 1: Mondrian stimuli
Stimuli
The stimuli consisted of two well-articulated Mondrian patterns that differed in reflectance range: while the standard window contained a full reflectance range, from white to black, the adjustable window contained a
truncated range from white to mid-gray. The use of frameworks of different range made it possible to compare the two rules. Otherwise predictions based on highest luminance and average luminance would be identical.
The Mondrian in the standard window was composed of 36 rectangular
patches ranging from white (Munsell 9.5; 35 cd/m-2) to black (Munsell 2.5)
while the patches in the adjustable window ranged from white (Munsell 9.5) to only middle gray (Munsell 4.5). The illumination level in the tunnel itself was quite low, such that the luminance of the white wall containing the
20 Results
Illumination matches
Illumination matches were collected by measuring the luminance of the white patch (Munsell 9.5) in the adjustable window. According to Fechner’s law (1889), luminance matches were then transformed into logarithmic
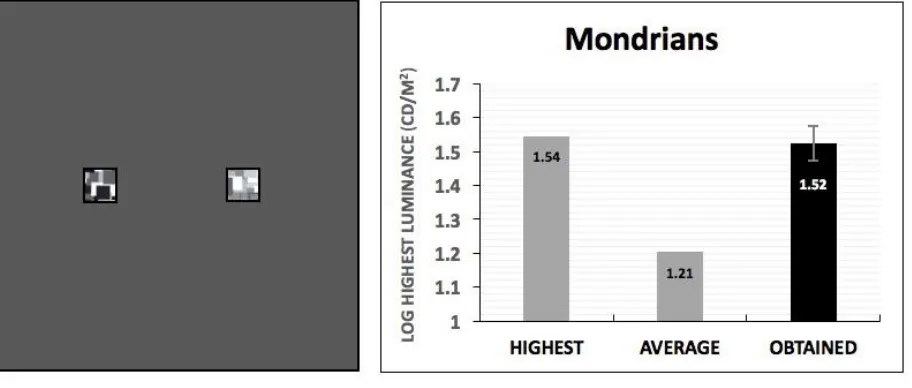
values. The results are shown in Figure 2, together with a sketch of the stimuli
[image:21.612.83.539.328.522.2]and predictions based on the HL and AL rules.
Figure 2. Left: Observer’s view of wall. Right: Predicted (light bars) and obtained (black bar) illumination levels.
Y-axis is log luminance, in cd/m-2, of the white patch in the adjustable chamber.
If illumination were determined by the HL rule, the expected log
21 white in the adjustable chamber would have been 1.21, calculated as shown in equation 1. 9.5 2.5 9.5 9.5 9.5 4.5 ( * ) * ( * ) R R R R R R R R R
Lum RA
AL
R
R RA
= = = = =
Equation 1 Where:ALR9.5 = Luminance of Munsell 9.5 in the adjustable window according to AL rule.
R9.5 = Reflectance of Munsell 9.5 (i.e. 90%).
R2.5 = Reflectance of Munsell 2.5 (i.e. 4.61%).
LumR = Luminance of reflectance R in the standard window.
RR = Reflectance R in the adjustable window.
RAR = Relative Area of the surface with reflectance R.
22 A one sample t-test1 revealed that matches were significantly different
from the AL rule (t(14) = 3.5; p < 0.01) but not significantly different from the
predicted HL rule (p = 0.75). Because our conclusion in favor of the HL rule is
based on a statistically null difference between the prediction based on HL rule and the luminance of the white square in the standard window, we conducted a JZS t test as described by Rouder, Speckman, Sun, Morey, and Iverson (2009) between the HL rule’s predictions and the data (1.54). This
analysis was conducted in R (R Core Team, 2018) through of the
“BayesFactor” package (Morey & Rouder, 2018). The obtained Bayes Factor BF01 of 3.68 indicates that the relative odds of the HL rule’s prediction are
3.68 higher relative to the alternative hypothesis that the data are different from the HL rule. This is positive evidence that in this experiment illumination perception was determined by the HL.
Reflectance (Munsell) matches for Experiments 1-4 are presented together in the results section for Experiment 4.
1 Data of the experiments in this project were found to be normally distributed with Kolmogorov-Smirnov
23
Experiment 2: Low frequency checkerboards - Incremental
illumination
The aim of experiment 2 was to test the HL and AL rules in simple,
poorly articulated frameworks. In this experiment, the two windows
contained only two reflectances each. Again, the standard window contained the full reflectance range and the adjustable window had only a truncated range.
Stimuli
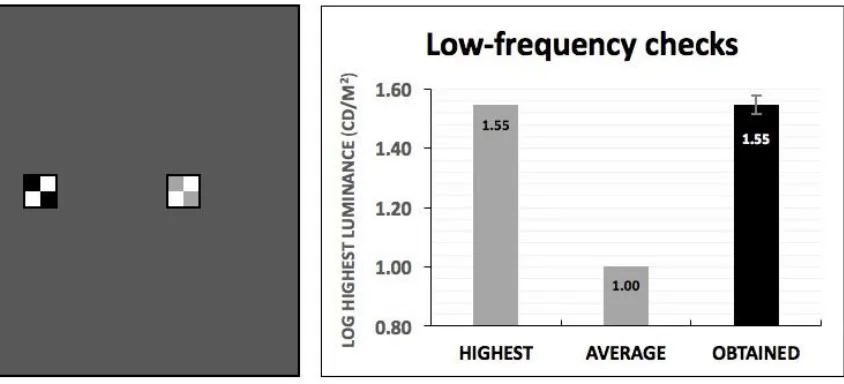
Each window contained a 2 by 2 checkerboard pattern (see figure 3). Each square subtended 1.05 degrees of visual angle. The checkerboard in the standard window was composed of white (Munsell 9.5; 35.2 cd/m-2) and black
(Munsell 2.75; 2.41 cd/m-2) checks; while the checks in the adjustable
chamber were white (Munsell 9.5) and light gray (Munsell 8).
Results
24
Figure 3. Stimuli and results for Experiment 2.
A one sample t-test revealed that illumination matches were
significantly different from the AL rule (t(14) = 14.24; p < 0.01); however, the
results did not differ significantly from the expected HL rule (p = 0.91). A JZS t
25
Experiment 3: High frequency checkerboards - incremental
illumination
Experiment 3 was identical to Experiment 2 except that we used a
higher frequency checkerboard (see Figure 4) in the two windows. We did so in order to test the possibility that as the spatial frequency of the
checkerboard increases the basis for matching illumination levels might shift from highest luminance to average luminance. The logic was as follows. As spatial frequency increases to the point at which the checks can no longer be
resolved, the only match available would be one based on the only visible luminance, corresponding to the average luminance (Linnell & Foster, 2002). Although the checks in this experiment were still very easily resolvable, we wondered whether a trend toward matching average luminance might begin
to appear before they become unresolvable.
Stimuli
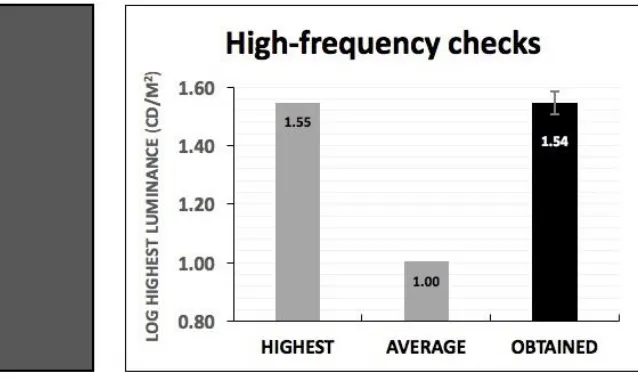
Each window contained a 6 by 6 checkerboard pattern (see figure 4, left panel). Each square shaping the checkerboard was 1.5 cm. In all other
respects the method was identical to that of Experiment 2.
Results
26 A one sample t-test revealed that the matches were significantly higher than predicted from the AL rule, calculated with equation 1, (t(14) = 11.93; p <
0.01); however, not significantly different from that predicted by the HL rule
(p = 0.6). A JZS t test was conducted comparing the HL rule’s predictions and the data. The resulted Bayes Factor BF01 of 3.78 provides, again, positive evidence in favor of the HL rule. The results are essentially identical to those of Experiment 2.
[image:27.612.213.532.313.502.2]
Figure 4. Stimuli and results for Experiment 3.
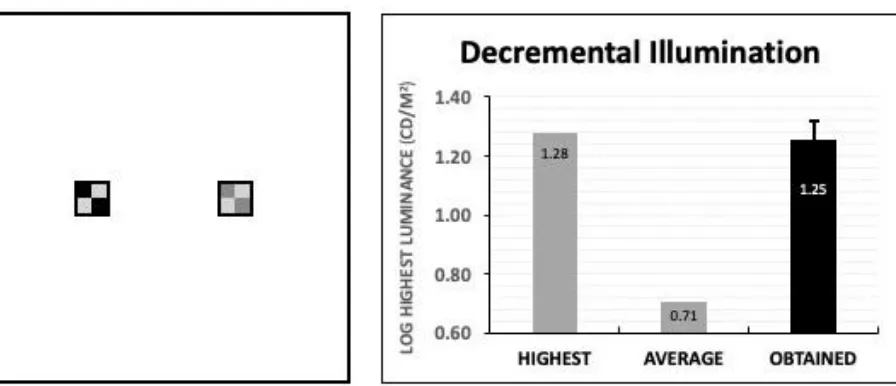
Experiment 4: Decremental illumination - Low Frequency
checkerboards
27 The stimuli in experiment 4 were identical to those in experiment 2 except that the illumination on the tunnel wall was increased (luminance of the wall surrounding the windows: 252.8 cd/m-2) and the illumination in the
standard window decreased (highest luminance: 14.5 cd/m-2). In this case, the
windows can be called shadowed occlusion frameworks.
Results
The results are shown in figure 5.
[image:28.612.86.534.362.555.2]
Figure 5. Stimuli and results for Experiment 4.
28 expected HL rule (p = 0.92). A JZS t test between the HL rule and the data
yielded a Bayes Factor BF01 of 3.79, providing positive evidence that also in experiment 4 illumination perception was determined by the HL (Figure 5).
Lightness results Experiments 1-4
Table 1 shows the average Munsell values of the first 4 experiments for the highest and lowest luminances and for both the standard and adjustable
29
Table 1. Average Munsell values from the first four experiments.
Intermediate discussion
Probably due to the relative ease of our matching task, the results of Experiments 1-4 show more decisively than previous work that perceived
illumination is based on the highest luminance in a framework, not the average. Thus, the anchoring of perceived illumination shows a striking
30 Note that anchoring to the highest luminance is equivalent to assuming a minimum intensity of illumination. Brainard and Freeman (1997) have shown that this assumption minimizes the disruptive effect of noise, showing
an advantage from an evolutionary point of view. And both they and Murray (2013) have shown that anchoring to the highest luminance is consistent with the probabilistic assumptions about lighting and reflectance advanced by a Bayesian approach.
Our finding that perceived illumination is based on highest luminance directly implies Koffka’s invariance theorem. To make this concrete, imagine a Mondrian in which the highest luminance is a middle gray. That gray would appear white and the perceived illumination would be lower than the actual.
Now imagine we add real white surface. This would have two effects: (1) it would cause the lightness of the middle gray paper to move down from white to middle gray (a roughly five-fold decrease in perceived reflectance) and (2) it would cause the perceived illumination level to increase, by roughly a
five-fold increase.
These results are in line with Zdravković, Economou and Gilchrist
31 frameworks have the same highest luminance. Rutherford and Brainard
(2002) reported experiments in which observers adjusted the illumination level in one miniature room to match that in another. They did not find that
observers matched the two rooms for highest luminance, but there is a possible explanation. Unlike our apertures, which contained only a two-dimensional pattern, the rooms in the Rutherford and Brainard study
contained three-dimensional objects. All of the objects and walls in one room
were painted different light gray shades while objects and walls in the other room were painted dark gray shades. Concavities present in their room (for example, in egg cartons) would have provided some actual reflectance
information due to the role of mutual illumination, as shown earlier by Gilchrist and Jacobsen (1984). Thus, the highest luminance would not have appeared white, and the rooms would have appeared equally illuminated even though not matched for highest luminance.
Effects of relative area
Highest luminance and average luminance are both measures of relative luminance. But empirical work has shown that anchoring of lightness is also influenced by relative area (Li & Gilchrist, 1999; Gilchrist & Radonjić, 2009;
32 surface, the lighter it appears. As Kozaki (1973) and Noguchi & Masuda
(1971) have shown, perceived illumination is also influenced by relative area. In our next experiment, we investigated this effect and whether the effect of
relative area on perceived illumination is complementary to its effect on lightness. To make such potential effects most salient, in experiment 5 we maximized the change in relative area.
Experiment 5: Test of extreme area
The configurations in the two windows are shown in Figure 7. Both are composed of the same two shades of gray, but with differing relative areas. We expected that, under conditions of objectively equal illumination in the
two windows, the illumination in the adjustable window would appear to be lower than that in the standard window, just as the lightness of the gray region would be higher in the adjustable window, compared with that of the standard window.
Stimuli
33 subtending 1.1 x 0.7 degrees of visual angle) surrounded by a large white region covering the remainder of the window while the shades were reversed for the adjustable window (Figure 6, left panel). The luminances of the white
and middle gray in the standard window were 41 and 6.6 cd/m-2, respectively.
In all other respects the experiment was identical to the prior experiments.
Results
Lightness matches: The white in the adjustable window was seen as a Munsell 9.3, half a Munsell step lighter than the white in the standard window, which was seen as Munsell 8.7. This small but significant (t(14) =2.56; p<0.05)
difference deviates from prior reports that have shown no difference for the highest luminance in such displays (Li & Gilchrist, 1999; Gilchrist & Radonjić,
2009).
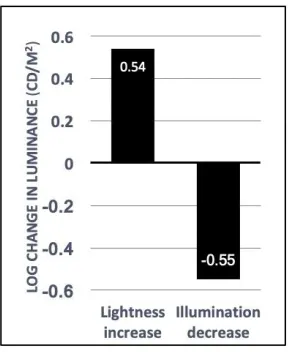
More importantly, as we expected, the large gray region in the
adjustable window appeared as Munsell 6.7, significantly lighter (t(14)=5.69; p.
34 Illumination matches: the highest luminance in the adjustable window
was set to an average of 2.16 log cd/m-2 (figure 7, right panel), significantly
higher than the 1.61 log cd/m-2 in the standard window (t(14)= 8.09 p. < 0.01).
This result implies that, when objectively equal, the illumination in the adjustable window appeared substantially darker than that in the standard window, just as the gray in the adjustable window appeared substantially lighter. Indeed, as can be seen in Figure 6, the effects on lightness and
[image:35.612.234.380.381.557.2]perceived illumination were very close to equal and opposite, differing by only 1.3%.
Figure 6. Given equal actual illumination, the illumination in the adjustable window appears lower (right column) while the lightness of the gray area is higher (left column).
35 HL + Area Hypothesis: The perceived illumination in the two
windows will appear equal when the illumination in the large-gray
window is equal to that of the small-gray window plus the amount by
which the large gray appears lighter than the small gray.
Specifically, the expected luminance of the white - according to the HL + Area rule - in the adjustable chamber is calculated as follows:
9.5 [ 4.5( arg ) 4.5( )]
R s R l e R small
HL A
+
=HL
+PR
−PR
Equation 2
Where:
HL+AR9.5 = Luminance of Munsell 9.5 in the adjustable window according to HL+ Area rule.
𝐻𝐿𝑠 = Highest Luminance in the standard window.
PRR4.5(large) = Perceived Reflectance, in log units, of the Munsell 4.5 with large area.
PR4.5(small) = Perceived Reflectance, in log units, of the Munsell 4.5 with small area.
Figure 7 shows the illumination matching results compared to three hypothetical rules. Clearly the windows were not matched for highest luminance. The highest luminance in the adjustable window, following the
illumination match, was 2.16, not significantly different from the value of 2.15 predicted by the HL rule + an area effect (p. = 0.65; Bayes Factor BF01 = 3.47), calculated by adding to the value expected according to the HL rule, the
36 neither was the value of 2.16 significantly different from the value of 2.17 predicted by the AL rule (p = 0.45; Bayes Factor BF01 = 2.92) calculated as per equation 1.
There is no obvious reason why average luminance would apply in this case when it so clearly failed in the first four experiments. Nevertheless, we conducted Experiments 6 and 7 to tease apart the predictions of
average-luminance and highest-average-luminance-plus-area.
[image:37.612.80.539.324.519.2]
Figure 7. Stimuli and results for Experiment 5. Log highest luminance (in cd/m-2) in the adjustable window
predicted by three rules and the obtained luminance.
37 2009; and Gilchrist, 2006, p. 241). They found that the results in, all of these experiments, were consistent with a very specific rule, which they called the Area rule. In a framework consisting to two regions, one darker and one
lighter, when the darker region occupies greater than half of the total
area, as the darker region becomes larger, its lightness becomes higher.
(As the darker region approaches 100% of the area, its lightness approaches white, and the lighter region comes to appear self-luminous.) When the darker
region is less than half of the total area, changes in its relative area have little or no effect on lightness.
A convenient way to understand this rule is to assume a pair of twin tendencies: one a tendency for the highest luminance to appear white and the
other a tendency for the largest area to appear white. When the darker region is less than half the total area, the two tendencies coincide and lightness is strongly anchored.
However, when the darker region covers more than half of total area,
38 reported only under these conflict zone conditions, including: (2) the range of perceived gray levels is compressed relative to the range of actual gray levels (Li & Gilchrist, 1999; Gilchrist & Radonjić, 2009), (3) self-luminosity emerges
(Bonato & Gilchrist, 1999), (4) Heinemann's (1955) enhancement effect occurs, (5) the fluorence phenomenon of Evans (1974, p. 100) occurs, and (6) Schouten and Blommaert's (1995) brightness indention effect occurs. All of these phenomena are logical consequences of the need to satisfy the
principles of both highest luminance and largest area.
Experiment 6: Conflict and no-conflict zones compared
This experiment was designed to determine something that cannot be
derived from Experiment 5: whether the effect of area on perceived illumination is primarily restricted to the conflict zone (when the darker region covers more than half of the total area), just as is the effect of area on lightness. If so, this would demonstrate a further Koffka-type
complementarity between lightness and perceived illumination, even when
39 should find that perceived illumination depends on relative area even in the no-conflict zone, when the darker region covers less than half of the total area.
Stimuli
The stimuli used in Experiment 6 are shown in Figure 8. In the first condition (no-Conflict zone) the stimulus from the standard window in Experiment 5 was paired with a stimulus in which the same two shades of
gray had equal areas. In the second condition (Conflict zone) the stimulus from the adjustable window in Experiment 5 was paired with the equal area stimulus.
Results
No-conflict zone condition
Illumination matches: As seen in Figure 8 (top), the windows were matched for highest luminance, indicating that the illumination level in the two windows appeared equal to the observers when it was actually equal, with no effect of relative area on perceived illumination. The observed
illumination matches differed significantly from the expectations based on average luminance (t(14)= 7.18; p. < 0.01) but not from expectations based on
40 indicates that the relative odds of the HL rule are 3.81 higher relative to the alternative hypothesis that the data are different from the HL rule.
Lightness matches: The white in the adjustable window was seen as a
Munsell 9.2 (log reflectance 1.92), the same as the white in the standard window (t(14) = 0.49; p = 0.63; Bayes Factor BF01 = 3.42). The gray in the adjustable window was seen as a Munsell 5.4 (log reflectance 1.35),
significantly lower (t(14)= 2.66; p. < 0.05) than the gray in the standard
window, which was seen as Munsell 6.1 (log reflectance 1.47). This is a rather modest effect given the relatively large change in the relative area of the gray region.
Thus, these results show little effect of relative area on lightness
(similar to earlier reports) and no effect on illumination.
Conflict zone condition
Illumination matches: The observers set the illumination level in the adjustable window significantly higher than predictions based on highest
luminance (t(14)= 2.15; p. <0.05). This implies that when objectively equal, the
41 effect of area (t(14) = 0.33; p = 0.75; Bayesian Factor BF01 = 3.64) or from
predictions based on average luminance (t(14)= 0.39; p. = 0.71; Bayesian Factor
BF01 = 3.57).
The failure to distinguish these predictions stems in part from the relatively high variability in the data. Nevertheless, Experiment 6, taken as a whole, suggests that the matches were not based on average luminance
because the matches deviated strongly from average luminance in the non-conflict zone.
Lightness matches: The white in the adjustable window was seen as a Munsell 9.3 (log reflectance 1.93), the same as the white in the standard window (t(14) = 0.76; p =0.46; Bayesian Factor BF01 = 2.97). The gray in the
adjustable window was seen as a Munsell 7.7 (log reflectance 1.73), significantly higher (t(14)= 4.97; p. < 0.01) than the gray in the standard
42
Figure 8. Top: No-conflict zone stimuli and results. Bottom: Conflict zone stimuli and results, showing predicted
(light gray) and obtained (dark gray) highest luminance in the adjustable window.
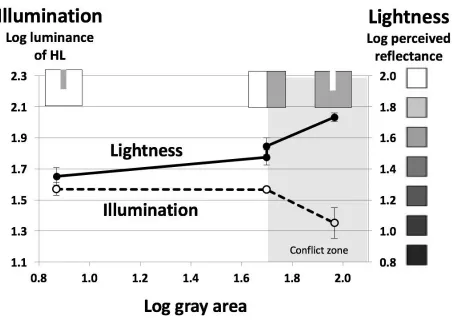
Figure 9 shows both lightness and illumination matches in both conflict and
43
Figure 9. Results from Experiment 6. Lightness matches: Solid line; right-hand Y-axis (log perceived reflectance of
darker region). Illumination matches: Dashed line; left-hand Y-axis (log luminance of highest luminance). NOTE:
these data points were derived by transforming the matching data to represent perceived illumination levels
given equal actual illumination in the two windows. Conflict zone shown in gray.
The results are consistent with our predictions. First, consider the
results for lightness of the darker region (solid line, Figure 9). The slope of the line representing the increase in lightness relative to the increase in area was significantly steeper (t(28) = 3.61; p. < 0.01) in the conflict zone than in the
no-conflict zone. This is just the pattern of results previously reported in earlier
44 when entering the conflict zone the lightness of the darker region increases with an increase in its area more than when the increase in area occurs outside the conflict zone.
Now consider the results for perceived illumination. The left region of Figure 9 and the top of Figure 8 show the results for the non-conflict zone, where, as in our first 4 experiments, the windows were matched, almost
exactly, for highest luminance, implying no effect of relative area on perceived illumination. The results in the conflict zone, shown at the right region of Figure 9 and in the bottom of Figure 8, on the other hand, show a different pattern. There the highest luminance in the adjustable window was
significantly higher than that of the standard window, as would be expected if
an area effect were at play.
Experiment 7: Conflict zone with black and white
Although our results so far support our proposed area effect on perceived illumination, as opposed to matching for average luminance, we
conducted an additional experiment designed to tease apart predictions based on highest luminance plus an area effect from predictions based on average luminance. This experiment was identical to the conflict condition of
45 This allowed a greater divergence between the results predicted by the
average luminance hypothesis and the highest luminance plus area
hypothesis. It is easy to show that, as the darker region is made lighter, and
approaches white, the difference between the predictions based on average luminance versus highest luminance plus area approaches zero. Likewise, as the gray region is made darker the difference between the predictions
becomes greater.
Both windows contained white (Munsell 9.5; 35.2 cd/m-2) and black
(Munsell 2.; 2.41 cd/m2), though in different proportions. The luminance of
the wall surrounding the windows was approximately 0.34 cd/m-2.
Results
Illumination matches: Figure 10 shows the stimuli in the two windows and the average illumination matches compared with predictions. The highest luminance in the adjustable window was set to an average of 1.63 cd/m-2
(figure 10, right panel), significantly lower than the prediction of 2.09 based
on the Average Luminance (t(14)= -4.71 p. < 0.01). The obtained mean value of
46 rule (t(14)= 0.8; p = 0.44; Bayesian Factor BF01 = 2. 9) calculated as per
equation 2.
Lightness matches: As expected, no significant difference was found
between the lightness values of the white in the standard (Munsell 8.9) and adjustable (Munsell 8.7) windows (t(14)= 1.25; p = 0.23; Bayesian Factor BF01 = 2). Also as expected, the lightness of the darker region in the
[image:47.612.208.530.360.546.2]adjustable window (Munsell 3.6) was significantly higher than that of the standard (Munsell 3.1) window (t(14)= 2.35; p. < 0.05).
Figure 10. Left: white and black conflict zone stimuli used in Experiment 7. Note that the luminance of the wall
was lower than that of the black region in the stimuli, although this cannot be represented on paper. Right:
47
Discussion
In this work, we sought to answer two questions. First, what is the basis for perceived illumination? Second, how is perceived illumination related to lightness?
1. This work shows clearly that perceived illumination is not based on
average luminance, as proposed by Helmholtz (1866) and Katz (1935). Except under the rather rare conditions when effects of area or mutual illumination are at work, perceived illumination is based on highest luminance, consistent with empirical findings by Oyama (1968), Noguchi & Masuda (1971), and
Kozaki (1973). Once subjects in our experiments had matched illumination levels in the two windows, we found that the windows had almost the same highest luminance but very different average luminances. We found this same pattern of results for both Mondrian patterns and checkerboard patterns, for both higher and lower spatial frequency checkerboards, and for windows with
both higher and lower illumination than that of the surrounding wall. The lack of effect of spatial frequency fails to support our suspicion that the basis of perceived illumination might shift from highest luminance to average
48 2. The fact that highest luminance has been shown to anchor both
lightness values and perceived illumination level provides the key to the
relationship between lightness and perceived illumination. It suggests that, for
a target of constant luminance, an increase (or decrease) in perceived
illumination level will be accompanied by an equal and opposite decrease (or increase) in its perceived lightness value, just as Koffka claimed. To be more concrete, if a higher luminance is added to a window, the lightness of a fixed
luminance target will go down, proportionate to the increase in highest luminance, while the perceived illumination in the window will go up by the same amount.
Exceptional conditions
Under certain conditions involving scaling effects, Koffka’s principle cannot apply directly. The scaling problem is a twin of the anchoring problem. While anchoring requires a point of contact between relative luminance and absolute lightness, scaling involves the way luminance differences are
49 reflectance values will also be 5:1. Under such Wallach scaling conditions, Koffka’s invariance theorem appears to be valid.
Koffka’s principle cannot apply (at least not in such a simple way) when
scaling is distorted by special circumstances, such as when area effects, gamut compression, or scale normalization effects are at work. Under these
conditions, the perceived range of grays is either expanded or compressed,
relative to the actual range. Consequently, changes in perceived illumination could in principle be equal and opposite to one of the gray shades, but not to the others.
Area effects. As noted earlier, area effects on lightness take the
following form. In a framework composed of two regions, when the darker
region covers more than half of the total area, increases in its area cause it to become lighter. Thus, the lightness difference between the darker and lighter regions becomes increasingly compressed relative to their luminance
difference. For this reason, we have referred to these conditions as the conflict
50 (0.7 Munsell steps) in the adjustable window, despite an extensive change in its area. Under these conditions the two windows were matched for highest luminance. Overall, this implies that Wallach (1:1) scaling (i.e., no
compression) applies to these conditions, as does the Koffka principle.
In Experiment 6, Condition B, the change in relative area of the darker region did fall within the conflict zone and we observe a significant change in
its lightness, despite a much smaller change in area of the gray region,
compared to Condition A. This is shown by the solid line of Figure 8, in which lightness (that is, log perceived reflectance) is plotted against log area of gray. The slope of the change in lightness is significantly steeper in the conflict zone than outside that zone. This agrees with previous empirical work on the
influence of relative area on lightness, described by the Area rule given above (Li & Gilchrist, 1999; Gilchrist & Radonjić, 2009; Diamond, 1955; Stevens, 1967; Newson, 1958, and many others). The Koffka principle, in its simple form, does not apply in the conflict zone and, correspondingly the windows
are not matched for highest luminance.
Other re-scaling effects involve gamut compression and scale
51
Area effects and Koffka’s theorem
It should be noted that conditions that satisfy the conflict zone are quite rare in the real world, especially as Radonjić and Gilchrist (2014) have shown
that the darker region filling more than half of total area must be a single homogeneous region; it cannot be the aggregate of multiple regions, even if those regions are equal in luminance.
However, even under these rare conditions, our results have revealed that a variant of Koffka’s rule applies. Figure 9 shows the matches for both lightness and perceived illumination in both the conflict and non-conflict zones. Two things are obvious in this plot. First, both lightness and perceived illumination change mainly in the conflict zone, with little or no change in the
non-conflict zone. Second, the change in perceived illumination is
approximately equal and opposite to the change in lightness, consistent with the Koffka principle. But note the Y-axis. It represents the lightness of the darker region, not the lighter region. Enlarging the darker region makes it
appear lighter and makes the illumination appear darker (by the same amount). But the lighter region, being anchored at white, does not change.
52 consistent with inverse optics. Using a lower luminance to anchor lightness values in a shadow is adaptive, given that the shadow reduces the luminance of every surface within it. But the by-now well-established effect of relative
area on lightness is not obviously adaptive, given that it does not function to correct a distortion in the retinal image introduced by an environmental factor. That is, the reflectance of a real-world paper does not change as a function of the size of the paper, so why should a change in size cause a
change in perceived lightness?
Implications for anchoring theory
Until now anchoring theory was solely a theory of surface lightness and no reference was made to perceived illumination level. Our findings have
clarified the relationship between lightness and perceived illumination level and have allowed us to accommodate perceived illumination level within anchoring theory.
53 depends simply on the luminance ratio between the highest luminance values in the two frameworks. And the lightness of a given luminance value differs between these frameworks in an inverse way. We have also found a symmetry
between lightness and perceived illumination, even when scaling is distorted by area effects. Under conditions that produce area effects (i.e., when the darker of two regions within a window occupies at least half of the total area) any increase in the darker area causes its lightness to increase by the same
amount that the perceived illumination in the window decreases.
Conclusions
1. The perceived level of illumination within a field of illumination is associated with the highest luminance within that field, not with the
average luminance.
2. Except when the relationship between luminance differences and lightness differences is distorted (i.e., scaling effects), the fact that both lightness and perceived illumination are anchored by highest
luminance directly implies Koffka’s invariance theorem. When the highest luminance within a framework changes, the perceived
54 contradicts suggestions by Wallach (1948) and Beck (1972) that lightness and perceived illumination are not related in a systematic way.
3. Under conditions subject to area effects, Koffka’s principle applies to the darker region, but not the lighter region, which is anchored at white.
4. Perceived illumination level can now be incorporated systematically
55 References:
Adelson, E. H. & Pentland, A. P (1990). The perception of shading and reflectance (Vision and Modeling Technical Report 140): MIT Media Laboratory.
Adelson, E. H. (1993). Perceptual organization and the judgment of brightness.
Science, 262(5142), 2042-2044.
Adelson, E. H. (2000). Lightness Perception and Lightness Illusions. New Cognitive Neuroscience, 339.
Alhazen, I. (1083/1989). Book of optics. In The optics of Ibn al-Haytham (A. I. Sabra, Trans.). London: Warburg Institute. (Original work published
1083).
Anderson, B. L., Whitbread, M. & de Silva, C. (2014). Lightness, brightness, and anchoring. Journal of Vision, 14(9), 7-7.
Arend L.E. (1994). Surface colors, illumination, and surface geometry:
Intrinsic-image models of human color perception. In: Gilchrist A, editor.
56 Barrow, H. G. & Tenenbaum, J. M. (1978). Recovering intrinsic scene
characteristics from images. Computer Vision Systems, 3–26.
Beck, J. (1959). Stimulus correlates for the judged illumination of a surface.
Journal of Experimental Psychology, 58(4), 267-274.
Beck, J. (1961). Judgments of surface illumination and lightness. Journal of Experimental Psychology, 61, 368-375.
Beck, J. (1972). Surface Color Perception: Cornell Univ. Press.
Bergström, S. S. (1977). Common and relative components of reflected light as information about the illumination, colour, and three-dimensional form of objects. Scandinavian Journal of Psychology, 18(3), 180-186. Blakeslee, B. & McCourt, M. E. (1999). A multiscale spatial filtering account of
the White effect, simultaneous brightness contrast and grating induction.
Vision research, 39(26), 4361-4377.
Bonato, F. & Gilchrist, A. (1999). Perceived area and the luminosity threshold.
Perception & Psychophysics, 61(5), 786-797.
Bonato, F. & Gilchrist, A. L. (1994). The perception of luminosity on different backgrounds and in different illuminations. Perception, 23, 991-1006.
57 Brainard, D. H. & Maloney, L. (2011). Surface color perception and equivalent
illumination models. Journal of Vision, 11(5), 1–18.
http://doi.org/10.1167/11.5.1
Brainard, D. H. & Wandell, B. A. (1991). A bilinear model of the illuminant’s effect on color appearance. Computational models of visual processing, 171-186.
Brainard, D.H., Wandell, B.A. & Chichilnisky, E. J. (1993). Color constancy: from physics to appearance. Current Directions in Psychological Science, 2, 165-170.
Diamond, A. (1955). "Foveal simultaneous brightness contrast as a function of
inducing-field area." Journal of Experimental Psychology 50: 144-152.
Doerschner, K. Boyaci, H. Maloney, L. T. (2004). Human observers compensate for secondary illumination originating in nearby chromatic
surfaces. Journal of Vision, 4(2), 92–105
58 Faul, F., Erdfelder, E., Lang, A. G., & Buchner, A. (2007). G* Power 3: A flexible
statistical power analysis program for the social, behavioral, and biomedical sciences. Behavior research methods, 39(2), 175-191.
Fechner, G. T. (1889). Elemente der Psychophysik (2nd ed.). Leipzig: Breitkopf & Härtel.
Gelb, A. (1929). Die "Farbenkonstanz" der Sehdinge (The color of seen
things). Handbuch der normalen und pathologischen Physiologie. W. A. von Bethe. 12: 594-678.
Gerhard, H.E. & Maloney, L.T. (2010) Detection of light transformations and concomitant changes in surface albedo. Journal of Vision July 2010, Vol.10, 1.
Gilchrist A.L. (2006). Seeing Black & White. Oxford University Press.
Gilchrist, A. L. & Jacobsen, A. (1983). Lightness constancy through a veiling luminance. Journal of Experimental Psychology: Human Perception and Performance, 9(6), 936.
59 Gilchrist, A.L. & Radonjić, A. (2009). Anchoring of lightness values by relative
luminance and relative area. Journal of Vision, 9(9),13, 1-10.
Gilchrist, A.L. (1979). The perception of surface blacks and whites. Scientific
American, 240, 112-123.
Gilchrist, A.L., Delman, S., and Jacobsen, A. (1983). The classification and integration of edges as critical to the perception of reflectance and
illumination. Perception & Psychophysics, 33(5), 425-436.
Gilchrist, A., Kossyfidis, C., Bonato, F., Agostini, T., Cataliotti, J., Li, X., et al. (1999). An anchoring theory of lightness perception. Psychological Review, 106(4), 795-834.
Grossberg, S. & Todorovic, D. (1988). Neural dynamics of 1-D and 2-D brightness perception: A unified model of classical and recent phenomena. Perception & psychophysics, 43(3), 241-277.
Helmholtz, H. von. (1866/1925). Treatise on Physiological Optics. (3rd ed., J. P
C. Southall, Trans.). (N. Y. O. Society & of A. (Original work published
1866), Eds.).
60 Heinemann, E. G. (1955). Simultaneous brightness induction as a function of
inducing- and test-field luminances. Journal of Experimental Psychology, 50(2), 89-96.
Hering, E. (1874, 1964). Outlines of a Theory of the Light Sense. (L.M. Hurvich & D. Jameson, Trans.). Cambridge, Mass.: Harvard University Press.
Kardos, L. (1934). Ding und Schatten. Zeitschrift für Psychologie, Erg. bd 23. Kartashova, T., Sekulovski, D., de Ridder, H., te Pas, S., & Pont, S. (2015). A
comparison of physical and visual light fields structures. Journal of vision, 16(10), 9.
Katz, D. (1935). The world of colour (RB MacLeod & CW Fox, Trans.). London: Kegan Paul, Trench, Trubner.
Koffka, K. (1935). Gestalt psychology. NY: Harcourt, Brace & World.
Kozaki, A. & Noguchi, K. (1976). The relationship between perceived surface-lightness and perceived illumination. Psychological Research, 39(1), 1-16. Kozaki, A. (1965). The effect of co-existent stimuli other than test stimulus on
brightness constancy. Japanese Psychological Research, 7(3), 138–147.
61 Li, X. & Gilchrist, A. (1999). Relative area and relative luminance combine to
anchor surface lightness values. Perception & Psychophysics, 61(5), 771-785.
Linnell, K. & Foster, D. (2002). Scene articulation: dependence of illuminance estimates on number of surfaces. Perception, 31, 151-159.
Marr, D. (1982). Vision: WH Freeman.
Morey R.D. & Rouder J.N. (2018). BayesFactor: Computation of Bayes Factors
for Common Designs. R package version 0.9.12-4.2. https://CRAN.R-project.org/package=BayesFactor.
Murray, R.F. (2013) Human lightness perception is guided by simple
assumptions about reflectance and lighting. Human Vision and Electronic
Imaging XVIII
Mury, A.A., Pont, S.C. Koenderink , J.J. (2007). Light field constancy within natural scenes. Applied Optics, 46(29), 7308-7316.
Nakayama, K. (1999). Mid-level vision. In: Wilson RA, Keil FC The MIT Encylopedia of the cognitive sciences. Cambridge: MIT Press.
62
Quarterly Journal of Experimental Psychology 10: 82-95.
Noguchi, K. & Kozaki, A. (1985). Perceptual scission of surface-lightness and illumination: An examination of the Gelb effect. Psychological Research,
47(1), 19-25.
Noguchi, K. & Masuda, N. (1971). Brightness changes in a complex field with changing illumination. Japanese Psychological Research, 13(2), 60-69.
Oyama, T. (1968). Stimulus determinants of brightness constancy and the
perception of illumination. Japanese Psychological Research, 10(3), 146– 155.
R Core Team (2018). R: A language and environment for statistical
computing. R Foundation for Statistical Computing, Vienna, Austria. URL
https://www.R-project.org/.
Radonjić, A. & Gilchrist, A. L. (2014). Lightness perception in simple images:
Testing the anchoring rules. Journal of Vision, 14(13), 25-25.
63 Rouder, J. N., Speckman, P. L., Sun, D., Morey, R. D., & Iverson, G. (2009).
Bayesian t tests for accepting and rejecting the null hypothesis. Psychonomic bulletin & review, 16(2), 225-237.
Rutherford, M. D. & Brainard, D. H. (2002). Lightness constancy: a direct test of the illumination estimation hypothesis. Psychological Science, 13, 142-149.
Schouten, S. & Blommaert, F. (1995). Brightness indention: A novel
compression mechanism in the luminance-brightness mapping.
Perception and Psychophysics, 57 (7), 1023-1031.
Shapiro, A. & Lu, Z. L. (2011). Relative brightness in natural images can be accounted for by removing blurry content. Psychological Science, 22(11),
1452-1459.
Simons, D. J. & Levin, D. T. (1998). Failure to detect changes to people during a real-world interaction. Psychonomic Bulletin & Review, 5(4), 644-649.
Singh, M., & Anderson, B. L. (2002). Toward a perceptual theory of
64 Soranzo, A. & Agostini , T. (2006a). Photometric, geometric, and perceptual
factors in illumination-independent lightness constancy. Perception & Psychophysics, 68(1), 102-113.
Soranzo, A. & Agostini, T. (2006b). Does perceptual belongingness affect lightness constancy? Perception, 35, 185 – 192.
Stevens, J. C. (1967). "Brightness inhibition re size of surround." Perception and Psychophysics 2: 189-192.
Wallach, H. (1948). Brightness constancy and the nature of achromatic colors.
Journal of Experimental Psychology, 38, 310-324.
Wallach, H. (1976). On Perception. New York: Quadrangle/The New York Times Book Co.
Xia L., Pont, S.C., & Heynderickx, I. (2014). The visual light field in real scenes. i-Perception 5(7), 613-629.
Xia, L., Pont, S. C., & Heynderick, I. (2017). Separate and simultaneous adjustment of light qualities in a real scene. i-Perception, 8(1),
65 Zdravković, S., Economou, E. & Gilchrist, A. (2012). Grouping illumination